Theoretical and practical view of development
and differences in the application of productive
consumption components in Czech and Slovak
households under current economic conditions
Marianna Psárska1,Ύ
1Institute of Technology and Business in České Budějovice, School of Expertness and Valuation,
Okružní 517/10, 37001 České Budějovice, Czech Republic
Abstract. The aim of the contribution is to point out the possible causes of changes and differences in the behavior of current households in the context of new consumption theories and current conditions by means of selected categories of net cash expenditure of households2 embodying the
productive aspect of consumption. The monitored data is based primarily on Family Account Statistics for the period of 2010-2017. The benefit of this contribution is in particular the application and clarification of the links between the current theories and practice which helps to understand the economic behavior of households. The conclusions of the article point out that household decision-making is largely influenced by the economic situation of households, but also by other factors which we also deal with in the contribution. It is clear from the conclusions that Czech and Slovak households apply a different approach to expenditures on productive components of consumption, which in the long run will deepen the differences between countries. In the context of the evolving direction of the Behavioral Economy, it would be helpful to include the monitoring of psychological factors in Family Account Statistics.
Key words: household consumption, productive components of consumption, net cash revenue, net cash expenditure, household savings, quality of life
1 Introduction
If we want to examine the productive aspects of household consumption from a theoretical point of view, we must abstain from some constraints imposed by traditional microeconomic theories, such as the principle of unlimited rationality, or the optimization of utility understood as a subjective phenomenon. If we assume this optimization assumption, it means that it is possible to earmark an absolute final consumption, which
*Corresponding author: [email protected]
2A privately-owned household consisting of persons sharing a permanent dwelling in one home and
ends definitively with the prospect of utility and therefore does not have a productive character. In the real economic system, however, this does not work and there are demonstrably many examples of a functioning productive aspect. Economics of productive consumption by R. Valencik [1] considers the household behavior and the growth of the present value of the expected future income from the creation and operation of the assets forming their "family portfolio" as a target orientation. Another prerequisite from which we abstain is the so-called exogenous character of utility in relation to the economic system, which means that the relationships and mechanisms covered by the classical microeconomic theories in which human subjects interact with each other have no role in creating their subjectively perceived benefit.
Traditional microeconomic theories follow the so-called modern theories of consumption, which emerged in response to the theory of consumption expenses and savings by J. M. Keynes [2]. In contrast to Keynes' theory of purchasing consumer goods, modern theories focus on explaining the use of consumer goods services, which is a step closer to the issue we are dealing with. They are therefore trying to capture the real flows of consumption of services provided by consumer goods purchased by households. This approach is called actual consumption. For example, the work of J. S. Duesenberry, I. Fisher, F. Modigliani, R. E. Brumberg, A. Anda, M. Friedman, T. Sargent, and many others [2] is a reference to modern consumer theories.
Especially interesting is the theory of consumption based on the hypothesis of a permanent pension developed by Milton Friedman. It was based on criticism of the simple consumer function of J.M. Keynes, and follows the work of Irwing Fisher, who in his consumption function considers the impact of wealth and interest rate on consumption. M. Friedman's specific contribution is that he transferred the Fisher idea into a consumption-permanent relationship and indicated how the entity anticipates future pensions that are the determinants of its wealth and permanent retirement. Consumption in this theory is understood as a function of permanent retirement. M. Friedman considers wealth and retirement as identical concepts. According to M. Friedman's more detailed specification of nominal wealth, its five components can be distinguished, namely money, bonds, shares, physical goods, and human capital. Here he points out and proves a very interesting idea, that whether or not the households save or consume, they create their own asset portfolio from the mentioned components of nominal wealth and act in such a way as to maximize the present value of the future income or, of the return on the portfolio [3].
Also G. Becker introduced a microeconomic analysis of consumption to examine human behavior, interpersonal relationships, and off-market relationships. He dealt with the link between quality of life and the economy. His work had a great theoretical benefit because he expanded the perception of consumption and contributed to the formation of contemporary theories. According to G. Becker: "The choice of consumption and other activities of an average person depends on his or her childhood, life experiences, social interactions and cultural influences" [4]. Which, in connection with the productive aspects of consumption, talks about possible motives for their full application in the lives of individuals or households from the view of the environment, where a certain amount of room for corrections is also created by the applied economic policy.
Classical, or traditional and new theories of consumption are the theoretical background of past consumption trends. Each of these consumption theories emerged in a particular environment and period.
This development has not occurred and is still continuing mainly thanks to Behavioral Economists. New views on consumption and the direction of its development are conditioned by the decision-making mechanism, which is the key and basis of understanding the formation of current consumption. This is ultimately visible also in the form of realized expenditures, whether individuals or the whole household. In addition to
this basic mechanism, when looking at households and their behavior, it is necessary to perceive the situation in the income level, ie the existing stratification of society and the differences in the economic situation of individual types of households, which tells us much about their decision-making approach.
Behavioral Economics combines psychology with economics to provide answers to many challenging questions about economic decision-making in the current times. It deals with the circumstances of individuals' failure and the causes of crises. Behavioral economics justifies the existence of some group irrationality. As a result, for example, the emergence of bubbles in markets or crises. The founders of this new direction were D. Kahneman, R. Thaler and A. Tversky†.
R. Thaler also analyzes how people can be encouraged to make better decisions. It outlines how governments can use behavioral models to increase the efficiency and quality of a wide range of public services. By pointing out some sort of possible positive interaction or correct motivation to change behavior even in our conditions. R. Thaler's research can also be applied to everyday human economic decisions as well as to the behavior of the whole market. In doing so, he incorporated psychologically realistic thinking into economic decision-making. His research into the effects of limited human rationality, social priorities and lack of self-control shows how these human characteristics systematically influence the economic decision-making of individuals.
Modern research [5-9] has also highlighted the importance of emotions that greatly influence a human's behavior. From the perspective of behavioral economy preferences, one prefers to choose an alternative that brings about a change of wealth. Productive components of consumption definitely bring this possibility of change of wealth, but it must be borne in mind that choosing the alternatives does not play the most important role of static wealth but its relative expression and relative change towards a reference point. The question, however, is whether actual households are really aware of this fact. Or is it only applicable to a tiny percentage of households?
The behavioral approach is based on the assumption that human behavior motivates two major systems. One is based on looking for a reward and the other on resistance to loss. The reward system creates values, priorities, and motivates individual behavior. Avoidance of risk is, on the contrary, a protective function aimed at the survival of an individual. So, here is the need to reflect on what rewards the productive components of consumption bring, is there a threat of any kind of loss? Or the question of how to protect the productive components of household consumption from risks? Questions of this type lead us to the motives that lead people to spend their money on any kind of expenditure.
According to D. Kahneman [10], the current view of consumer decision-making is focused on three main themes, namely heuristics of judgment, risky choices and framing. In all three areas thoughts, intuitions and preferences were studied, which one thinks quickly and without long thinking. There is a distinction between intuitive and deliberate thought processes. Together, D. Kahneman and A. Tversky argue that intuitive judgment belongs to the same place as deliberate thinking, but focuses on the existing discrepancies between intuition and knowledge especially in statistics. Are the productive components of household consumption an intuitive or deliberate thinking process? D. Kahnemann also deals with the formalization of intuition and the issue of change of wealth or function of values.
Another author of behavioral economics is D. Ariely. Through many experiments, he has come to the conclusion that "people deceive themselves by their own imagination as they
† At the time of its inception, this theory was still called "prospect theory". The breakthrough work is
act reasonably and deliberately, but are in fact impressionable and vulnerable. They are prone to make misconceptions about bad shopping and investment decisions. These decisions are not only irrational but even foreseeably irrational" [11]. According to him, in practical life, we compare things that lie side by side, things that are easy to compare. On the contrary, we avoid comparing things that need to be very thought out. In human decision-making, accidental addiction and the anchor of the past also play an important role. So, if we decide on the old anchors and memories, it can not be said that the trade will give us all the greatest personal happiness and benefit.
The analysis of D. Ariely, which focuses on the magic word "FREE", is a very exciting one, and we often make our decision and we are making a decision we did not want and which is not the best from the point of view of rational decision-making. Whatever is free, it seems to us a lot more valuable than what it really is. And why? Because human beings have instinctive fear of loss [12]. The success of this word is based on this fact and is often used, for example, in pharmacies for the sale of supplementary medications, and thus falls under household spending on health and productive components of consumption.
Another point of view on this issue is the theory of G. S. Becker. It uses the economic outlook on rationality in both non-economic and non-market areas. He applied the economic concept of rationality to all forms of human decision making. G. S. Becker, for example, considers habit to be rational if the increase in past consumption increases current consumption [13]. For reflection on the rationality of habitual behavior, the key point is the knowledge that the extent of addictive activities is relatively high in humans, so we can not exclude them from economic analyzes. Is it possible that just the habit of free public education within our economic system and family is just the necessary minimum spending that hampers the possible change from the point of view of their development and the growth of well-being in the long run? Or is there another cause?
2 Data and methods
The data base for this contribution consists mainly of outputs from the family accounts statistics where data for the Slovak Republic for 2011, 2012 and 2015 are obtained through a network of randomly selected households. The figures for 2013, 2014, 2016 and 2017 were simulated. Methodology in the Czech Republic is more unified by 2016 and the research is carried out on a set of 3000 households selected by deliberate quota selection, which limits the possibility of generalizing data to the whole population, but allows for a deeper analysis of the differences between household types, which I consider very positive for the purposes of this article. According to the data of the Czech Statistical Office, the methodology will change in 2017 (data for 2017 are not available). According to the Family Accounts Stats, the partial sourcing from the EU-SILC sample was selected by selecting from existing household samples and changing from quota to random selection.
Consumption is generally understood as the value of consumer goods and services purchased by households. The Family Account Statistics is covered through the amount and structure of net cash expenditures, depending on the status of household preference and the number of dependent children. The reason for choosing these household groups is to ensure that net cash expenditure is comparable to net cash income and at least partially capture the differences between households in both countries. Thanks to this link, we can see the economic situation of individual households and how they react to changing conditions. The method of a scientific paper is the form or procedure by which the intended result is reached from a certain initial state. Therefore, the methods used to produce this contribution are chosen to lead to the achievement of the stated primary goal. The theoretical and practical definition and subsequent possible comparison of productive consumption components in Czech and Slovak households, as well as the availability of data and the
relatedness of the methodology in both countries, are a key issue for us in connection with data collection. To do this, it is necessary to choose the thematically appropriate groups of net cash expenditures, whose choice was in terms of content suitability, value in the consumer household basket and our discretion in relation to the importance of status within the category of productive components of expenditures. In order to best assess not only the economic situation of households in both countries but also their overall quality of life, we have used reporting according to the spheres of quality of life. This reporting is based on the fact that household consumption is one of the components of quality of life and is literally its material component. The following spheres of quality of life are known: [14]: - The out-of-work sphere consists of expenditure aimed at satisfying basic material needs, therefore on food and non-alcoholic beverages, alcoholic beverages and tobacco, clothing and footwear, housing, water, gas and electricity, furniture and furnishings and health. - The sphere of leisure time is understood as the part of the day when one acts up to his own discretion, choices and possibilities of activities that contribute to his relaxation and self-realization. It arises after deduction of work and out-of-work time, that means that the spheres of the way of life are both conditioned and limited by each other. The structure of expenditure consists of expenditure on recreation and culture, education, hotels, cafes and restaurants.
- The cross-sectional sphere of expenditures takes up activities that blend in with other spheres of life. We include travel, communications, and various services to modernize one's way of life. But we also include some of the complementary equipment and commodities of households that have the character of luxurious estates, and thus denote the modernization of the way of life, of the reached level of living standards.
- The fourth sphere of quality of life is the sphere of work, which is not embodied in expenditure.
From the development of the share of spheres of quality of life in households, the so-called consumption models are derived. According to I. Laluhu, there are three models of consumer behavior of our households, namely the economical, luxury and conservative models of consumption. The starting point of this breakdown is the amount of spending going towards the three spheres of quality of life [15]. Consumption and quality of life are also linked to prosperity [16]. According to S. Mc. Calla it is the starting point of linking the notion of quality of life with the terms "satisfaction of needs" and "happiness" [17].
In fulfilling the aim of this contribution, we use the method of economic analysis where we analyze the individual consumption theories and the productive components of consumption and analyze in detail how we examine these parts and select the key facts. At the same time, we use a comparison method and the critical analysis of related literature, which is chosen because of the necessity of comparison, such as a comparison of consumption theories, their essence and benefits. From this section, a number of questions emerged on the basis of which we have chosen to select the data base and to process it appropriately using mathematical methods and several other commonly used methods, such as the method of observation, comparison, synthesis, induction, deduction, or the overall historically-logical process of examining the monitored variables with a consideration to the possibilities of the future.
3 Results
living for households. In the long run, their importance should increase in the interest of improving the quality of life and overall development. Typical examples are, for example, educating members of the household, maintaining good health and overall physical and psychological well-being, including spending on health, creating and maintaining social contacts, creating the conditions for the most effective use of leisure time, cultivating the image of the household, recreation [18].
3.1 The current economic situation and the quality of life of households in the Czech Republic and Slovakia
[image:6.482.60.423.385.574.2]As the monitored countries were once a part of one state, they have many similar "character" features. But nowadays, there are many differences between them that we will focus on in terms of economic situation and quality of life. To begin with, it is essential to say that the monitored countries do not have the same currency. For this reason, for the sake of comparability, the following tables are given in percentages, allowing easier comparison between the two countries [19]. From Table 1, we see that the level of net monetary incomes, expenditures and savings in terms of the difference between earnings and expenditure (in % of income) is increasing in both countries, creating favorable conditions for increasing the share of productive components in household consumption. It is also clear from the table that households are not only earning income but also spending. The positive thing is that it grows more slowly. In view of the absolute height of the monitored quantities, the best position of the households of SZČO and the households of employees. In the worst economic situation are the households of others, and especially in Slovakia (eg. unemployed) [20].
Table 1. Overview of Percentage Changes in Monthly Net Cash Income, Expenses, and Savings in Czech and Slovak Households from the view of Household Preference
2010 2012 2015 2016
SR ČR SR ČR SR ČR SR ČR
Households of employees
Change in income 2.0% 2.5% 19.6% 5.0% 4.3% 5.5% Change in expenses 3.2% 1.3% 11.5% 1.9% 0.8% 0.4% Income savings 12.0% 14.2% 11.0% 15.2% 17.0% 17.8% 19.8% 21.8% Households of
self-employed persons
Change in income 0.8% 7.7% 16.3% -0.7% 4.0% -0.3% Change in expenses 1.6% 7.5% 18.4% -6.7% 0.8% 0.3% Income savings 14.4% 3.9% 13.7% 4.1% 12.1% 9.9% 14.8% 9.4%
Households of retirees
Change in income 8.9% 7.9% -3.8% 3.7% 2.8% 0.2% Change in expenses 5.5% 4.9% -7.2% 2.2% 0.9% 0.3% Income savings 12.0% 3.5% 14.7% 6.2% 17.7% 7.4% 19.3% 7.3%
Households of others
Change in income 3.4% 5.6% -21.7% -1.1% 5.0% 0.0% Change in expenses 2.8% 3.4% -15.4% -0.5% 2.4% 0.0% Income savings 6.2% 4.1% 6.7% 6.1% -0.7% 5.5% 1.8% 5.5% Source: Author.
living for households. In the long run, their importance should increase in the interest of improving the quality of life and overall development. Typical examples are, for example, educating members of the household, maintaining good health and overall physical and psychological well-being, including spending on health, creating and maintaining social contacts, creating the conditions for the most effective use of leisure time, cultivating the image of the household, recreation [18].
3.1 The current economic situation and the quality of life of households in the Czech Republic and Slovakia
As the monitored countries were once a part of one state, they have many similar "character" features. But nowadays, there are many differences between them that we will focus on in terms of economic situation and quality of life. To begin with, it is essential to say that the monitored countries do not have the same currency. For this reason, for the sake of comparability, the following tables are given in percentages, allowing easier comparison between the two countries [19]. From Table 1, we see that the level of net monetary incomes, expenditures and savings in terms of the difference between earnings and expenditure (in % of income) is increasing in both countries, creating favorable conditions for increasing the share of productive components in household consumption. It is also clear from the table that households are not only earning income but also spending. The positive thing is that it grows more slowly. In view of the absolute height of the monitored quantities, the best position of the households of SZČO and the households of employees. In the worst economic situation are the households of others, and especially in Slovakia (eg. unemployed) [20].
Table 1. Overview of Percentage Changes in Monthly Net Cash Income, Expenses, and Savings in Czech and Slovak Households from the view of Household Preference
2010 2012 2015 2016
SR ČR SR ČR SR ČR SR ČR
Households of employees
Change in income 2.0% 2.5% 19.6% 5.0% 4.3% 5.5% Change in expenses 3.2% 1.3% 11.5% 1.9% 0.8% 0.4% Income savings 12.0% 14.2% 11.0% 15.2% 17.0% 17.8% 19.8% 21.8% Households of
self-employed persons
Change in income 0.8% 7.7% 16.3% -0.7% 4.0% -0.3% Change in expenses 1.6% 7.5% 18.4% -6.7% 0.8% 0.3% Income savings 14.4% 3.9% 13.7% 4.1% 12.1% 9.9% 14.8% 9.4%
Households of retirees
Change in income 8.9% 7.9% -3.8% 3.7% 2.8% 0.2% Change in expenses 5.5% 4.9% -7.2% 2.2% 0.9% 0.3% Income savings 12.0% 3.5% 14.7% 6.2% 17.7% 7.4% 19.3% 7.3%
Households of others
Change in income 3.4% 5.6% -21.7% -1.1% 5.0% 0.0% Change in expenses 2.8% 3.4% -15.4% -0.5% 2.4% 0.0% Income savings 6.2% 4.1% 6.7% 6.1% -0.7% 5.5% 1.8% 5.5% Source: Author.
In Table 2, we can see that in Slovakia, households with two or more children have a smaller and even negative income-saving ratio, which speaks about their worse economic situation than in the Czech Republic with similarly structured households, although in 2017 there are noticeable tendencies for improvement. We also see clearly that incomes in the Czech Republic are growing more slowly than in Slovakia. [20] However, here we are going to think about the causes of income growth. According to the OECD, in 2015 we
[image:7.482.65.419.393.581.2]were among the most working-class countries in terms of hours worked. Slovakia was in eighth place with the number of hours worked with 1906 per year, and the Czech Republic was in 11th place with the number 1867. When we count this data into the working time fund of that year, we deduct the average number of holiday days we find that the average Slovak worked approximately daily an hour more and an average Czech for a quarter hour more. Currently, the situation is different, both countries have gone down in the rankings and tend to work less. From the point of view of psychological factors, this is warranted, as there is a high demand for workers on the market, employment is on the increase, and it would grow if the labor force were not available on the market, and there was no need for extreme effort or performance. At present, Slovakia moved to the 20th place with 1740 hours. The Czech Republic is higher, on the 17th of July with the number of 1770 hours. We have paused for one important reason and it is that if households work on average more, have less time to develop productive components of consumption, and therefore have less time for education, culture, relaxation. During this period of time, if they would like to change their spending on productive aspects of consumption, they would probably have to spend less time at work, which would be a loss of income for the first time (provided they are paid or otherwise rewarded for overtime) . This view is supported in part by Poštová Banka's analysis of 2014, when it examined the proportion of employees working at night, evening, Saturday and Sunday. At the top of the list were Slovaks, 16% of them working at night, 25.2% in the evening, 24.4% on Saturday and 19.2% on Sunday. In the Czech Republic, 4.4% of the population work in the night, 9.1% in the evening, 18.2% on Saturdays, and 12.2% on Sunday [21]. This fact affects not only the level of income through mandatory surcharges but also the level of quality of life in households which, in the case of time-consuming for the common time, does not, in effect, detract from the limitation of the application of the aforementioned costs.
Table 2. Overview of Percentage Changes in Monthly Net Cash Income, Expenses, and Savings in Czech and Slovak Households in terms of Number of Dependent Children in the Household
2010 2012 2015 2016
SR CR SR CR SR CR SR CR
Households without children
Change in income 7.4% 5.2% 14.0% 2.9% 3.8% 1.5% Change in expenses 6.0% 2.6% 6.9% 1.3% 0.9% 1.0% Income savings 14.5% 11.3% 15.6% 13.5% 20.9% 14.8% 23.1% 15.2%
Households with 1 child
Change in income 2.8% 0.4% 13.6% 6.3% 4.6% 3.8% Change in expenses 5.6% -0.7% 2.9% 2.3% 0.8% 1.0% Income savings 11.0% 12.2% 8.6% 13.2% 17.2% 16.4% 20.2% 18.7% Households
with 2 children
Change in income 1.0% 6.4% 14.4% 1.9% 4.0% 3.9% Change in expenses 0.9% 3.3% 12.7% -2.2% 0.7% 1.0% Income savings 9.0% 6.5% 9.1% 9.1% 10.4% 12.7% 13.3% 15.2% Households
with 3 + Children
Change in income 11.0% 3.2% 2.1% -5.8% 4.4% 0.5% Change in expenses 10.0% 29.1% 18.8% -23.1% 2.4% 1.0% Income savings 6.9% 16.2% 7.8% -4.8% -7.3% 14.3% -5.3% 13.9% Source: Author.
monitored in the context of prevention. The sphere of leisure time is understood as the cut of the day when one devotes to himself, according to his own discretion, to the choice and possibilities of activities that contribute to his relaxation. This means that the individual spheres, both in the context of the sphere of work and the cross-sectional expenditure, are both conditional and limited. The expenditure structure is a leisure time sphere consisting of spending on recreation, culture, education, hotels, cafes and restaurants. It is largely made up of productive aspects of household consumption and is therefore key to us. The last sphere is the sphere of one-off expenditure, which includes activities and activities that go hand in hand with other spheres of life, such as transport, communications, various modernization services [12].
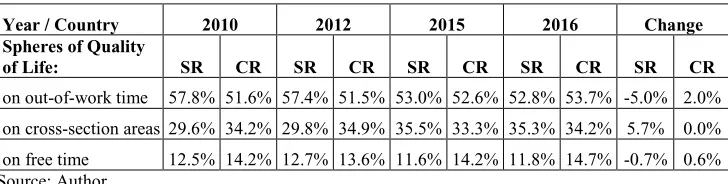
[image:8.482.59.423.339.431.2]In Table 3 we see the development of spheres of quality of life. It is obvious that in Slovakia, by 2016, the quality of life has increased compared to 2010, for example by the fact that the non-work sphere spending has decreased by 5%, however, the leisure expenses also by 0.7%, indicating that the households besides improvement of their situation from the point of view of investing in their education, relaxation in the form of recreation or expansion of horizons thanks to culture, have lost their time and means in the direction of cross-section areas, which grew by 5.7%. A different situation is occuring in the Czech Republic, where households spent 2% more on the non-work sphere, but the leisure expenses could increase by 0.6% and thus have a 3% lead in 2016. This expenditure in the long run creates favorable conditions for the growth not only of their quality of life but also of prosperity [20].
Table 3. Overview of spheres of quality of life and comparison of achieved levels in both countries
Year / Country 2010 2012 2015 2016 Change
Spheres of Quality
of Life: SR CR SR CR SR CR SR CR SR CR
on out-of-work time 57.8% 51.6% 57.4% 51.5% 53.0% 52.6% 52.8% 53.7% -5.0% 2.0% on cross-section areas 29.6% 34.2% 29.8% 34.9% 35.5% 33.3% 35.3% 34.2% 5.7% 0.0% on free time 12.5% 14.2% 12.7% 13.6% 11.6% 14.2% 11.8% 14.7% -0.7% 0.6% Source: Author.
3.2 Education expenses
The analysis of the educational structure of the population in relation to the income level revealed that the amount of income is determined by the degree of education, up to a few exceptions [22]. Education is therefore something essential for development and success in the knowledge society and every economy. It represents a kind of investment for every individual that can gradually increase not only income, but also the knowledge to make use of at home, in leisure time, whether to solve problems and to better decide or repeat mistakes. For example, by recognizing the role of habit, emotion, or risk attitude in our article, knowing that, if one wants to achieve a goal, he must create positive repetitive habits in terms of the continuous fulfillment of the chosen goal or by monitoring economic reports and the economic and political situation to minimize the risks associated with bad decisions, and also to not make decisions in an emotional distress or in anger. All this is related to education and making decisions in the direction of specific individuals.
monitored in the context of prevention. The sphere of leisure time is understood as the cut of the day when one devotes to himself, according to his own discretion, to the choice and possibilities of activities that contribute to his relaxation. This means that the individual spheres, both in the context of the sphere of work and the cross-sectional expenditure, are both conditional and limited. The expenditure structure is a leisure time sphere consisting of spending on recreation, culture, education, hotels, cafes and restaurants. It is largely made up of productive aspects of household consumption and is therefore key to us. The last sphere is the sphere of one-off expenditure, which includes activities and activities that go hand in hand with other spheres of life, such as transport, communications, various modernization services [12].
In Table 3 we see the development of spheres of quality of life. It is obvious that in Slovakia, by 2016, the quality of life has increased compared to 2010, for example by the fact that the non-work sphere spending has decreased by 5%, however, the leisure expenses also by 0.7%, indicating that the households besides improvement of their situation from the point of view of investing in their education, relaxation in the form of recreation or expansion of horizons thanks to culture, have lost their time and means in the direction of cross-section areas, which grew by 5.7%. A different situation is occuring in the Czech Republic, where households spent 2% more on the non-work sphere, but the leisure expenses could increase by 0.6% and thus have a 3% lead in 2016. This expenditure in the long run creates favorable conditions for the growth not only of their quality of life but also of prosperity [20].
Table 3. Overview of spheres of quality of life and comparison of achieved levels in both countries
Year / Country 2010 2012 2015 2016 Change
Spheres of Quality
of Life: SR CR SR CR SR CR SR CR SR CR
on out-of-work time 57.8% 51.6% 57.4% 51.5% 53.0% 52.6% 52.8% 53.7% -5.0% 2.0% on cross-section areas 29.6% 34.2% 29.8% 34.9% 35.5% 33.3% 35.3% 34.2% 5.7% 0.0% on free time 12.5% 14.2% 12.7% 13.6% 11.6% 14.2% 11.8% 14.7% -0.7% 0.6% Source: Author.
3.2 Education expenses
The analysis of the educational structure of the population in relation to the income level revealed that the amount of income is determined by the degree of education, up to a few exceptions [22]. Education is therefore something essential for development and success in the knowledge society and every economy. It represents a kind of investment for every individual that can gradually increase not only income, but also the knowledge to make use of at home, in leisure time, whether to solve problems and to better decide or repeat mistakes. For example, by recognizing the role of habit, emotion, or risk attitude in our article, knowing that, if one wants to achieve a goal, he must create positive repetitive habits in terms of the continuous fulfillment of the chosen goal or by monitoring economic reports and the economic and political situation to minimize the risks associated with bad decisions, and also to not make decisions in an emotional distress or in anger. All this is related to education and making decisions in the direction of specific individuals.
Table 4 below shows the level of spending on education for individual types of Slovak and Czech households monitored according to the preference of the household. On average, they are around 0.3-0.6% of the total net cash expenditure of households, which is very low, although compared to 2010 in Slovakia, with the exception of the households of
[image:9.482.63.418.188.298.2]pensioners where their share has not changed. Regarding the expenditures on education, the households of self-employed persons stand out the most. The cause of ow spending on education may be busyness from the point of view of work responsibilities that go beyond normal working hours, it may also be insufficient motivation for self-improvenet, other spending priorities (eg, significant increase in spending on long-term consumption goods, other services) or the still existing misconception that one is able to finish one school and no further training is needed.
Table 4. Net cash expenditure for education by household preference (% of total net cash expenditure)
Year/Country 2010 2012 2015 2016 2017 Change
Type of monitored household SR CR SR CR SR CR SR CR SR SR CR
Households of employees 0.4 0.7 0.5 0.7 0.8 0.6 0.8 0.7 0.8 0.4 0.0 Households of self-employed
persons 0.6 0.8 0.6 0.7 1.1 0.7 1.1 0.7 1.1 0.5 -0.1 Households of retirees 0.1 0.0 0.0 0.2 0.1 0.1 0.1 0.0 0.1 0.0 0.0 Households of others 0.2 0.5 0.2 0.3 0.4 0.6 0.4 0.6 0.4 0.2 0.1
Average value 0.3 0.5 0.3 0.5 0.6 0.5 0.6 0.5 0.6 0.3 0.0
Source: Author.
[image:9.482.66.406.408.515.2]Table 5 focuses on the share of spending on education and its change in terms of the number of children in households. It is obvious that the number of children is increasing education expenditure, which is related to the education of individual children in families, not with the continuous education of parents, which we consider equally necessary. In the Czech Republic, these expenses in families with two or more children are growing faster, probably also due to their overall better economic situation (see Table 1-2).
Table 5. Net cash expenditure for education by number of children (% of total)
Year/Country 2010 2012 2015 2016 2017 Change
Type of monitored household SR CR SR CR SR CR SR CR SR SR CR
Households without children 0.1 0.3 0.1 0.2 0.3 0.2 0.3 0.1 0.3 0.3 0.1 Households with 1 child 0.5 0.7 0.6 0.9 1.1 0.7 1.1 0.8 1.1 1.1 0.8 Households with 2 children 0.7 1.1 0.7 1.0 1.0 1.1 1.0 1.1 1.0 1.0 1.1 Households with 3 + Children 0.6 1.3 0.9 1.0 1.4 1.8 1.5 1.7 1.5 1.5 1.7
Average value 0.5 0.9 0.6 0.8 1.0 0.9 1.0 0.9 1.0 1.0 0.9
Source: Author.
3.3 Healthcare expenses
Czech Republic have a leading position within the OECD countries. Why is this? Why does the spending of households of retirees or other households grow steadily? Is it caused by psychological or real causes in terms of growing morbidity and health problems?
Table 6. Overview of net cash expenditure on health by household preference (% of total)
Year/Country 2010 2012 2015 2016 2017 Change
Type of monitored household SR CR SR CR SR CR SR CR SR SR CR
Households of employees 2.5 1.9 2.6 2.0 2.4 2.0 2.5 2.1 2.5 0.0 0.2 Households of self-employed
persons 2.2 1.9 2.2 2.0 2.2 2.0 2.2 2.1 2.3 0.1 0.2 Households of retirees 5.1 4.1 5.3 4.3 5.0 3.7 5.1 3.4 5.3 0.2 -0.8 Households of others 3.2 3.1 2.9 2.0 3.7 1.8 3.8 1.8 4.0 0.8 -1.3
Average value 3.3 2.8 3.3 2.6 3.3 2.4 3.4 2.3 3.5 0.3 -0.4
Source: Author.
The following Table 7 again shows the clear difference between households in the Czech Republic and Slovakia. From the point of view of tendencies, it speaks about the decrease in expenditures in Slovakia and in the Czech Republic and about their stagnation. At the same time, we can see a roughly half per cent permanent difference between the monitored countries. What causes it? For net healthcare expenditure, for example, we found that in the Czech Republic, spending on healthcare and pharmaceutical products and therapeutic devices account to around 71% of total health expenditure. Slovakia is up to 81% on average over the same period. What is the cause of their purchases? Is it marketing or an attempt to treat oneself with mistrust in public healthcare?
Table 7. Overview of Net Cash Expenditure for Healthcare by Number of Children (% of total)
Year/Country 2010 2012 2015 2016 2017 Change
Type of monitored household SR CR SR CR SR CR SR CR SR SR ČR
Households without children 3.9 3.0 3.8 3.1 3.5 2.8 3.5 2.7 3.6 -0.3 -0.3 Households with 1 child 2.4 1.9 2.6 1.9 2.4 1.9 2.4 2.3 2.5 0.1 0.4 Households with 2 children 2.4 1.7 2.5 1.8 2.2 1.8 2.2 1.8 2.2 -0.2 0.1 Households with 3 + Children 2.2 2.1 2.4 1.3 2.2 2.0 2.3 1.8 2.4 0.2 -0.3
Average value 2.7 2.2 2.8 2.0 2.6 2.1 2.6 2.1 2.7 -0.1 0.0
Source: Author.
3.4 Recreation and culture expenditure
[image:10.482.62.420.385.491.2]Czech Republic have a leading position within the OECD countries. Why is this? Why does the spending of households of retirees or other households grow steadily? Is it caused by psychological or real causes in terms of growing morbidity and health problems?
Table 6. Overview of net cash expenditure on health by household preference (% of total)
Year/Country 2010 2012 2015 2016 2017 Change
Type of monitored household SR CR SR CR SR CR SR CR SR SR CR
Households of employees 2.5 1.9 2.6 2.0 2.4 2.0 2.5 2.1 2.5 0.0 0.2 Households of self-employed
persons 2.2 1.9 2.2 2.0 2.2 2.0 2.2 2.1 2.3 0.1 0.2 Households of retirees 5.1 4.1 5.3 4.3 5.0 3.7 5.1 3.4 5.3 0.2 -0.8 Households of others 3.2 3.1 2.9 2.0 3.7 1.8 3.8 1.8 4.0 0.8 -1.3
Average value 3.3 2.8 3.3 2.6 3.3 2.4 3.4 2.3 3.5 0.3 -0.4
Source: Author.
The following Table 7 again shows the clear difference between households in the Czech Republic and Slovakia. From the point of view of tendencies, it speaks about the decrease in expenditures in Slovakia and in the Czech Republic and about their stagnation. At the same time, we can see a roughly half per cent permanent difference between the monitored countries. What causes it? For net healthcare expenditure, for example, we found that in the Czech Republic, spending on healthcare and pharmaceutical products and therapeutic devices account to around 71% of total health expenditure. Slovakia is up to 81% on average over the same period. What is the cause of their purchases? Is it marketing or an attempt to treat oneself with mistrust in public healthcare?
Table 7. Overview of Net Cash Expenditure for Healthcare by Number of Children (% of total)
Year/Country 2010 2012 2015 2016 2017 Change
Type of monitored household SR CR SR CR SR CR SR CR SR SR ČR
Households without children 3.9 3.0 3.8 3.1 3.5 2.8 3.5 2.7 3.6 -0.3 -0.3 Households with 1 child 2.4 1.9 2.6 1.9 2.4 1.9 2.4 2.3 2.5 0.1 0.4 Households with 2 children 2.4 1.7 2.5 1.8 2.2 1.8 2.2 1.8 2.2 -0.2 0.1 Households with 3 + Children 2.2 2.1 2.4 1.3 2.2 2.0 2.3 1.8 2.4 0.2 -0.3
Average value 2.7 2.2 2.8 2.0 2.6 2.1 2.6 2.1 2.7 -0.1 0.0
Source: Author.
3.4 Recreation and culture expenditure
[image:11.482.68.412.108.225.2]Expenditure on recreation and culture is closely related to the time spent on individual spheres of quality of life. They cross each other. If a person spends more time in the workplace, and in the sphere of one-off or out-of-work expenses, the sphere of leisure time, in which these expenses in particular fall, is reduced. Here, the notion of motivation becomes the foremost, as the individual's attitude towards spheres is directly dependent on it. As we know, motivation expresses the process, while the motif expresses a hypothetical disposition to this process (for example, the need to relax, to enjoy a cultural experience or other similar primary or secondary motives) should focus on the motives and the process separately and answer the question why is there a difference between Czech and Slovak households in this spending group and which forces households to reduce or lower their share of expenditures (see Table 8-9).
Table 8. Overview of net cash expenditure on recreation and culture by household preference (% of total expenditure)
Year/Country 2010 2012 2015 2016 2017 Change
Type of monitored
household SR CR SR CR SR CR SR CR SR SR CR
Households of employees 8.1 9.1 7.0 8.5 6.4 8.7 6.4 9.2 6.3 -1.8 0.1 Households of
self-employed persons 7.4 9.9 8.2 9.2 6.9 9.3 6.9 9.3 6.8 -0.6 -0.6 Households of retirees 5.6 8.6 6.2 7.5 5.0 7.7 5.1 7.8 5.0 -0.6 -0.8 Households of others 5.0 7.4 5.7 6.6 3.5 6.5 3.5 6.5 3.6 -1.4 -0.9
Average value 6.5 8.7 6.8 7.9 5.5 8.1 5.5 8.2 5.4 -1.1 -0.6
[image:11.482.65.416.266.373.2]Source: Author.
Table 9. Overview of net cash expenditure on recreation and culture by number of children (%)
Year/Country 2010 2012 2015 2016 2017 Change
Type of monitored
household SR CR SR CR SR CR SR CR SR SR CR
Households without children 6.4 8.6 6.4 8.2 6.2 8.1 6.2 8.0 6.2 -0.2 -0.6 Households with 1 child 7.6 9.2 6.9 8.5 6.1 8.7 6.2 9.3 6.1 -1.5 0.1 Households with 2 children 8.7 9.7 7.4 8.9 6.4 9.3 6.5 9.7 6.4 -2.3 0.0 Households with 3 + Children 6.1 12.0 8.2 8.1 5.2 9.4 5.3 9.7 5.3 -0.8 -2.2
Average value 7.2 9.8 7.2 8.4 6.0 8.9 6.1 9.2 6.0 -1.2 -0.7
Source: Author.
4 Conclusion
At the moment, the probability of another recession is often mentioned, and from the point of view of household psychology it may be a kind of self-fulfilling prophecy, the more people start to expect it, the sooner it comes, and at least even by starting home in such an atmosphere to save more economically, slows down and reduces spending on key productive components of household consumption. Nowadays, although the willingness to shop is growing, it is already a paradoxical situation. This is the case if interest rates are lower than consumer inflation, which means that banks actually pay mortgage borrowers real interest for taking their debt, which leads to misleading household decisions and excessive debt, which is considered to be very the current problem affecting consumer decision-making [23-26].
the contribution that Czech and Slovak households apply a different approach to expenditures on productive components of consumption and thus they get a different trend of development and point to different household conditions. This is mainly the trend of household expenditure growth, which is generally faster in Slovakia than in the Czech Republic, which is also confirmed by their increasing indebtedness. Expenditure on productive components of consumption points to the existing differences between countries and their households and the different trends in their development as a result of several factors discussed in the article. These, in the long run, create qualitative differences.
With regard to the evolving Behavioral Economics and in connection with the issues examined, we conclude that it would be beneficial to include psychological factors and decision-making motives in Family Accounts Statistics, which would allow for a more thorough overall analysis, a better understanding of the behavior of households in current conditions and last but not least advocate a better prognosis of household consumption as one of the key factors of GDP.
5 Recommendations and Suggestions
The conclusions of the paper point out that household decision-making is largely influenced by the economic situation of households but also by other factors such as lack of time to implement them or the fact that at present the probability of another recession that would reduce spending on key components of household consumption and has slowed down their implementation in the coming years. Another very important fact is that Europe is at the start of the new industrial revolution. This is considered to be the fourth jump forward of that kind, which has therefore been given the label "Industry 4.0." The basis of this term is mainly the change in so-called socio-economic behavior of people and human society as such, which also directly affects households through different channels of influence as it is a matter of change. There are a number of areas ranging from industry, technical standardization, security, education, legal framework, science and research to the labor market and the social system. These channels in the context of households create not only an environment full of risks but also opportunities to handle these challenges. For positive incentives, the possibilities of development from the point of view of the individual and the household can be considered as productive components of consumption, which create space to adapt to incoming changes.
However, in terms of economic policy recommendations in both countries and individuals, greater emphasis should be put on better awareness of these changes, as well as the qualitative side of the manufactured and purchased consumer basket components, and taking into account the long-term horizon when deciding on upcoming changes and in doing so, to implement the applied economic policy. It is also necessary to focus on consumption research in terms of monitoring and explaining the implications of emerging changes, together with targeted and meaningful redirection of money to more perspective spheres enhancing the quality of life of households. Very interesting and often inflexible is the term "libertarian paternalism‡” which can be used not only in the sense of better information, but also in the sense of targeted measures by governments in order to guide people's decision in a desirable direction, without limiting them in any way [27-29 ]. From our point of view, it could be a reform of education that would include content with the appropriate importance and depth of subjects aimed at increased awareness of health and healthy lifestyles, financial literacy or targeted support of critical and logical thinking and
‡ We perceive the concept as trying to help people achieve their own goals, in other words, it is a sort
of "poke" towards better decisions with regard to the situation we are in.
psychology of decision-making in the long term to improve decision-making in a number of problematic areas (health, education, consumption, marketing, etc.).
References
1. R. Valenčík, Ekonomie - Jak ji chápat a k cemu je? (Doplnující text ke studiu mikroekonomie na magisterském stupni). Marathon, (53), (2004)
2. D. Rozborilová, Teórie spotreby, úspor, investícií vládnych výdavkov 8. Lura Edition, (2005)
3. M. Friedman, Theory of the Consumption Function. Princeton University Press, (1957) 4. G. S. Becker, Teorie preferencií. Liberální institut, (1997)
5. D. Ariely, Jak drahá je intuice. Práh, (2011)
6. E. Andrade, D. Ariely, The Enduring Impact of Transient Emotions on Decision Making. Organizational Behavior and Human Decision Processes, 109(1), 1-8, (2009) 7. P. Singer, Famina, Affluence, and Morality. Philosophy and Public Affairs, 1(1),
229-243, (1972)
8. D. Small, G. Loewenstein, The Devil You Know: The Effects of Identifiability on Punishment. Journal of Behavioral Decision Making,18(5), 311-318, (2005)
9. D. Small, G. Loewenstein, Helping a Victim or Helping the Victim: Altruism and Identifiability. Journal of Risk and Uncertainty,26(1), 5-13, (2003)
10. D. Kahneman, V jeho prednáške z udeľovania Nobelovej ceny za ekonómiu, z 8.decembra 2002, ktorej názov je „Mapy ohraničenej racionality: Pohľad na intuitívny úsudok a voľbu“, (2002)
11. D. Ariely, Jak drahé je zdarma. Práh, (2009)
12. M. Psárska, Mikroekonomické aspekty spotreby domácnotí SR v nových ekonomických podmienkach. Dissertation thesis, (2013)
13. G. S. Becker, K. M. Murphy, The Theory of Rational Addiction. Journal of Political Economy, 96(4), 675-700,(1986)
14. M. Psárska, Nerovnosti v kvalite života domácností Slovenskej republiky z hľadiska ich príjmov a jednotlivých sfér kvality života. Sociálny rozvoj a kvalita života v kontexte makroekonomickej nerovnováhy, Velký Meder, Slovakia, 571-587,(2012) 15. I. Laluha, Kvalita života a dynamika socialno-ekonomickeho pohybu. Socialna
politika, (2008)
16. M. Bunge, What is Quality of Life indicator. Social Indicators Research, 1(2), (1975) 17. S. McCall, Quality of Life Social Indicator Research, 2(2), (1975)
18. M. Psárska, Productive components of household consumption and their current development in the context of well-being / VEGA 1/0570/11. QUAERE 2012 Reviewed Proceedings of the Interdisciplinary International Scientific Conference of PhD Students, Hradec Králové, Czech Republic, 359-369, (2012)
19. Štatistická ročenka Slovenskej republiky 2016. Veda, (2017) 20. Zdroj údajov; ŠÚ SR, ČŠÚ, (2018)
22. E. Čitáryová, T. Chrenko, Analysis of the educational structure of Slovak population in terms of income levels. Medzinárodný seminár: Kvantitatívne metódy v ekonómií, Nitra, Slovakia, (2011)
23. M. Lehuta, Kedy a odkiaľ príde ďalšia kríza. TREND, Týždenník o ekonomike a podnikaní, 30-31 a 46-47, (2018)
24. A. Strachotová, Zadlženosť domácností na Slovensku. BIATEC, Odborný bankový časopis, 18, (2010)
25. P. Staněk, Globálna kríza- hrozba alebo výzva? Sprint dva,(2010)
26. P. Staněk, Cena prežitia [online], Available at: http://www.cez-okno.net/clanok/hospodarstvo/peter-stanek-cena-prezitia
27. R. H. Thaler, Neočekávané chování, Příběh behaviorální ekonomie. Argo, Dokořán, (2015)
28. A. Belayanin, Richard Thaler and behavioral economics: From the lab experiments to the practice of nudging. Nobel Memorial Prize in Economic Sciences 2017, 1, 5-25, (2018).