1-1-1992
Investigation of strength parameters in determining
total rehabilitation of the knee
Sarah Torgerson Krieger
Iowa State University
Follow this and additional works at:https://lib.dr.iastate.edu/rtd
This Thesis is brought to you for free and open access by the Iowa State University Capstones, Theses and Dissertations at Iowa State University Digital Repository. It has been accepted for inclusion in Retrospective Theses and Dissertations by an authorized administrator of Iowa State University Digital Repository. For more information, please contactdigirep@iastate.edu.
Recommended Citation
Krieger, Sarah Torgerson, "Investigation of strength parameters in determining total rehabilitation of the knee" (1992).Retrospective Theses and Dissertations. 18193.
p5Lf
;99.:
ke?3
e. 3
Investigation of strength parameters
in determining total rehabilitation of the knee
by
Sarah Torgerson Krieger
A Thesis Submitted to the
Graduate Faculty in Partial Fulfillment of the
Requirements for the Degree of
MASTER OF SCIENCE
Interdepartmental Program: Biomedical Engineering
Signatures have been redacted for privacy
Iowa State University Ames, Iowa
Page
INTRODUcrION
1
LITERATURE REVIEW
3
Isokinetic Dynamometer
3
Isok.inetic Exercise
5
Anatomy of the Knee
6
Anterior Cruciate Ligament Injury
9
Rehabilitation After Surgery 11
Electromyographic Studies
16
Summary
18
METI-IODOLOGY
20
Subjects
20
Equipment
20
Protocol
21
Data Acquisition and analysis
21
RESULTS
23
DISCUSSION
37
Conclusions
39
REFERENCES
41
APPENDIX A
45
APPENDIXB
50
INTRODUCTION
The knee is the most frequently injured joint in many sports, and knee injuries are the leading cause of long-term disability from athletics (Zarins and Adams, 1988). In sports where cutting and twisting movements are common, such as skiing or wrestling, anterior cruciate ligament damage occurrence is frequent.
After an injury, it is important to allow enough time for healing and
restrengthening of the knee. For the athletic trainer or physical therapist, it is hard to determine when the patient is fully recovered or where the patient is in the rehabilitation process without being subjective in some way. One way of
determining when a patient is recovered is through a functional activity test (Seto et al., 1988). The functional activity test is completed by the patient and is an
assessment of normal, everyday activities and how the knee is affected by
movements such as walking, stairclimbing, and squatting. The test also asks about the frequency of instability, pain and swelling. Another method often used by the athletic trainer or physical therapist to decide if the knee is totally rehabilitated is through strength testing of the quadriceps femoris and hamstrings muscles. When different strength goals are attained, such as a certain hamstrings/ quadriceps (HQ) ratio or a specific percentage of the noninjured leg's muscles, the athletic trainer or physical therapist discharges the patient to return to full activity (Kannus, 1988). But, hamstrings and quadriceps strength does not assure normal ligament strength and healing. Both of these methods are subjective in nature.
Back~ound
LITERATURE REVIEW Isokinetic Dynamometer
The isokinetic dynamometer controls the speed of movement over a range of movement. Cabri (1991) indicated that the device enables the control of angular velocity with a resistive force throughout the full range of joint motion. The advantage of the dynamometer is that it can measure maximal voluntary moments applied to a lever arm at relatively constant angular joint velocities because the resistance supplied by the device matches the subjects immediate and specific muscular capacity.
The Cybex II (Lumex Corporation) is probably the most popular isokinetic dynamometer, although many others exist. It is an electrically driven device in which the control mechanism is activated only when the preset velocity is attained by the moving limb. Any increases in the moments generated by the user are then resisted by an equal-magnitude resistive force by the control mechanism of the device. With the Cybex II, concentric exercises can be performed at the preset velocities, where the muscle shortens its length during contraction (Cabri, 1991).
System reliability
lever arm. A correlation of 0.946 was found between the mechanical computation and measured value of work performed through a 180 degree arc of motion at 24 deg/ sec. The study also revealed a correlation coefficient of 0.999 between the set speed and the obtained speed. In 1978, Johns and Siegal determined reliability coefficients ranging from r
=
0.93 to r=
0.99 for knee flex.ion-extension exercises. From the literature, it is apparent that the validity and reliability of the isokinetic devices is excellent (Vint, 1991).Stabilization
Stabilization is an important factor influencing the amount of muscular force generated during testing. Smidt and Rogers (1982) stated that stabilization is
(using only the thigh strap) for concentric and eccentric contractions of the quadriceps femoris muscles at all velocities used. From these studies, it can be concluded that it is important to describe the stabilization procedure used in research.
Isokinetic Exercise
Back~ound
The origin of the isokinetic principle has been attributed to Perrine, who devised the isokinetic dynamometer in 1965. Isokinetic exercise can be defined as a method that relies on the use of a machine to control the speed of movement over a range of movement (Cabri, 1991). Isokinetic exercises involve limiting the rate at which a body segment can be moved. This approach can be used to develop strength at different rates of joint motion (Zarins and Adams, 1988). According to Sherman et al. (1982), force generated at various isokinetic contractile velocities follows the classic force-velocity curve. As the velocity of the contraction increases, the tension that can be developed by the contracting muscle decreases.
lsokinetic vs. isotonic exercise
In isokinetic exercise, resistance varies, accommodating to the force-producing capacity of the muscle group. In contrast, in isotonic exercise, the imposed
Effectiveness of isokinetic exercise
The effectiveness of isokinetic exercise is based on several physiologic factors, as noted by Timm (1988). Isokinetic activity enhances performance ability by
optimizing neuromuscular responses to exercise through the decrease of alpha motomeuron inhibition, the promotion of motor unit contraction synchrony, the facilitation of maximal muscle contraction at each point in an available joint range of motion, the increase in muscle fiber and motor unit recruitment, the increase in speed of actin myosin crossbridge formation, and the stimulation of both slow twitch and fast twitch muscle fiber types as related to the principles of accommodating resistance across a variable spectrum of fixed exercise velocities. Muscles worked isokinetically also retain optimal function once training has ceased. Isokinetic activity involves both the aerobic and anaerobic energy systems, whereas other exercise systems use only one (Timm, 1988).
Anatomy of the Knee Anatomical considerations
The knee joint is the largest and most complex joint in the body. It is typically classified as a diarthrodial hinge joint but has slight pivotal as well as gliding movement. Motion of the knee joint is dominated by flexion and extension, but some movement may also occur in the frontal or transverse planes. Three
articulations compose the knee joint: two tibiofemoral joints and the patellofemoral joint. The knee joint is stabilized by a intricate pattern of tendons and ligaments. The major ligaments include the patellar ligament, the oblique popliteal, arcuate popliteal, medial and lateral collateral, and anterior and posterior cruciate
each other in a sagittal plane and provide stability in the sagittal and coronal planes. Sliding of the tibia with respect to the femur becomes evident if either of the
cruciates should be severely strained or ruptured, a condition referred to as the drawer sign. The anterior drawer sign is tibial displacement beneath the femur in an anterior direction and reflects the integrity of the anterior cruciate (Rasch, 1989).
Joint movements
Motion of the knee joint is dominated by flexion and extension in the sagital plane. The range of motion from full extension (0 deg.) to full flexion is
approximately 140 degrees. Motion of the knee in the transverse plane usually accompanies flexion and extension and is referred to as internal and external tibial rotation. Movement in the transverse plane is a function of knee position in the sagittal plane. No rotation of the knee is allowed when the knee is in full extension. However, when the knee is flexed to 90 degrees, up to 45 degrees of external
rotation and 30 degrees of internal rotation are possible (Rasch, 1989).
Anterior cruciate li2ament
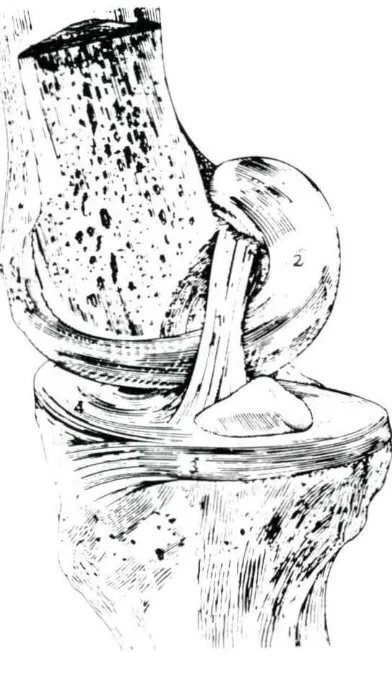
The anterior cruciate ligament (ACL) is one of the major stabilizers of knee motion (Hollis et al., 1991). The anterior cruciate ligament arises from the anterior part of the intercondylar area of the tibia and is directed backward to the medial surface of the lateral femoral condyle. Its main functions are to prevent anterior movement of the tibia on the femur, to check external rotation of the tibia in
flexion, and to a lesser extent to check extension and hyperextension of the knee. It also aids in control of normal rolling and gliding of the knee (Draper, 1990).
.,
\'
[image:11.577.305.501.173.514.2]I '
\L, ....
Figure 1.
The anterior cruciate ligament during flexion-medial view (Rasch, 1989)
Figure 2.
Anterior Cruciate Ligament Injury Causes of injury
According to Zarins and Adams (1988), an isolated tear of the anterior cruciate ligament (ACL) without disruption of other major ligaments is recognized as one of the most common knee injuries in sports. ACL damage can occur during either contact or noncontact situations. Several mechanisms, such as hyperextension and anteroposterior displacement, occur and damage the ACL. Often the injury results from a cutting o r twisting maneuver during weightbearing. Valgus forces and deceleration can also cause ACL injuries (Draper, 1990). The anterior cruciate ligament is commonly torn in a noncontact deceleration situation that produces a valgus twisting injury (Zarins and Adams, 1988). This usually occurs when the athlete lands on the leg and quickly pivots in the opposite direction, often hearing a pop. Severe swelling follows within two hours due to intraarticular bleeding. The anterior tibial subluxation that occurs at the time of injury also usually tears the menisci which become trapped between the femoral and tibial condyles. After the ACL is tom, it does not heal, making surgical reconstruction for young and active patients necessary to achieve knee stability (Hollis et al., 1991).
Sur!Pcal considerations
There is presently little concensus as to whether reconstructive surgery is necessary immediately following injury of the ACL. Functional responses to knee ligament injuries are highly variable. Patients with seemingly minor amounts of instability sometimes have considerable functional disability while some patients with considerable instability have few functional problems (Brand, 1986).
Sommerlath (1990) determined that partial rupture of the ACL does not interfere with long-term stability, knee function or the ability to play demanding sports. Knee function was found to be almost normal in a follow-up study of 22 patients who had sustained partial rupture of the anterior cruciate ligament between 9 and 19 years earlier. However, the study revealed a high rate of cartilage degeneration, possibly due to associated injuries. Subtle and asymptomatic arthritic changes also occurred, but few patients were forced to change their sporting activities.
including one by Funk (1983) that found only 8.5% of patients in his clinic undergoing total knee replacements had a history compatible with significant ligamentous injury. Brand (1986) suggests that patients with knee ligament injury usually develop only mild to moderate degenerative changes, and that these changes are ordinarily neither progressive or severe.
Lewis et al. (1989) indicates that there are many surgical factors that have been suggested as important variables in the success of an ACL reconstruction. It is also stated that of equal importance are the postoperative rehabilitation protocol
followed and the nature and level of patient activity. It is valid to state that, with all the variables involved, it is presently impossible to determine objectively whether surgery will positively affect the long-term stability and functional ability of the patient.
Rehabilitation After Surgery
Back~ound
Knee stability
Most people concerned with the rehabilitation of the knee agree that strength is one of the most important factors in assessing knee stability. Maxwell and Hull (1989) defined knee strength as the amount of load the knee can withstand before damage (grade I, II, or III injury) is incurred by any of its ligaments. They go on to state that knee strength changes depend on three main factors: the level of axial forces (weightbearing), the degree of muscle activity, and the flexion angles of the hip and knee. However, Seto et al. (1988) comments that the ability of a muscle to prevent instability is determined by more than its force-producing capacity. Other factors that may affect the joint stabilizing ability of the muscles may include the speed in which the muscle responds to an destabilizing force, the influence of muscle length to the tension generated, and the muscle's ability to resist fatigue. A study by Murray et al. (1984) raised the question whether some patients with ACL injury can eliminate strength deficits, regardless of the rehabilitation program. They concluded that, at best, some patients may only partially rehabilitate their unstable knees. Noyes et al. (1974) demonstrated that ligaments become weaker with disuse, and stronger with reconditioning.
Many studies have advocated strengthening the large muscles of the quadriceps femoris and the hamstring group, showing benefits in knee stability. Which muscle to concentrate on strengthening is disputed by some researchers. Kannus (1988) reported that atrophy of muscle tissue is greater in the quadriceps femoris muscle than in the hamstring muscles after knee ligament injuries, according to
(1988) added that postsurgical evaluations of the quadriceps have shown that increased strength in the surgically treated knee is positively associated with improved functional return. Solomonow et al. (1987) stated that the hamstring muscle group is a more important consideration when a patient has an ACL injury. They explain that a primary, fast-to-respond reflex arc exists from mechanoreceptors in the anterior cruciate ligament to hamstring muscle group. A secondary reflex arc exists from mechanoreceptors in the muscles or joint capsule which provides
activation of the hamstrings upon knee instability. In their studies it was shown that the hamstrings were clearly demonstrated to assume the role of joint stabilizers (via the secondary reflex) in the patient who has a deficient ACL. Kannus (1988)
studied both the quadriceps and hamstring muscle groups, looking for a difference in the HQ ratio (hamstring strength divided by quadriceps strength) of healthy leg compared with the injured leg of the subject. Since studies confirm HQ ratios are highly variable from subject to subject (31 % to 80% HQ ratios), Kannus felt a suitable HQ ratio for the injured knee may be the HQ ratio of the subject's uninvolved knee.
Time frames
As far as time frames for different stages of rehabilitation after knee ligament reconstruction are concerned, there are still some unanswered questions and differing opinions. Most physicians and physical therapists now agree that immobilization, even for a short period, causes considerable resorption and
80% of the normaJ value after five months of reconditioning. Normal ligament properties were regained only after a full year of reconditioning (Zarins and Adams, 1988). Another study by Noyes et al. (1974) found that the total rehabilitation period is about a year. They reported that ACL strength had only reached 50% of normal values after five months of healing. Cabaud et al. (1980) reported ACL strength reached only 50% or normal vaJues after eight months of heaJing. Harvey and Weiker (1989) make the point that the type of reconstruction determines the time frame for rehabilitation. They recommend the use of autogenous patellar tendon as the best approach for reconstruction. But this approach can take as long as a year to heaJ for it to be possible for an athlete to return to aggressive sports. It
was concluded by Zarins and Adams (1988) that approximately one year should be allowed for healing and rehabilitation of the tissue before the patient returns to participation in active sports. The time frame of one year seems to be generally accepted as the total rehabilitation time. But most people in the medicaJ field will agree that depending on the individuaJ, the specific injury, and the aggressiveness of the rehabilitation program, among other things, the time frame of total
rehabilitation could be shortened or prolonged.
Specific pro~ams
The time frame of total rehabilitation is variable, so specific programs were researched so determination of the progression of the patient is more objective. A five-year study by Timm (1988) of four different programs of rehabilitation
isokinetic program included attainment of a 90% or higher level of quadriceps and hamstrings performance factors of peak torque, peak torque to body weight ratio, peak torque acceleration energy, endurance ratio, average power, agonist-antagonist peak torque ratio, and agonist-antagonist work ratio in bilateral comparison to the non.injured knee across a spectrum of functional speeds; as well as the ability to perform daily and athletic activities without knee discomfort and joint instability. Sherman et al. (1982) reports that it is advisable to rehabilitate the supporting musculature surrounding a joint which has been affected by injury, surgery, or immobilization to 100% of the non-operated limb at all isokinetic training velocities. This ensures that both fiber types, fast and slow twitch, are being
recruited and trained. This approach is supported by Seto et al. (1988) whose study showed that subjects in sports which involved cutting and twisting motions were less successful in returning to their preinjury participation levels and reported more subjective complaints of pain, swelling, and/ or instability. They concluded that long-term progressive rehabilitation emphasizing increasing quadriceps and hamstring strength to approximate that of the non-operated leg may enhance successful return to functional and sports activities after ACL reconstruction.
Paulos et al. (1981) were very specific in their rehabilitation program which involved five phases after ACL repair and reconstruction. Phase one begins with a healing period and a controlled motion period, with its length depending on surgical
technique. Phase two consists of crutch-weaning and walking periods. De-emphasis of quadriceps exercises and an emphasis on the hamstring muscles to create a
coordination and endurance is a goal for phase four. When at least 75% of the strength and power of the normal leg is achieved in the injured leg, the running period begins. Phase five consists of the return to sport, gradually resuming full activity, and maintenance, which consists of triweekly strength-building sessions, brace protection during sports, and avoidance of high risk activities. This program is based on principles and guidelines and was compared to a survey of 40 knee expert's recommendations. No success rates for the program were given.
Electromyographic Studies
Back~ound
I
t I · · · · · TORQUE ·- -·-· .. 1 ••
. ~ _L_ . ; ' ' '
; _· EXTEN SION ; _ _; _ F~X~ON ~·:
L '
QUADS .
MAVA ,r 11
-.,__ v .... "\
I
'
...
,
[image:20.569.316.449.139.557.2] [image:20.569.64.281.141.563.2]l -'"\.
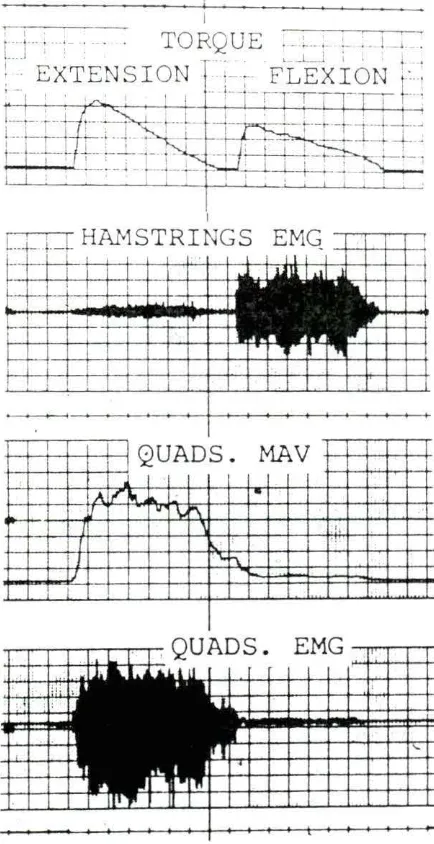
Figure 3.
Typical traces of torque, knee angle hamstring MA V and EMG, and quadriceps MA V
and EMG (Solornonow, et al. 1987)
-- HAMS. EMG L_
- L
I I '
l '
·-
II L
I
' I I
-
QUAD.
MAV-!--
,.__,.. ... ~-\
( I 1' \
I I
,..,
I I
t
I
Figure 4.
Relevant research
It is difficult to find significant changes in EMG data because of all the variables involved, including placement of electrodes, position of the subject, and differences of individual's muscle composition. Contrasting studies compared EMG data during bilateral and unilateral leg movements. Vandervoot et al. (1984) concluded that in the leg-press movement there was a significant decrease in motor unit activation of the involved muscles during bilateral (BL) maximal voluntary contraction when compared with unilateral (UL). Schantz et al. (1989) found no differences in integrated EMG activity between UL and BL leg extensions. Soderberg et al. (1987) showed that with 30 subjects, 16 with a history of knee injury or surgery, no major differences of EMG data were found when performing straight-leg-raising and quadriceps femoris muscle setting exercises. Osternig et al. (1984) found that no consistent patterns emerged that implied intermittent surges of muscular activity as the primary mechanism yielding double peaked torques that characteristically occur in isokinetic exercise.
Summary
Of the literature reviewed, different methods were used to assess the
1) To reduce the subject variables in order to examine more closely parameter relationships.
2) To include a subject who is presently involved in a rehabilitation program and compare that subject to one who has completed a rehabilitation program after having a similar surgery and to a control subject.
3) To study correlations between different parameters in order to assess their importance.
The two hypotheses of the outcome of the study were:
1) Due to the trauma of surgery and the fact that the ligament never returns to normal, there may be differences in correlations of the parameters studied when the in-rehabilitation subject and the post-rehabilitated subject are compared to the control subject.
2) Certain parameters will show high correlations within each subject and
METHODOLOGY Subjects
Three collegiate wrestlers, competing in the heavyweight division, served as subjects. They averaged 21.33
.±
1.53 years of age, 236.67.±
5.77 pounds, and 6' 2.0".±
1.0" tall. One subject had ACL reconstruction on his right leg approximately five months prior to testing and was currently in a rehabilitation program (in-rehab subject), one subject had ACL reconstruction on his right leg 3 years prior to testing (post-rehab subject), and the last subject served as a control, with no prior knee injuries or surgery (control subject). The three subjects average 7.0.±
1.0 years weightlifting experience. Informed consent was obtained and the study was approved by the Human Subjects Committee at Iowa State University (See Appendix A).Equipment
Protocol
The testing protocol was established by the physical therapist responsible for the rehabilitation of the subject who had recently undergone reconstructive surgery. After calibration of equipment, each leg was tested at 60 deg/sec for six repetitions,
120 deg/sec for six repetitions, and at 180 deg/sec for 20 seconds. The left leg was tested first at all speeds, followed by a 10 minute rest to change equipment and electrodes, then the right leg was tested. Subjects were encouraged to reach their maximal voluntary contractile effort during each exercise, and a warm-up period was given before each change in speed to familiarize the subject with the change in
resistance.
Data acquisition and analysis
For the subject in-rehab, data were collected by a Hewlett-Packard
Instrumentation Recorder (Model 3960), digitized, then analyzed using National Instruments Software on a Zenith microcomputer. The other two subjects' data were stored directly into the computer. A Grass Instrument amplification system was used for the EMG data. The EMG data were bandpass filtered using 0.3-Hertz (Hz) and 500-Hz frequency cutoffs. The sampling rate used was 1000-Hertz for both EMG and torque data.
torque from the beginning of torque; and mean frequency and root mean square, which are calculated from the EMG data from the start of EMG to peak torque.
RESULTS
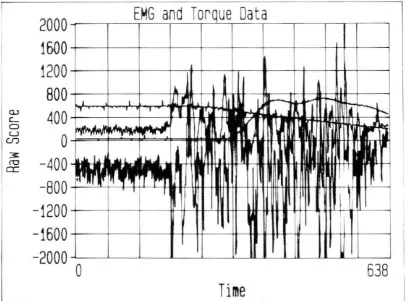
The raw data are shown in Appendix B. An example of the visual aid used during data collection is shown in Figure 5. The raw scores for data were used for most of the figures and tables. The raw score for torque can be converted into foot-pounds by multiplying by a factor of 0.22. Time to peak torque is given in
milliseconds and mean frequency is in Hertz. Because the results of the vastus lateralis were questionable in the in-rehab subject, only the vastus medialis data was analyzed in all subjects.
Within subjects
2000
EMG d T
an orque a a
D
t
1600
1200
800
a.>
400
c_ a u0
Cf) 3:-400
ro er:-800
-1200
kI I I
,,
I I-' I
--j ...
.., 1 I
'
1 I I
If'
_ .... ..I II ....
.
~ ...l
,/I
..
~
..
,,
...
..
"...
""...-·~ I~
.,
ff
f
---:l"UI'
~I
I
II
II
~
638
-1600
-2000 0
Time
[image:27.575.75.481.240.541.2].M
..,
Q,I ~
=
.,,
Q,I
s
·~....
y
= -
45.019 + 0.28175x R ~ 2=
0.945300 c::J
200
100
0 --~---.~~-.-~---.-~~..,...~--.-~---,.--~...,...~---t
400 600 800
Peak Torque 1000 1200
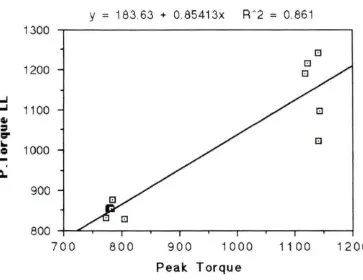
[image:28.572.109.464.180.452.2]y
=
183.63 + 0.85413x RA2=
0.861 13008
1200 8 8
..J
..J 1100 8
Gil
=
~
G
Ii..
Q 1000
...
.
a.
900
800 +---r-~-.-~~~...-~...--~r----,.---.~--.~~
700 800 900 1000 11 00 1200
[image:29.573.91.454.174.454.2]Peak Torque
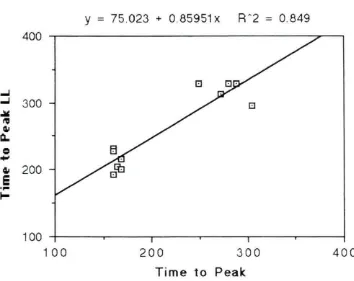
y = 75.023 + 0.85951
x
RA2 = 0.849 400-'
-' 300
.M
~ Q,I 0..
c
...
Q,I 200E
.,..
I-100
100 200 300 400
Time to Peak
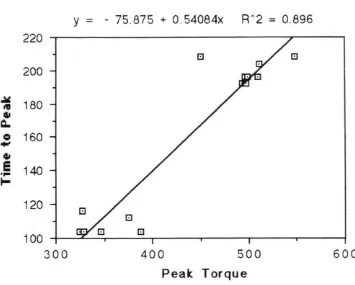
[image:30.570.98.452.169.450.2]y
= - 75.875 + 0.54084x RA2 = 0.896220
200
~ 180
"'
Q,t
Q.
c
..
160Q,t
E
140....
t-120
100
300 400 500 600
Peale Torque
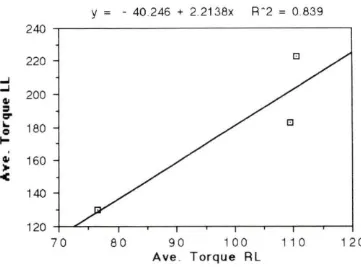
[image:31.572.99.454.169.454.2]y = - 40.246 + 2.2138x R ~ 2 = 0.839 240
220
...J ...J
200
Q,I
=
r:r
..
180c
....
I
Q,I 160
:.
<
140
120
70 80 90 100 1 1 0 120
[image:32.573.103.464.174.441.2]Ave . Torque RL
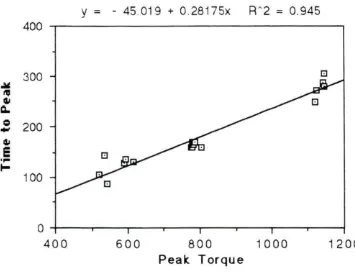
peak torque to time to peak torque. Complete results of the R"2 values obtained in the within subjects evaluation of the four variables are given in Table 1.
Table 1. R"2 value within subjects, across speed
PT vs TP PT VS RMS PT vs MF TP vs RMS TP vs MF RMS vs MF
SuQi~~t
Post-rehab .491 .131 .285 .429 .265 .301
Control .945 .599 .759 .498 .710 .481
In-rehab .896 .469 .043 .589 .146 .032
PT= Peak Torque TP= Time to Peak Torque MF= Mean Frequency of EMG RMS= Root mean square of EMG
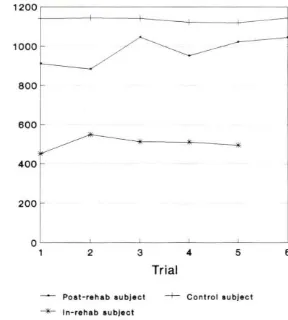
To examine the graphs and regression equations of the graphs not previously discussed, refer to Appendix C. The means and standard deviations were calculated to show how torque values changed with speed and the variations between trials. The in-rehab and control subjects had lower standard deviations than the post-rehab subject, although the control subject mean peak torque had the most significant drop between speeds. The values of mean peak torque (MPT) and standard deviation (STD DEV) for the subjects at each of the speeds is given in Table 2. Results for peak torque for the right and left legs are given in Table 3. Peak torque is the maximum torque produced in the six trials for each speed. The control
Table 2. Mean peak torque and standard deviation values for subjects
MPT STD DEV
PQst-r~hgQ :rnbi~ct
60 deg/ sec 977.03 71.09
120 deg/ sec 797.78 100.75
180 deg/ sec 737.17 49.69
CQntrQl Sybj~~t
60 deg/ sec 1135.14 11.56
120 deg/ sec 783.17 11.12
180 deg/ sec 565.24 37.28
In-r~hab Subj~~t
60 deg/ sec 502.81 35.32
120 deg/sec 497.43 1.34
180 deg/ sec 348.18 26.93
was fairly consistent between the speeds.
Between subjects
Table 3. Maximum values for peak torque in the right leg divided by peak torque in the left leg, within speeds, over six trials
peak torque right leg/ left leg ratio
PQst-r~hab S!.!bj~~t
60 deg/ sec 1047/ 1193
=
.88 120 deg/ sec 974/ 999=
.97 180 deg/ sec 810/ 851=
.95CQntrQl Subj~~t
60 deg/ sec 1144/ 1240
=
.92 120 deg/ sec 804/ 879=
.91180 deg/ sec
---In-r~hab S!.!l2i~~t
60 deg/ sec 548/ 1014
=
.54 120 deg/ sec 499/ 832=
.60 180 deg/ sec 387/ 591=
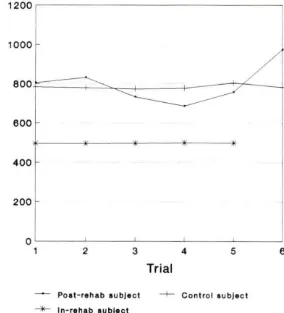
.65control subject's R"2 value was .759. In Figures 11, 12, and 13, it can be seen that no patterns exist, between or within subjects, over the trials. The post-rehab subject had the most erratic changes over the trials, with the in-rehab subject appearing to be the most consistent over the speeds. The control subject's peak torque seemed to change the most over the speeds. Table 2 demonstrates this by showing a change in mean peak torque in the control subject from 60 deg/ sec to 180 deg/ sec of 570 using raw scores. Note from Table 2 how the in-rehab subject's peak torque scores at 60 deg/ sec are even lower than the scores of the other two subjects at 180
~
=
r:::1'
"'
~
.:ii: co:
~
Q.,
1000
800
600
400
200
o L-~~__J,~~~-1..~~~-'-~~~-'-~~--'
1 2 3
Poat-rehab subject
--*-- In-rehab subject
4 5 6
Trial
[image:36.571.126.414.169.489.2]-r- Control aubject
~
=
O'
""
~
,;;/,
~
~
[image:37.571.132.416.170.483.2]c..
Figure 12.
1000
800
600
400
200
o ~~~~~~~~~~~~~~~~~~__,
1 2 3
Poat-rehab aubJect
--*- In-rehab aubJect
4 5 6
Trial
~ Control aubJect
Q,I
=
r::r
...
~
..::.:
~ Q,I
[image:38.569.127.418.163.489.2]Q.,
Figure 13.
800
600
400
200
o L-~~___.JL-~~--'-~~~--1-~~~--'-~~--'
1 2 3
Poat-rehab aubJect
--*-- In-rehab aubJect
4 5 6
Trial
-+- Control aubJect
DISCUSSION
Methods used by physical therapists and athletic trainers to assess torque data are questionable. Rothstein et al. (1987) found no documentation available that indicates the method of interpreting the torque curves of patients and then coming to a conclusion regarding the patient's pathological condition is valid as an objective measure. It is well accepted, based on studies such as Clarke and Manning (1985), that peak torque varies inversely with speed, as the present study confirms. But to what extent? Why do some subjects' torque data vary to a lesser degree than some when changing speed of movement? Studies looking at factors such as muscle fiber type, body weight, and thigh circumference have been done, but results are
conflicting (Clarkson et al., 1982). Others try to more accurately measure torque by factoring gravity in or trying to isolate muscles by maximum stabilization. The current study did neither.
It was found that the post-rehab subject had lower correlation values than the control subject, agreeing with the hypothesis stated earlier. Since the subject was participating in collegiate athletics and was having no obvious problems of pain, swelling , or instability, it is interesting that his correlation values were as low as they were. His inconsistency is evident in his high standard deviation and his low correlation values between trials. There are several reasons that could have
values were all much higher than the in-rehab subject, but they didn't drop off as much between speeds as the control subject's did. The control subject's mean peak torque was higher than the post-rehab subject's at 60 deg/sec, but at 120 deg/ sec and 180 deg/sec, the post-rehab subject had higher values. It is possible that his slow twitch/fast twitch muscle fiber composition would show a higher percentage of fast twitch fibers when compared to the control subject, which could have been demonstrated by performing muscle biopsies in the subjects.
The control subject was very consistent within speeds for every variable. His peak torque dropped during different speeds, as expected for a normal force -velocity curve. It was interesting to note his high correlation values for both mean frequency and peak torque and mean frequency and time to peak torque. It would be interesting to look at more control subjects to see if this high correlation holds true.
When studying the EMG variable correlations with the other variables in Table 1, time to peak torque and root mean square (EMG) showed the highest correlation between the subjects. It was also interesting to note that the post-rehab subject's peak torque and root mean square's correlation was low, compared to the other variables within the subject and between subjects. Another significant finding was
the correlation values of the subjects for peak torque and mean frequency (EMG). It is possible that the low value of the in-rehab subject could be related to the ongoing healing process of the knee. The post-rehab subject's correlation was higher than the in-rehab subject's, but still not as high as the control subject's value. This could agree with the hypothesis that the post-rehab subject's ligament never returned to its preinjury condition, possibly due to the trauma of surgery. This shows that by looking at only one parameter, for instance, peak torque in the injured leg compared to peak torque in the left leg, that some relevant information may be overlooked. More research is needed which provides an ongoing study of EMG data from the onset of injury until the patient is well along in recovery.
Conclusions
The most important correlations existed between peak torque and time to peak torque, time to peak torque and root mean square of the EMG data, and peak torque and mean frequency (EMG ). This agreed with the hypothesis stated earlier that peak torque would be a parameter which would highly correlate with other parameters. The ratio of right leg/ left leg peak torque also proved significant. More study needs to be performed with more subjects from each category before attempting to extract a valid equation from the data. From this research it is
peak torque, root mean square of EMG data, and mean frequency of the EMG data. It is recommended that the three different speeds should be used and that the injured subjects be tested more than once during their rehabilitation to see if
patterns in the four parameters emerge. When researching the literature, no study was found which attempted to reduce the variables of sex, body weight, specific athletic specialty, and weightlifting experience as this study has tried to accomplish. In reducing these variables, it was theorized that a more accurate picture of what the knee joint and the surrounding musculature were doing during rehabilitation could be established. By looking at four parameters in one study and using few subjects, it proved beneficial to correlate the parameters. When using a large number of subjects, some of the information is lost when compiling data into a large statistical analysis. The further studies that result from this feasibility study will prove more valuable since correlations among parameters have been established. The desired end result of this feasibility study was to have determined what
parameters are of importance in rehabilitation and to begin to form an equation to determine objectively how far along in rehabilitation a subject is after ACL
REFERENCES
Anderson, R. W., and B. A. Lipscomb. 1989. Rehabilitation after repair of the cruciate ligament. American Journal of Sports Medicine 17:154.
Arms, S. W., M. H. Pope, R. J. Johnson, R. A. Fisher, I. Arvidsson, and E. Eriksson. 1984. The biomechanics of anterior cruciate ligament rehabilitation and
reconstruction. American Journal of Sports Medicine 12:8-18.
Brand, R. A 1986. Knee ligaments: A new view. Journal of Biomechanical Engineering 108: 106-110.
Cabri, J. M. H. 1991. Isokinetic strength aspects of human joints and muscles. Critical Reviews in Biomedical Engineering 19:231-259.
Cabaud, H.E., J.A. Feagin, and W.G. Rodkey. 1980. Acute anterior cruciate
ligament injury and augmented repair. Experimental studies. America} Journal of Sports Medicine 8:395-401.
Clarke, D. H., and J. M. Manning. 1985. Properties of isokinetic fatigue at various movement speeds in adult males. Research Quarterly for Exercise and Sport 56:221-226.
Clarkson, P. M., J. Johnson, D. Dextradeur, W. Leszczynski, J. Wai, and A
Melchionda. 1982. The relationship among isokinetic endurance, initial strength level, and fiber type. Research Quarterly for Exercise and Sport 53: 15-19.
Draper, D. 0 . 1990. A comparison of stress tests used to evaluate the anterior cruciate ligament. The Physician and Sportsmedicine 18:89-96.
Engelhorn, R. 1987. Effects of skill practice on electromyographic activity patterns and frequency spectra. Human Movement Science 6:117-131.
Hanten, W. P., and C. L. Ramberg. 1988. Effect of stabilization on maximal isokinetic torque of the quadriceps femoris muscle during concentric and eccentric contractions. Physical Therapy 68:219-222.
Hatvey, J., and G.G. Weiker. 1989. Acute knee injury in wrestling. The Physician and Sportsmedicine 17:71-78.
Hart, D. L., T. J. Stobbe, and C. W. Till. 1984. Effect of trunk stabilization on quadriceps femoris muscle torque. Physical Therapy 64: 1375-1380.
Herzog, W. 1987. Considerations for predicting individual muscle forces in athletic movements. International Journal of Sport Biomechanics 3:128-141.
Hollis, J.M., S. Takai, D. J. Adams, S. Horibe, and S. L. Y. Woo. 1991. The effects of knee motion and external loading on the length of the anterior cruciate ligament: A kinematic study. Journal of Biomechanical Engineering 113: 208-214.
Johns, J., and D. Siegel. 1978. Reliability of an isokinetic movement of the knee extensors. Research Quarterly 49:88-90.
Kannus, D. 1988. Ratio of hamstring to quadriceps femoris muscles strength in the anterior cruciate ligament insufficient knee. Physical Therapy 68:961-965.
Lewis, J. L., W. D. Lew, J. A Hill, P. Hanley, K Ohland, S. Kirstukas, and R. E. Hunter. 1989. Knee joint motion and ligament forces before and after ACL reconstruction. Journal of Biomechanical Engineering 111:97-106.
Maxwell, S. M. and M. L. Hull. 1989. Measurement of strength and loading
variables on the knee during alpine skiing. Journal of Biomechanics 22:609-624.
Moffroid, M., R. Whipple, J. Hofkosh, E. Lowman, and H. Thistle. 1969. A study in
isokinetic exercise. Physical Therapy 49:735-746.
Nosse, L. J. 1982. Assessment of selected reports on the strength relationship of the knee musculature. Journal of Orthopaedic and Sports Physical Therapy 4:78-85.
Noyes, F.R., P.J. Torvik, and W.B. Hyde, et al. 1974. Biomechanics of ligament failure. An analysis of immobilization, exercise and reconditioning effects in primates. Journal of Bone Joint Surgery 56A:1406-1418.
Osternig, L. R., J. H . Hamill, D. M. Corcos, and J. Lander. 1984.
Electromyographic patterns accompanying isokinetic exercise under varying speed and sequencing conditions. American Journal of Physical Medicine 63:289-297.
Osternig, L. R. 1986. Isokinetic dynamometry: Implications for muscle testing and rehabilitation. Exercise Sports Science Review 14:45-80.
Paulos, L., F. R. Noyes, E. Grood, and D. L. Butler. 1981. Knee rehabilitation after anterior cruciate ligament reconstruction and repair. American Journal of Sports Medicine 9:140-149.
Prietto, C. A, and V. J. Caiozzo. 1989. The in vivo force-velocity relationship of the knee flexors and extensors. American Journal of Sports Medicine
17:607-611.
Rasch, P. J. 1989. Kinesiology and applied anatomy. Lea and Febiger. Philadelphia.
Rothstein, J. M., R. L. Lamb, and T. P. Mayhew. 1987. Clinical uses of isokinetic measurements. Physical Therapy 67: 1840-1844.
Schantz, P. G., T. Moritani, E. Karlson, E. Johansson, and A. Lundh. 1989. Maximal voluntary force of bilateral and unilateral leg extension. ACT A
Physiological Scandinavia 136: 185-192.
Seto, J. L., A. S. Orofino, M. C. Morrissey, J. M. Medeiros, and W. J. Mason. 1988. Assessment of quadriceps/hamstring strength, knee ligament stability, functional and sports activity levels five years after anterior cruciate ligament
Sherman, W. M., D. R. Pearson, M. J. Plyley, D. L. Costill, A. J. Habansky, and D. A. Vogelgesang. 1982. Isokinetic rehabilitation after surgery. American Journal of Sports Medicine 10:155-161.
Smidt, G. L., and M. W. Rogers. 1982. Factors contributing to the regulation and assessment of muscular strength. Physical Therapy 62: 1283-1290.
Soderberg, G. L., S. D. Minor, K Arnold, T. Henry, J. K. Chatterson, D.R. Poppe, and C. Wall. 1987. Electromyographic analysis of knee exercises in healthy subjects and in patients with knee pathologies. Physical Therapy 67:1691-1696.
Solomonow, M., R. Baratta, B. H. Zhou, H. Shoji, W. Bose, C. Beck, and R.
D'Ambrosia. 1987. The synergistic action of the anterior cruciate ligament and thigh muscles in maintaining joint stability. American Journal of Sports
Medicine 15:207-213.
Sommerlath, K. 1990. Ligament injury does not impair long-term knee function. American Family Physician 41:1231.
Timm, K. E. 1988. Postsurgical knee rehabilitation. American Journal of Sports Medicine 16:463-468.
Vandervoort, A. A, D. G. Sale, and J. Moroz. 1984. Comparison of motor unit activation during unilateral and bilateral leg extension. Journal of Applied Physiology 56:46-51.
Vint, P. 1991. Comparison of synchronous versus asynchronus bilateral isokinetic shoulder strength testing procedures. Masters Thesis. University of
Delaware. 154pp.
Warren, R.F., and J.L. Marshall. 1978. Injuries of the anterior cruciate and medial collateral ligaments of the knee. Clinical Orthopedics 136: 198-211.
APPENDIX A
CONSENT FORM--- Investigation of Strength Parameters in Determining Total Rehabilitation of the Knee
DESCRIPTION OF STUDY
Rehabilitation after knee surgery is a long, slow process that varies with respect to time in each individual. For the trainer or Physical Therapist it is hard to determine when the patient is fully recovered or where he/ she is in the rehabilitation process without being subjective in some way. Some trainers/ Physical Therapists use different standards to determine "full recovery" when rehabilitating patients involved in specific sports. The objective of the research would be to reduce the amount of subjectivity in diagnosing how far along the patient is in bis/ her
rehabilitation. Three groups of people will be tested- (1) Normal, or control group with no history of knee surgery or injury, (2) a group that has had a prior knee surgery, but has fully recovered for 6-12 months, and (3) a group that has just recently had knee surgery and is at the stage where they can start to use the Cybex knee extension machine. Using a Cybex II Isokinetic Dynamometer, torque data for the flexion/ extension of the knee will be collected for analysis. The testing positions used are taken from the Cybex manual. Different testing speeds will be used to study the overall effects of velocity. An EMO study will also be performed to look at how fatigue affects rehabilitation.
POSSIBLE RISKS
The possible risks to the subjects will be minimal. Since the exercise being
athletes with weight lifting experience, the only possible outcomes of the testing would be strained muscles and/ or ligaments. As for the Group (3) subjects, reinjuring the ligament would also be possible. Since the Physical
Therapist/ athletic trainer who designs the workout will also be supervising the workout, there is a small chance of reinjury. The subjects in Group (3) would be performing the same exercises for rehabilitation even if this study was not being conducted, therefore the research does not increase the risk of injury.
BENEFITS
All subjects will receive a printed copy of their data. The data collected from this investigation will help define the importance of certain strength parameters when determining at what stage the knee is at during rehabilitation.
CONFIDENTIALITY
TIME REQUIRED
Groups (1) and (2) will be tested on a maximum of two days, with a total testing time of four hours maximum. Group (3) will be tested on three different days maximum, with a total testing time of five hours.
QUESTIONS
Please direct any questions regarding your participation in this study to:
Sarah J. Krieger
1130 Veterinary Medicine Center Iowa State University
CONSENT FORM-- Investigation of Strength Parameters in Determining Total Rehabilitation of the Knee
I have read and understood the instructions, benefits, risks, and time required outlined on the attached form, and all of my questions have been answered
satisfactorily. I understand emergency treatment of any injuries that may occur as a direct result of participation in this research will be treated at the Iowa State
University Student Health Services, Student Services Building, and/or referred to Mary Greeley Hospital or another physician. I understand compensation for treatment of any injuries that may occur as a direct result of participation in this research may or may not be paid by Iowa State University depending on the Iowa Tort Claims Act. I understand claims for compensation will be handled by the Iowa State University Vice President for Business and Finance. I understand any
appropriate alternative procedures will be performed if they are advantageous to me
As indicated by my signature below, I voluntarily consent to serve as a participant in this study. I understand that I can withdraw from this study at any time and that I can decline to participate in any part of it or decline to answer any questions without prejudice to me.
Name (printed)
Street Address
City State Zip Code
Participant's Signature
APPENDIXB
0291111 679.95 85.36 0301111 754.46 77.77
0291111 535.81 72.37 0301111 677.25 89.12
0291112 705.15 80.40 0301112 842.20 78.14
0291112 519.64 61. 34 0301112 662.71 81.17
0291113 659.44 89.47 0301113 753.37 81.10
0291113 499.61 64.89 0301113 615.39 86.69
0291114 641. 89 80.83 0301114 796.21 79.08
0291114 497.44 55.56 0301114 635.59 82.71
0291115 643.99 88.18 0301115 704.67 85.19
0291115 440.87 56.18 0301115 593.24 86.57
0291116 682.91 89.64 0301116 747.11 84.20
0291116 529.48 59.81 0301116 618.26 85.62
0292111 740.52 84.48 0302111 937.37 75.81
0292111 602.61 52.19 0302111 653.37 82.48
0292112 828.69 73.23 0302112 835.30 72.37
0292112 634.76 51. 00 0302112 592.21 84.41
0292113 685.97 80.01 0302113 862.78 73.05
0292113 487.93 55.24 0302113 566.24 92.37
0292114 665.63 73.97 0302114 790.33 68.30
0292114 446.17 41. 55 0302114 538.26 78.31
0292115 746.41 86.85 0302115 871. 06 78.49
0292115 405.39 55.27 0302115 593.87 84.20
0292116 920.72 73.40 0302116 780.86 71. 56
0292116 567.02 46.33 0302116 542.91 80.80
0293111 761. 03 76.57
0293111 418.16 43.24
0293112 861. 4 7 84.53
0293112 596.26 41. 91
0293113 870.14 68.33
0293113 557.57 32.31
0293114 766.20 82.04
0293114 559.41 35.63
0293115 853.89 61. 86
0293115 550.08 38.01
0293116 819.57 86.53
Tq start Pk Tq End Time to Pk
0291111 282 518 236 593 494 99
0291112 294 542 248 587 486 101
0291113 274 570 296 520 396 124
0291114 406 710 304 573 446 127
0291115 250 498 248 543 442 101
0291116 178 442 264 592 483 109
0292111 274 546 272 549 346 203
0292112 342 590 248 580 402 178
0292113 330 530 200 533 379 154
0292114 366 614 248 562 374 188
0292115 314 538 224 558 396 162
0292116 266 494 228 589 418 171
0293111 314 506 192 558 360 198
0293112 250 442 192 586 388 198
0293113 250 394 144 566 415 151
0293114 234 426 192 562 362 200
0293115 318 486 168 553 375 178
0293116 262 466 204 585 373 212
0301111 854 1138 284 486 377 109
0301112 466 770 304 500 385 115
0301113 342 630 288 492 383 109
0301114 390 662 272 494 375 119
0301115 430 678 248 489 386 103
0301116 358 638 280 491 379 112
0302111 378 546 168 498 358 140
0302112 390 558 168 478 351 127
0302113 474 634 160 485 363 122
0302114 406 566 160 481 354 127
0302115 390 550 160 483 365 118
0302116 418 582 164 473 360 113
0303111 422 566 144 467 321 146
0303112 418 522 104 471 364 107
0303113 394 522 128 473 334 139
0303114 386 518 132 470 334 136
0303115 422 558 136 467 325 142
0303116 450 538 88 463 365 98
0251111 410 694 284 573 684 -111
0251112 278 510 232 619 711 -92
0251113 378 874 496 586 770 -184
0251114 422 750 328 582 705 -123
0251115 318 678 360 611 747 -136
0272111 294 534 240 572 745 -173
0272112 322 558 236 576 748 -172
0272113 334 558 224 675 836 -161
0272114 166 398 232 638 802 -164
0272115 338 586 248 619 799 -180
0272116 246 478 232 609 775 -166
0273111 362 554 192 602 802 -2 00
0273112 322 438 116 659 788 -129
0273113 318 502 184 662 857 -1 95
0273114 274 498 224 568 800 -23 2
0273115 274 478 204 606 819 -213
0273116 334 550 216 575 801 -22 6
0281112 446 742 296 648 762 -114
0281113 562 890 328 643 767 -124
0281114 402 714 312 659 776 -117
0281115 426 754 328 640 765 -125
028 1116 546 874 328 646 768 -122
0282111 422 638 216 659 825 -166
0282112 418 618 200 674 815 -141
0282113 354 586 232 653 827 -174
0282114 414 606 192 682 823 -141
0282115 402 630 228 661 830 -16 9
0282116 474 678 204 657 806 -149
0911112 866 1074 208 263 329 -66
0911113 722 930 208 380 334 46
0911114 1618 1822 204 389 344 45
0911115 590 786 196 390 344 46
0911116 1578 1770 192 152 333 -181
0912111 562 754 192 102 47 55
0912112 866 1062 196 96 28 68
0912113 930 1122 192 101 47 54
0912115 886 1082 196 101 45 56
0912116 294 486 192 101 47 54
0913111 494 598 104 99 31 68
0913112 566 678 112 64 29 35
0913113 790 894 104 80 29 51
0913114 242 346 104 102 31 71
0913115 2022 2138 116 99 33 66
APPENDIXC
y = 60.265 + 7.3561e-2x R"2 = 0.710
80
c:J MF
70
0 100 200 300 400
Time to Peak
y = 55.861 + 2.2046e-2x R"2 = 0. 759
80
c::i MF
70
60 4-~~...-~~...--~--.~~--....~~--.-~~..-~~.--~--t
400 600 800 1000 1200
Peak Torque
(/)
::E
a:
y = 1090.9 - 0.28942x R'·2 = 0.599
1000
900 c:J AMS
800
700 -t-~~..--~-....~~-.-~~-r-~~~~-.-~~._l;l~----l
400 600 800 1000 1200
Peak Torque
en
~
a:
y = 1022.7 - 0.91050x R-'·2 = 0.498
s RMS
0 100 200 300 400
Time to Peak
80
70
y = 11 4.06 - 4.6929e-2x R" 2 = 0.481
1:1 MF
700 800 900 1000 11 00
RMS
60
58
56
54
LL :E
52
50
48
46
y = 49.763 + 2.6257e-2x R'·2 = 0.146
a a
GI
a a GI
a MF
a
t:l
a
100 120 140 160 180 200 220
Time to Peak
u...
:E
y = 56. 112 - 4.2992e-3x R'·2 = 0.032
60
58 B l!I
B
56 BB l:l
54
B MF
52 B l!I
50 a
B
48 a
46
200 300 400 500 600 700
RMS
600
500
Cl) ~
a:
400
300
y = 836.29 - 2.1953x R"2 = 0.589
!!I RMS
!!I !!I !!I
l!I l!I
100 120 140 160 180 200 220
Time to Peak
y = 973.05 - 1. 1200x R"2 = 0.469
600
500
1:1 RMS
400
300
200 -+-~~--.~~~-.-~~~~~~~~~~~~~~
300 400 500 600
Peak Torque
LL
::E
y = 50.442 + 8.1715e-3x R"2 = 0.043
60
58 c:J B
B
56 B ID
54
c:J
52 B c:J
50 El
El
48 a
46
300 400 500 600
Peak Torque
Peak torque versus mean frequency for the in-rehab subject for all speeds tested
y
=
52.987 + 3.2591e-2x R" 2=
0.28590
80 c::J MF
70
600 700 800 900 1000 11 00
Peak Torque
90
80
70
y = 58.995 + 9.3253e-2x R"2 = 0.265
l!I MF
100 200 300 400
Time to Peak
u..
~
y = 116.61 - 4.8324e-2x R"2 = 0.301
90 t:J
t:J t:J
c:J
l!I
80
c:J MF
c:J
l!I
70
c:J
600 700 800 900 1000
RMS
..J
..J
~
:> a
...
0
....
a.
y = 308.26 + 0.72458x R"2 = 0.432
1100
1000
900 e P.Torque LL
800
e
700 e e
600 -+-~-.-~--.~~....--~...-~--...~---.~~....--~""T"""~--.-~--;
600 700 800 900 1000 11 00
Peak Torque
..J ..J
:,t
CV
Q) Q.
0
-
Q) EI-Y = - 86.119+1 .51 17x R ~ 2 = 0 . 524
400
300 I:] Time to Peakll
200
100 -r-~..__--..~~~-.-~~~...-~~---r~~~~~~--l
100 200 300 400
Time to Peak
900
800
700
600
y = 1059.3 - 1 .3472x R"2 = 0.429
c:i RMS
!:] !:] !:] l!I c:J
100 200 300 400
Time to Peak
en
~
a:
900
800
700
600
y = 961.97 - 0.25088x R ~ 2 = 0.131
o RMS
a
El a
m El
600 700 800 900 1000 11 00
Peak Torque
300
;x
=
Cl)Q.
0
-
Cl)E
~ 200
100
y = 30.588 + 0.23602x R"2 = 0.491
e e
i::i Time to Peak
e
t:l
600 700 800 900 1000 1100
Peak Torque