2007
Transposable elements and genome size dynamics
in Gossypium
Jennifer S. Hawkins Iowa State University
Follow this and additional works at:https://lib.dr.iastate.edu/rtd Part of theGenetics and Genomics Commons
This Dissertation is brought to you for free and open access by the Iowa State University Capstones, Theses and Dissertations at Iowa State University Digital Repository. It has been accepted for inclusion in Retrospective Theses and Dissertations by an authorized administrator of Iowa State University Digital Repository. For more information, please contactdigirep@iastate.edu.
Recommended Citation
Hawkins, Jennifer S., "Transposable elements and genome size dynamics in Gossypium" (2007).Retrospective Theses and Dissertations. 15894.
Transposable elements and genome size dynamics in Gossypium
by
Jennifer S. Hawkins
A dissertation submitted to the graduate faculty
In partial fulfillment of the requirements for the degree of
DOCTOR OF PHILOSOPHY
Major: Botany
Program of Study Committee: Jonathan F. Wendel, Major Professor
Lynn G. Clark John D. Nason Thomas Peterson Randy Shoemaker
Dan Voytas
Iowa State University
Ames, Iowa
2007
3274835
2007
UMI Microform
Copyright
All rights reserved. This microform edition is protected against unauthorized copying under Title 17, United States Code.
ProQuest Information and Learning Company 300 North Zeeb Road
P.O. Box 1346 Ann Arbor, MI 48106-1346
TABLE OF CONTENTS
LIST OF FIGURES iv
LIST OF TABLES v
ABSTRACT vi
CHAPTER ONE. GENERAL INTRODUCTION 1
Description of Research Objectives 1
Dissertation Organization 2
Literature Cited 3
CHAPTER TWO. AN INTRODUCTION TO EUKARYOTIC GENOME SIZE
VARIATION 4
Introduction 4
Mechanisms of Genome Size Change 5
Transposable Elements and Genome Size Variation 8
Gossypium as a Model System for the Study of Genome Size Evolution 12
Literature Cited 13
CHAPTER THREE. DIFFERENTIAL LINEAGE-SPECIFIC AMPLIFICATION OF TRANSPOSABLE ELEMENTS IS RESPONSIBLE FOR GENOME SIZE
VARIATION IN GOSSYPIUM 25
Abstract 25
Introduction 26
Methods 29
Results 34
Discussion 38
Concluding Remarks 42
Acknowledgments 43
Literature Cited 43
CHAPTER FOUR. RAPID DNA LOSS AS A COUNTERBALANCE TO RETROTRANSPOSON PROLIFERATION IN PLANT GENOME SIZE
EVOLUTION 61
Abstract 61
Introduction 62
Methods 64
Results 67
Discussion 70
Concluding Remarks 72
Acknowledgments 73
CHAPTER FIVE. PHYLOGENETIC DETERMINATION OF THE PACE OF TRANSPOSABLE ELEMENT PROLIFERATION IN
PLANTS: COPIA AND LINE-LIKE ELEMENTS IN GOSSYPIUM 84
Abstract 84
Introduction 85
Methods 87
Results 89
Discussion 90
Acknowledgments 93
Literature Cited 94
CHAPTER SIX. GENERAL CONCLUSIONS 103
Literature Cited 107
LIST OF FIGURES
Evolutionary relationships among diploid members of Gossypium 58
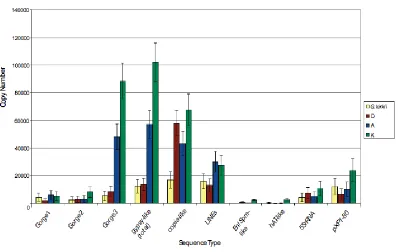
Copy number estimates for repetitive sequences in Gossypium 59
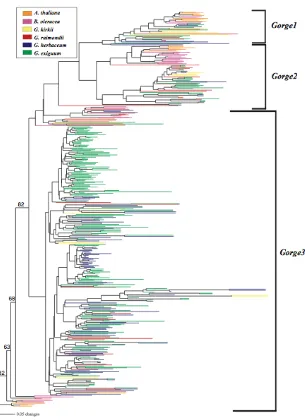
Neighbor-joining analysis of Gossypiumgypsy-like Gorge1, 2,
and 3 reverse transcriptase sequences 60
Lineage-specific nature and timing of Gorge3 transposition in Gossypium 80
Phylogenetic relationships and estimated rates of Gorge3 gain and loss
among diploid members of Gossypium 81
Neighbor-joining analysis of 724 PCR amplified Gorge3 reverse
transcriptase sequences 82
Density distributions of the parametric solution space possible
for the model based on empirical sampling error 83
Genome sizes and evolutionary relationships among diploid members
of Gossypium and a phylogenetic outgroup, Gossypioides kirkii 100 Neighbor-joining analysis of PCR amplified RT fragments of copia and
LINE retrotransposons from Gossypium species and phylogenetic
outgroup, Gossypioides kirkii 101
LIST OF TABLES
Library construction and sequencing effort for three species representing
different Gossypium genomes and one phylogenetic outgroup 55
Repetitive element copy number and density estimates 56
Estimated copy number and total number of Mb of Gorge3 from
ABSTRACT
Although eukaryotic organisms display a wide range in genome size, from as little
as 9 Megabases (Mb) in some fungi to over 690,000 Mb in the diatom Navicula
pelliculosa, there is only an approximate 20-fold variation in the number of protein
coding genes. Additionally, this variation in genome size is not directly correlated with
organismal or morphological/physiological complexity. This striking contradiction has
historically been termed the "C-value paradox". Research conducted over the past half
century has revealed that most genome size variation in plants can be ascribed to the
repetitive fraction of the genome, particularly LTR-retrotransposons. Furthermore, recent
studies in maize and rice have revealed the tremendously dynamic nature of
LTR-retrotransposons, where transposition has occurred recently and rapidly, resulting in a
highly dynamic genome. To date, most studies of genome size evolution and
transposable element dynamics has been conducted in the grasses, or among a few
distantly related model dicots. In the work presented here, the cotton genus, Gossypium, was used to study genome size evolution and transposable element dynamics among
closely related, long-lived species, whose members diverged within the last 5-7 million
years. Provided is a description of the various types of repetitive sequences present and
their relative contributions to overall extant genome size among three Gossypium species and a phylogenetic outgroup, Gossypioides kirkii. Results indicate that one type of
gypsy-like LTR-retrotransposon, Gorge3, is responsible for much of the genome size variation in the genus. However, different transposable elements behave differently in
different genomes, and estimated copy numbers are not always correlated with genome
size. Further detailed analysis of the evolutionary history of Gorge3 suggests that this LTR-retrotransposon underwent lineage-specific proliferation in each clade, and that
these proliferation events occurred in an episodic manner at different time points in each
of the genomes investigated. Using a novel modeling approach, it is shown that although
lineage-specific transposition of Gorge3 has occurred in the taxa having small genomes, the magnitude of DNA removal outweighs DNA gain through transposition, ultimately
two other relatively abundant repetitive sequences, copia-like LTR-retrotransposons and non-LTR LINEs, indicates that lineage-specific amplification has occurred for each
sequence type in each lineage. Copia-like LTR-retrotransposons, similar to that found for Gorge3, undergo episodic proliferation at different time points in each genome. In contrast, non-LTR LINEs appear to accumulate in a more stochastically regular manner,
and phylogenetic analysis suggests that the majority of the Gossypium LINE population is dominated by ancient sequences that predate divergence events within the genus. The
cumulative results of this dissertation work indicate that transposable element
proliferation has occurred recently and rapidly in all genomes investigated and their
differential accumulation or retention contributes significantly to variation in genome size
CHAPTER ONE
General Introduction
Description of Research Objectives
For the past half century is has been widely recognized that there is no correlation
between total physical nuclear content and organismal or genetic complexity (Price 1988;
Sparrow et al. 1972). This well-documented deficiency in an overall correlation between
genome size and morphological or physiological complexity of an organism has
historically been termed the "C-value paradox" (Thomas 1971). Originally thought to
reflect differences due to polyploidy, it is now evident that the majority of genome size
variation is due to differential accumulation of the repetitive fraction of the genome.
Since this discovery, the once seemingly contradictory "C-value paradox" has now
graduated to the now perplexing "C-value enigma" in order to highlight the fact that
genome size variation results from a complex combination of forces (Gregory 2002;
Gregory 2004). However, many questions remain to be addressed. As most studies to
date have been conducted within model grass systems and a few select but distantly
related dicots, our current knowledge with respect to pace, tempo and directionality of
genome size change reflects evolutionary trends within primarily short-lived annual taxa.
Few comparative analyses have been conducted among closely related species, posing the
potential caveat of detecting multiple overlapping mutational events that may be easily
misinterpreted.
The purpose of my doctoral research is to contribute to the overall understanding
of the pace, tempo and directionality of genome size change by employing the
phylogenetically informed, recently diverged, non-grass system, Gossypium. In this work, I describe the spectrum and frequency of the various kinds of sequences that are
responsible for genome size variation, and determine if this variation is due to an
increase/decrease in the number of transposable element families, an increase/decrease in
element copy numbers from particular families, or both. The following questions are
1. What types of repetitive elements in general and transposable elements in particular
are present in Gossypium and what are their copy numbers? 2. How does this spectrum vary phylogenetically?
3. Is there a correlation between transposable elements copy number and genome size?
4. Do all transposable element families expand in a linear fashion ("one-way ticket to
genomic obesity" hypothesis) or do some increase while others decrease, and are some
families consistently over-represented/under-represented in larger genomes?
5. Do some species appear to be more efficient in removal of non-genic DNA and is
there a correlation between this efficiency and genome size?
Dissertation Organization
The body of this dissertation work is organized into five chapters. Chapter two,
entitled "An Introduction to Eukaryotic Genome Size Variation", provides an overview of
the current literature in the field, with a particular emphasis on our understanding of the
effects of transposable elements on genome size evolution. The following three chapters
consist of original research results on the effects of transposable elements on genome size
evolution in the cotton genus, Gossypium. Chapter 3, entitled "Differential lineage-specific amplification of transposable elements is responsible for genome size variation
in Gossypium" and published in the journal Genome Research, describes work in which we sequenced a portion of three Gossypium genomes that vary 3-fold in total nuclear DNA content, and described the various repetitive sequences in each genome, with
respect to their relative contributions to overall genome size (Hawkins et al. 2006).
Chapter 4, entitled “Rapid DNA loss as a counterbalance to genome expansion through retrotransposon proliferation in plants” and submitted to the Proceedings of the National Academy of Sciences of the USA, provides an investigation into the evolutionary history of the gypsy-like LTR-retrotransposon, Gorge3, and presents a novel modeling approach to describe the various rates of Gorge3 gain and loss in each Gossypium lineage. This work is extended in Chapter 5, entitled " Phylogenetic determination of the pace of
Gossypium" prepared for submission to the journal Genome, where we evaluate the
evolutionary history of copia-like LTR-retrotransposons and LINEs among the various
Gossypium species. A final chapter summarizing the results of this dissertation work follows these original research chapters.
Literature Cited
Gregory, T.R. 2002. A bird's eye view of the C-value enigma: genome size, cell size, and
metabolic rate in the class Aves. Evolution56: 121-130.
Gregory, T.R. 2004. Macroevolution, hierarchy theory, and the C-value enigma.
Paleobiology30: 179-202.
Hawkins, J.S., H. Kim, J.D. Nason, R.A. Wing, and J.F. Wendel. 2006. Differential
lineage-specific amplification of transposable elements is responsible for genome
size variation in Gossypium. Genome Res. 16: 1252-1261.
Price, H.J. 1988. Nuclear DNA content variation within angiosperm species.
Evol. Trend. Plant.2: 53-60.
Sparrow, A.H., H.J. Price, and A.G. Underbrink. 1972. A survey of DNA content per cell
and per chromosome of prokaryotic and eukaryotic organisms: some evolutionary
considerations. Brookhaven Sym. Biol.23: 451-494.
CHAPTER TWO
An Introduction to Eukaryotic Genome Size Variation
Introduction
The genomes of eukaryotic organisms vary approximately 80,000-fold in size,
ranging from 9 Mb in some fungi to over 690,000 Mb in the diatom Naviculapelliculosa
(Cavalier-Smith 1985; Li and Graur 1991). Large ranges in genome size are common in
various types of organisms, varying 5800-fold among protozoans, 250-fold among
arthropods, and 5000-fold among algae (Gregory 2001; Neafsey and Palumbi 2003).
Angiosperm genome sizes range from approximately 38 Mb in Cardamine amara
(Brassicaceae) to over 120,000 Mb in some members of the Liliaceae (Bennett and Leitch
1995; Bennett and Leitch 1997; Flavell et al. 1974; Leitch et al. 1998). Not only are wide
ranges in genome size common across distantly related organisms, but have also been
observed in closely related species: genome sizes range approximately 6-fold among
members of the genus Vicia (Chooi 1971), and 9-fold within the genus Crepsis, (Jones and Brown 1976). Interspecific genome size variation has also been observed (Price
1988). Along a 400 meter transect in Evolution Canyon, Mount Carmel, Israel, in which
the microclimate differs in both solar irradiation and aridity, genome size was weakly
correlated with slope orientation in local populations of wild barley(Hordeum
spontaneum) (Kalendar et al. 2000). Plants sampled from the south facing slope typically had larger genomes than those of the north facing slope.
A fraction of this genome size variation can be ascribed to differences in gene
number due to segmental duplication and polyploidization, in addition to limited amounts
of gene loss (Bancroft 2001; Bennetzen and Ramakrishna 2002; Blanc et al. 2000; Grant
et al. 2000; Ku et al. 2000; Tikhonov et al. 1999; Vision et al. 2000; Wendel 2000).
Nevertheless, greater than 90% of plant genes possess close homologs within most other
plant species, indicative of highly conserved gene content (Bennetzen 2000a). In fact,
there is only a 20-fold variation in the number of protein coding genes among all
majority of this genome size variation can be ascribed to the repetitive fraction of the
genome (Bennetzen 2000b; Bennetzen 2002; Kidwell 2002).
Mechanisms of Genome Size Change
Genome Size Expansion.
There are several well-known factors that contribute to genome size increase
(Bennetzen and Ramakrishna 2002; Blanc et al. 2000; Ku et al. 2000; Tikhonov et al.
1999; Wendel 2000). One of these factors is polyploidy (Leitch and Bennett 1997;
Wendel 2000), in which the entire genomic content of an organism is doubled and both
subgenomes coexist within the same nucleus with little to no disruption of the genic
balance of that organism. Estimates suggest that were this the only means of genome
duplication, as few as 10 rounds of polyploidization would be required to account for the
large range in genome size observed between E. coli and mammals (Nei 1969). Particularly relevant is the recent work by Schlueter et al. in which ESTs from eight
diverse angiosperms were mined to identify potential gene duplicates (Schleuter et al.
2004). By calculating the synonymous and nonsynonymous distances for the 1392 gene
duplicates recovered from the EST libraries, the authors were able to identify several
rounds of whole-genome duplication events in each of the lineages evolutionary histories.
Additionally, Schlueter et al. were able to identify a shared duplication event among
members of the Poaceae. Blanc and Wolfe performed a similar study in which they
compared gene duplicates among 14 model plant species (Blanc and Wolfe 2004). The
author's results were similar to that of Schlueter el al., in which they found evidence for
multiple ancient duplication events in each of the genomes investigated. More recently,
Cui et al.(2006) extended this work to lineages outside of previously studied model crop
species by performing comparisons of duplicate genes among basal angiosperms (Cui et
al. 2006). The authors found evidence of multiple whole-genome duplication events
throughout the history of angiosperms, although they were unable to find evidence for a
duplication event in pine. This work indicates that polyploidy is widespread, and not
necessarily limited to crop species where a predisposition to polyploidy would increase
some organisms undergo polyploidy while others do not. Polyploidy has also been
observed in animals (Pebusque et al. 1998; Smith et al. 1999; Wolfe and Shields 1997),
although this phenomenon appears to be more common in plants and likely contributes to
the wider range in genome size observed across plants relative to animals.
Activation and accumulation of transposable elements may also contribute to
genome size expansion by allowing amplification and insertion of newly synthesized
elements. Evidence from maize indicates that its genome size has doubled over the last 3
million years due to transposable element proliferation alone (SanMiguel and Bennetzen
1998). Additionally, recent studies in rice show massive, lineage-specific amplification
of LTR-retrotransposons in a large genome member of the genus, Oryza australiensis, suggesting these new transposon insertions have lead to its relatively bloated genome
(Piegu et al. 2006). The contribution of transposable element amplification to genome
size variation will be discussed further below.
Less often, a large-scale duplication of a part of the genome or fixation of an
accessory chromosome may be responsible for flux in genome size. Segmental
duplication has been demonstrated in rice, where a 3 Mb duplication has occurred
between chromosomes 11 and 12, two chromosomes rich in disease resistance genes (The
rice chromosomes 11 and 12 sequencing consortia 2005; Wang et al. 2005). These types
of mutations are less likely to have a large impact on variation in genome size (compared
to polyploidy and amplification of repetitive DNA) because of their increased potential
for disruption of the genic balance of the organism. In most cases, the results of
chromosomal duplication are fatal, but in some cases such as duplication of the smaller
chromosomes, the progeny are viable yet sterile (Hamerton 1971; Lindsley et al. 1972).
Genome Size Contraction.
Although it has been suggested that organisms may have a "one-way ticket to
genomic obesity" (Bennetzen and Kellogg 1997), it is possible that differences in genome
size are not only the outcome of an organism's tolerance for accrual of non-genic DNA,
but the efficiency of an organism in the removal of non-essential DNA (Petrov 2002;
smaller genomes are strikingly lacking in non-genic DNA. Examples include birds,
Arabidopsis and Drosophila, all harboring very few transposable elements. Studies of indel patterns within "dead-on-arrival" (DOA) non-LTR retroelements (pseudogenes) in
Drosophila compared to Laupala (cricket), whose genome sizes vary 11-fold, suggest an increased rate of DNA loss in organisms with smaller genomes compared to species of
insects with larger genomes (Petrov and Hartl 1997; Petrov et al. 2000). These indel
patterns observed in "DOA" non-LTR retrotransposons appear to be congruent with
patterns observed in other parts of the genome, including both euchromatic and
heterochromatic regions, transposable and non-transposable non-genic DNA, in addition
to repetitive and unique sequences (Petrov 2002). The rate of DNA loss in Drosophila is 40-fold higher than the rate of DNA loss in Laupala (Petrov et al. 1996; Petrov et al. 2000). The authors suggest that an inverse correlation exists between genome size and
rate of DNA loss. A study by Kirik et al., (2000) parrots this conclusion. In a
comparison of Arabidopsis and tobacco, whose genomes vary approximately 20-fold in size (Bennett and Leitch 1997), deletions in Arabidopsis were on average one-third larger than those found in tobacco (Kirik et al. 2000). The authors found no insertions
associated with deletions in Arabidopsis, but conversely, approximately one-half of the repair events in tobacco were associated with an insertion (Salomon and Puchta 1998).
DNA loss may also occur via other mechanisms. In some instances, whole
chromosome loss may occur upon hybridization of distantly related species (Laurie and
Bennett 1989; Riera-Lizarazu et al. 1996), although this often results in intermediates
with low fertility due to aneuploid gametes (Bennetzen 2002). The same instability is
observed in the event of unequal recombination between homologous chromosomes.
Because of highly unstable intermediates, these processes likely contribute little to
genome size evolution. However, unequal intra-strand homologous recombination
between two tandem repeats in the same orientation, such as the LTRs of
retrotransposable elements, can result in DNA loss of one of the repeats and the
intervening DNA sequence (Bennetzen 2002). Indeed, solo LTRs have been observed
within various organisms (Chen et al. 1998; SanMiguel et al. 1996; Shepherd et al. 1984;
single retrotransposon can lead to attenuation of genome expansion but would not reverse
the expansion process due to the remaining LTR. However, SanMiguel et al. have shown
that large blocks of nested LTR retrotransposons exist within the maize genome
(SanMiguel et al. 1996). Should intrastrand recombination take place between the LTRs
of adjacent retrotransposons or of entire retrotransposon blocks, a net loss of DNA would
be expected (Bennetzen 2002).
Transposable Elements and Genome Size Variation
Evidence from Comparative Genomics Studies.
Early studies exploiting reassociation kinetics led to the realization that much of
the eukaryotic genome is composed of repetitive DNA (Britten and Kohne 1968). Britten
and Kohn determined that the eukaryotic genome can be divided into four major
fractions, foldback DNA, highly repetitive DNA, middle-repetitive DNA, and single copy
DNA, and that the majority of the genome was composed of repetitive sequences.
Subsequently, several investigations have provided support for Britten and Kohn's
findings. Repetitive DNA constitutes approximately 80% of angiosperm genomes with
haploid DNA content greater than 5.0 pg (Flavell et al. 1974). Approximately 60% or
more of the maize (Meyers et al. 2001; SanMiguel and Bennetzen 1998; SanMiguel et al.
1996), wheat (Wicker et al. 2001) and barley (Shirasu et al. 2000; Vicient et al. 1999)
genomes are made up of transposable elements. Nearly 25% of the maize genome is
composed of 5 classes of Long Terminal Repeat (LTR) retrotransposons alone
(SanMiguel et al. 1996). Approximately 80% of the wheat genome is repetitive DNA,
mainly LTR retrotransposons (Kumar and Bennetzen 1999). These observations have led
to an increased interest in the importance of repetitive DNA on genome size variation and
the effect of this variation on plant fitness.
Comparative genomic studies suggest extensive conservation of gene content in
addition to significant microcolinearity of protein coding sequences between closely
related species, and support the hypothesis that the majority of sequence variation (both
sequence types in addition to number of nucleotides) occurs within the intergenic,
2001; Feuillet and Keller 1999; Tarchini et al. 2000; Tikhonov et al. 1999). Tikhonov et
al. compared 225 kb of the maize adh region containing 9 candidate genes to the
orthologous 78 kb adh region in sorghum, whose genome is 3.5-fold smaller than that of maize (Tikhonov et al. 1999). Homologs of these 9 maize genes were found in colinear
order in the adh region of sorghum. In addition, 5 other sorghum genes were identified, three of which were deleted in the maize region but present elsewhere in the maize
genome. Therefore, the protein coding sequences of the adh region in sorghum and maize are largely colinear with a few minor rearrangements. As expected, the major
unconserved regions were the intergenic regions between the genes. Many mobile
elements, such as retrotransposons and MITEs, in addition to simple sequence repeats
were abundant in the maize adh region, whereas in sorghum, LTR-retrotransposon presence was limited. Similarly, Tarchini et al. sequenced 340 Kb of the adh1-adh2 region in rice, and the sequences were subsequently cross-hybridized to maize genomic
DNA (Tarchini et al. 2000). A high degree of microcolinearity was observed between the
maize and rice regions with the exception of the adh1 gene itself. In rice, 35 kb separates the adh1 and adh2 loci, whereas in maize the two loci are found on separate
chromosomes. Many transposable elements were identified in the rice sequence,
comprising 14.4% of the segment. In contrast, retrotransposons make up approximately
60% of the maize genome. In light of the number of these elements found in maize
compared to rice, the authors suggest that retrotransposons may greatly contribute to
genome expansion.
In a comparison of the sh2/a1 homologous regions of maize, rice, and sorghum,
the sh2 region of maize was 75% homologous over 256 bp to rice and 92% homologous
over 365 bp to sorghum (Chen et al. 1998; Chen et al. 1997). The a1 region of maize revealed 82% identity over 600 bp to rice. The genes in rice and sorghum were in the
same order and orientation as their homologs in maize. Therefore, although these species
have undergone millions of years of independent evolution, they have maintained gene
content and order in this region of the genome. The coding sequences were highly
rice, suggesting that variation between these species occurs in the intergenic, repetitive
regions of the genome.
A study comparing a 23 Kb fragment surrounding the Lrk10 sequence in wheat to the Lrk regions in barley, maize, and rice also suggests conservation of gene order and content among closely related grass species (Feuillet and Keller 1999). The Lrk10 sequence in wheat was identified adjacent to the Tak10 sequence in opposite orientation. A pseudogene homologous to the LRR10 gene was identified upstream of the Lrk and Tak
sequences. The position and orientation for these sequences was conserved in all 4
species. In addition, few mobile elements were detected in the sorghum, rice, and barley
genomes relative to the maize genome, providing further evidence that mobile elements
are the agents of marked genome size differences among these closely related grasses.
More recently, several comparative genomics studies have provided new insight
into the mechanisms that contribute to genome size expansion and contraction. A
particularly eloquent example is that of Ma and Bennetzen (2004), in which the authors
compared >1 Mb of orthologous sequence from two Oryza sativa subspecies, japonica
and indica, and polarized all identifiable changes by including an outgroup, O. glaberrima (Ma and Bennetzen 2004). Although indica and japonica diverged ~0.44 mya, rapid genomic changes were detected. Both subspecies experienced significant
genome size increase (indica = 2%, japonica = 6%) due primarily to new insertions of LTR-retrotransposons. Additionally, evidence of DNA loss via illegitimate
recombination and intra-strand homologous recombination was apparent in both
genomes. Indeed, the number of deletions far outweighed the number of insertions.
Nevertheless, these small deletions were not enough to counter genome size expansion
through transposon insertion, resulting in a net increase in genome size.
Another recent study by Bruggman et al. compared duplicated regions of the
maize genome with their orthologous region in rice (Bruggman et al. 2006).
Approximately 7.8 Mb of maize chromosome 1 and its orthologous region on
chromosome 9 (6.6 Mb) were compared to a 4.9 Mb region on rice chromosome 3. The
authors found multiple mechanisms of genome evolution that contribute to genome
expanded significantly (by a factor of 5.25) due to transposon insertion relative to its
syntenic chromosome 9 counterpart. Additionally, genes in maize were typically larger
than those of rice due to larger introns, and 9% of the genes in this region were missing in
the syntenic rice region. The authors conclude that the C-value paradox results from a
combination of forces that act to expand and contract genome size.
Transposable elements.
Transposable elements have been found in all plants investigated to date
(Bennetzen 2000a). These elements are divided into two major classes based on the
structure of their coding sequences and the mechanism of transposition (Capy et al. 1997;
Finnegan 1989). The Class II plant transposon superfamilies are classified as
Activato/Dissociator-(Ac/Ds), Enhancer/Suppressor-mutator-(En/Spm) or Mutator-(Mu) systems based on the families first described in the maize genome and the Tam elements of Snapdragon (reviewed in Kunze et al. 1997). En/Spm elements are also referred to as CACTA elements because they share a common sequence (5'-CACTA-3') at their TIR
termini. An abundant group of small transposable elements, MITEs (Miniature Inverted
Transposable Elements), also have a structure that suggests they are members of the
Class II DNA elements (Bennetzen 2000b; Kidwell 2002). DNA elements were the first
types of transposable elements identified due to their mutagenic effects observed in maize
(McClintock 1949). DNA elements characteristically contain terminal inverted repeats
(TIR) ranging from 11 to a few hundred base pairs in length, and families of elements are
defined by these TIR sequences (Bennetzen 2000b). DNA elements are often found
preferentially in coding regions and non-methylated regions of the genome where there is
a high potential for active transcription to occur (Kumar and Bennetzen 1999). MITEs
display a particular affinity for genic regions (Jiang and Wessler 2001) and have
primarily been described in monocotyledonous plants although their existence in
dicotyledonous plants, humans, and insects has been documented (Amrani et al. 2002;
Bureau et al. 1994; Feschotte et al. 2002; Tikhonov et al. 1999; Tu 2001; Wessler et al.
1995; Yang and Hall 2003; Zhang et al. 2000). Because DNA elements transpose via a
the genome, they are probably not responsible for the large variation in genome size
observed across the plant kingdom (Kunze et al. 1997).
Class I elements contain the retroelements, by far the most abundant transposable
element in the plant kingdom (Bennetzen 2002; Bennetzen et al. 1993; Grandbastien
1998; Kumar and Bennetzen 1999). LTR-retroelements are ubiquitous, having been
described in all plant species studied to date. LTR-retroelements are divided into 2
classes, gypsy and copia-like, based on the position of the integrase domain within the element. Non-LTR retroelements consist of Long Interspersed Nuclear Elements
(LINEs) and Small Interspersed Nuclear Elements (SINEs). LINEs and SINEs may also
be found in high copy number in plants and have been identified throughout the plant
kingdom. Although some retroelements are found associated with genes (Bennetzen et
al. 1993; Grandbastien 1998; Hirochika et al. 1996; Johns et al. 1985; Pouteau et al.
1994), they are observed most frequently in methylated, presumably heterochromatic
regions of the genome and often nested within one another (Bennetzen et al. 1994;
Kumar and Bennetzen 1999; SanMiguel et al. 1998; SanMiguel et al. 1996).
Retroelements transpose via a duplicative mechanism, in which an RNA intermediate
formed from the parental copy is reverse transcribed, and the newly translated copies are
inserted into supplementary positions in the genome. This type of transpositional
mechanism may lead to the accumulation of large quantities of repetitive sequences,
likely contributing to the wide range in genome size variation observed across eukaryotic
organisms.
Gossypium as a Model System for the Study of Genome Size Evolution
Gossypium (Malvaceae) is a monophyletic genus comprising approximately 50 species of small trees and shrubs that are widespread throughout tropic and sub-tropical
regions of the world (Cronn et al. 2002; Fryxell 1992; Seelanan et al. 1997; Wendel and
Cronn 2002). Diploid members of the genus are divided into 8 groups based on 2C DNA
content and chromosome pairing behavior, in addition to fertility in interspecific hybrids
(Beasley 1941; Endrizzi et al. 1985). All diploid members of the genus have 13
nucleus in the American D genome species, to 2572 Mb per haploid nucleus in the
Australian K genome species add (Endrizzi et al. 1985; Fryxell 1979; Hendrix and
Stewart 2005; Wendel et al. 1999). An even larger range in genome size is observed
across the tribe, from only 590 Mb in Gossypioides kirkii and Kokia drynarioides to 4018 Mb per haploid nucleus in Thespesia populnea (Wendel et al. 2002). Gossypium
diverged from the G. kirkii + K. drynarioides lineage approximately 12.5 mya (Cronn et al. 2002; Seelanan et al. 1997). A single polyploidization event between the African A
and New World D genomes approximately 1-2 mya gave rise to the 5 currently described
allopolyploid species (reviewed in Wendel and Cronn 2002). Much is known concerning
the taxonomic relationships within the genus Gossypium. The closest extant relatives of the Gossypium allotetraploid species have been identified and the phylogeny of the genus is well described. The wide range in genome size observed across closely related diploid
species (3-fold) and well-established phylogeny make Gossypium an excellent system for the study of genome size evolution.
Literature Cited
Amrani, A.E., L. Marie, A. Ainouche, J. Nicloas, and I. Couee. 2002. Genome-wide
distribution and potential regulatory functions of AtATE, a novel family of miniature inverted-repeat transposable elements in Arabidopsisthaliana. Mol. Genet. Genomics267: 459-471.
Bancroft, I. 2001. Duplicate and diverge: the evolution of plant genome microstructure.
Trends Genet.17: 89-93.
Beasley, J.O. 1941. Hybridization, cytology, and polyploidy of Gossypium. Chronica Botanica6: 394-395.
Bennett, M.D. and I.J. Leitch. 1997. Nuclear DNA amount in angiosperms. Phil. Trans. Royal Soc. London B334: 309-345.
Bennetzen, J.L. 2000a. Comparative sequence analysis of plant nuclear genomes:
microcolinearity and its many exceptions. Plant Cell12: 1021-1029.
Bennetzen, J.L. 2000b. Transposable element contributions to plant gene and genome
evolution. Plant Mol. Biol.42: 251-269.
Bennetzen, J.L. 2002. Mechanisms and rates of genome expansion and contraction in
flowering plants. Genetica115: 29-36.
Bennetzen, J.L. and E.A. Kellogg. 1997. Do plants have a one-way ticket to genomic
obesity? Plant Cell9: 1509-1514.
Bennetzen, J.L. and W. Ramakrishna. 2002. Numerous small rearrangements of gene
content, order and orientation differentiate grass genomes. Plant Mol. Biol.48:
821-827.
Bennetzen, J.L., K. Schrick, P.S. Springer, W.E. Brown, and P. SanMiguel. 1994. Active
maize genes are unmodified and flanked by diverse classes of modified, highly
repetitive DNA. Genome37: 565-576.
Bennetzen, J.L., P.S. Springer, A.D. Cresse, and M. Hendrickx. 1993. Specificity and
regulation of the Mutator transposable elements system in maize. Crit. Rev. Plant Sci.12: 57-95.
Blanc, G. and K.H. Wolfe. 2004. Widespread paleopolyploidy in model plant species
Blanc, G., A. Barakat, R. Guyot, R. Cooke, and M. Delseny. 2000. Extensive duplication
and reshuffling in the arabidopsis genome. Plant Cell12: 1093-1101.
Britten, R.J. and D.E. Kohne. 1968. Repeated sequences in DNA. Science161: 529-540.
Bruggman, R., A.K. Bharti, H. Gundlach, J. Lai, S. Young, A.C. Pontaroli, F. Wei, G.
Haberer, G. Fuks, C. Du, C. Raymond, M.C. Estep, R. Liu, J.L. Bennetzen, A.P.
Chan, P.D. Rabinowicz, J. Quackenbush, W.B Barbazuk, R.A. Wing, B. Birren,
C. Nasbaum, S. Rounsley, K.F.X. Mayer, and J. Messing. 2006. Uneven
chromosome contraction and expansion in the maize genome. Genome Res.16:
1241-1251.
Bureau, T.E., S.E. White, and S.R. Wessler. 1994. Transduction of a cellular gene by a
plant retroelement. Cell77: 479-480.
Capy, P., C. Bazin, D. Higuet, and T. Langin. 1997. Dynamics and evolution of transposable elements. Landes Bioscience, Austin, TX.
Cavalier-Smith, T. 1985. The Evolution of Genome Size. John Wiley, New York.
Chen, M., P. SanMiguel, and J.L. Bennetzen. 1998. Sequence organization and
conservation in sh2/a1-homologous regions of sorghum and rice. Genetics148:
435-443.
Chen, M., P. SanMiguel, A.C. de Oliveira, S.-S. Woo, H. Zhang, R.A. Wing, and J.L.
Bennetzen. 1997. Microcolinearity in sh2-homologous regions of the maize, rice, and sorghum genomes. P. Natl. Acad. Sci. USA94: 3431-3435.
Chooi, W.Y. 1971. Variation in nuclear DNA content in the genus Vicia. Genetics68:
Cronn, R.C., R.L. Small, T. Haselkorn, and J.F. Wendel. 2002. Rapid diversification of
the cotton genus (Gossypium: Malvaceae) revealed by analysis of sixteen nuclear and chloroplast genes. Am. J. Bot.89: 707-725.
Cui L., P. Kerr Wall, J.H. Leebens-Mack, B.G. Lindsay, D.E. Soltis, J.J. Doyle, P.S.
Soltis, J.E. Carlson, K. Arumuganathan, A. Barakat, V.A. Albert, H. Ma, and
C.W. dePamphilis. 2006. Widespread genome duplications throughout the history
of flowering plants. Genome Res.16: 738-749.
Dubcovsky, J., W. Ramakrishna, P. SanMiguel, C.S. Busso, L. Yan, B.A. Shiloff, and
J.L. Bennetzen. 2001. Comparative sequence analysis of colinear Barley abd Rice
bacterial artificial chromosomes. Plant Physiol.125: 1342-1353.
Endrizzi, J.E., E.L. Turcotte, and R.J. Kohel. 1985. Genetics, cytogenetics, and evolution
of Gossypium. Adv. Genet.23: 271-375.
Feschotte, C., X. Zhang, and S.R. Wessler. 2002. Miniature inverted-repeat transposable
elements and their relationship to established DNA transposons. In Mobile DNA II
(ed. N.L. Craig). ASM Press, Washington D. C.
Feuillet, C. and B. Keller. 1999. High gene density is conserved at syntenic locii of small
and large grass genomes. P. Natl. Acad. Sci. USA96: 8265-8270.
Finnegan, D.J. 1989. Eukaryotic transposable elements and genome evolution. Trends Genet.5: 103-107.
Flavell, R.B., M.D. Bennett, J.B. Smith, and D.B. Smith. 1974. Genome size and the
proportion of repeated nucleotide sequence DNA in plants. Biochem. Genet.12:
Fryxell, P.A. 1979. The natural history of the cotton tribe. Texas A&M University Press, College Station, TX.
Fryxell, P.A. 1992. A revised taxonomic interpretation of Gossypium L. (Malvaceae).
Rheedea2: 108-165.
Grandbastien, M.-A. 1998. Activation of plant retrotransposons under stress conditions.
Trends Plant Sci.3: 181-187.
Grant, D., P. Cregan, and R.C. Shoemaker. 2000. Genome organization in dicots: genome
duplication in Arabidopsis and synteny between soybean and Arabidopsis. P. Natl. Acad. Sci. USA97: 4168-4173.
Gregory, T.R. 2001. Coincidence, coevolution, or causation? DNA content, cell size, and
the C-value enigma. Biol. Rev. Camb. Philos. Soc.76: 65-101.
Hamerton, J.L. 1971. Human Cytogenetics. Academic Press, New York.
Hendrix, B and J.M. Stewart. 2005. Estimation of the nuclear DNA content of
Gossypium species. Ann Bot-London95: 789-797.
Hirochika, H., K. Sugimoto, Y. Otsuki, and M. Kanda. 1996. Retrotransposons of rice
involved in mutations induced by tissue culture. P. Natl. Acad. Sci. USA93:
7783-7788.
Jiang, N. and S.R. Wessler. 2001. Insertion preference of maize and rice miniature
inverted repeat transposable elements as revealed by the analysis of nested
Johns, M.A., J. Mottinger, and M. Freeling. 1985. A low copy number, copia-like
transposon in maize. EMBO J4: 1093-1102.
Jones, R.N. and L.M. Brown. 1976. Chromosome evolution and DNA variation in
Crepsis. Heredity36.
Kalendar, R., J. Tanskanen, S. Immonen, E. Nevo, and A.H. Schulman. 2000. Genome
evolution in wild barley (Hordeum spontaneum) by BARE-1 retrotransposon dynamics in response to sharp microclimatic divergence. P. Natl. Acad. Sci. USA
97: 6603-6607.
Kidwell, M.G. 2002. Transposable elements and the evolution of genome size in
eukaryotes. Genetica115: 49-63.
Kirik, A., S. Salomon, and H. Puchta. 2000. Species-specific double-strand break repair
and genome evolution in plants. EMBO J19: 5562-5566.
Ku, H.-M., T. Vision, J. Liu, and S.D. Tanksley. 2000. Comparing sequenced segments
of the tomato and Arabidopsis genomes: large-scale duplication followed by selective gene loss creates a network of synteny. P. Natl. Acad. Sci. USA97:
9121-9126.
Kumar, A. and J.L. Bennetzen. 1999. Plant Retrotransposons. Ann. Rev. Genet. 33: 479-532.
Kunze, K., H. Saedler, and W.E. Lonnig. 1997. Plant transposable elements. Adv. Bot. Res.27: 331-470.
Laurie, D.A. and M.D. Bennett. 1989. The timing of chromosome elimination in
Leitch, I.J. and M.D. Bennett. 1997. Polyploidy in angiosperms. Trends Plant Sci. 2: 470-476.
Leitch, I.J., M.W. Chase, and M.D. Bennett. 1998. Phylogenetic analysis of DNA
C-values provides evidence for a small ancestral genome size in flowering plants.
Ann. Bot-London (Suppl. A)82: 85-94.
Li, W.-H. 1997. Molecular Evolution. Sinauer Associates, Inc., Sunderland, MA.
Li, W.-H. and D. Graur. 1991. Fundamentals of Molecular Evolution. Sinauer Associates, Sunderland, MA.
Lindsley, D.L. and et al. 1972. Segmental aneuploidy and the genetic gross structure of
the Drosophila genome. Genetics11: 157-184.
Ma, J., and J.L. Bennetzen. 2004. Rapid recent growth and divergence of rice nuclear
genomes. P. Natl. Acad. Sci. USA. 101: 12404-12410.
McClintock, B. 1949. Mutable loci in maize. In Annual Report of the Director of the Department of Genetics, Carnegie Institution of Washington, Year Book No. 48, pp. 142-154.
Meyers, B.C., S.V. Tingey, and M. Morgante. 2001. Abundance, distribution, and
transcriptional activity of repetitive elements in the maize genome. Genome Res.
11: 1660-1676.
Neafsey, D.E. and S.R. Palumbi. 2003. Genome size evolution in pufferfish: A
Nei, M. 1969. Gene duplication and nucleotide substitution in evolution. Nature221: 40-42.
Pebusque, M.-J., F. Coulier, D. Birnbaum, and P. Pontarotti. 1998. Ancient large-scale
genome duplications: phylogenetic and linkage analyses shed light on chordate
genome evolution. Mol. Biol. Evol.15: 1145-1159.
Petrov, D.A. 2002. DNA loss and evolution of genome size in Drosophila. Genetica115:
81-91.
Petrov, D.A. and D.L. Hartl. 1997. Trash DNA is what gets thrown away: high rate of
DNA loss in Drosophila. Gene205: 279-289.
Petrov, D.A., E.R. Lozovskaya, and D.L. Hartl. 1996. High intrinsic rate of DNA loss in
Drosophila. Nature384: 346-349.
Petrov, D.A., T.A. Sangster, J.S. Johnston, D.L. Hartl, and K.L. Shaw. 2000. Evidence
for DNA loss as a deteminant of genome size. Science287: 1060-1062.
Piegu, B., R. Buyot, A. Picault, A. Saniyal, H.R. Kim, K. Collura, D.S. Brar, S.A.
Jackson, R.A. Wing, and O. Panaud. 2006. Doubling genome size without
polyploidization: dynamics of retrotransposition-driven genomic expansions in
Oryza australiensis, a wild relative of rice. Genome Res.16: 1262-1269.
Pouteau, S., M.A. Grandbastien, and M. Boccara. 1994. Microbial elicitors of plant
defense response activate transcription of a retrotransposon. Plant J.5: 535-542.
Riera-Lizarazu, O., H.W. Rines, and R.L. Phillips. 1996. Cytological and molecular
characterization of oat x maize partial hybrids. Theor. Appl. Genet.93: 123-135.
Salomon, S. and H. Puchta. 1998. Capture of genomic and T-DNA sequences during
double-strand break repair in somatic plant cells. EMBO J17: 6086-6095.
SanMiguel, P. and J.L. Bennetzen. 1998. Evidence that recent increase in maize genome
size was caused by the massive amplification of intergene retrotransposons. Ann. Bot-London82: 37-44.
SanMiguel, P., B.S. Gaut, A. Tikhonov, Y. Nakajima, and J.L. Bennetzen. 1998. The
paleontology of intergene retrotransposons in maize. Nat. Genet.20: 43-45.
SanMiguel, P., A. Tikhonov, Y.K. Jin, N. Motchoulskaia, D. Zakharov, A.
Melake-Berhan, P.S. Springer, K.J. Edwards, M. Lee, Z. Avramova, and J.L. Bennetzen.
1996. Nested retrotransposons in the intergenic regions of the maize genome.
Science274: 765-768.
Schlueter, J.A., P. Dixon, C. Granger, D. Grant, L. Clark, J.J. Doyle, and R.C.
Shoemaker. 2004. Mining EST databases to resolve evolutionary events in major
crop species. Genome47: 868-876.
Seelanan, T., A. Schnabel, and J.F. Wendel. 1997. Congruence and consensus in the
cotton tribe.Syst. Bot. 22: 259-290.
Shepherd, N.S., Z. Schwarz-Sommer, J. Blumberg vel Spalve, M. Gupta, U. Wienand,
Shirasu, K., A.H. Schulman, T. Lahaye, and P. Schulze-Lefert. 2000. A contiguous 66-kb
barley DNA sequence provides evidence for reversible genome expansion.
Genome Res.10: 908-915.
Smith, N.G.C., R. Knight, and L.D. Hurst. 1999. Vertebrate genome evolution: a slow
shuffle or a big bang? BioEssays21: 697-703.
Tarchini, R., P. Biddle, R. Wineland, S. Tingey, and A. Rafalski. 2000. The complete
sequence of 340 kb of DNA around the rice Adh1-Adh2 region reveals interrupted colinearity with maize chromosome 4. Plant Cell12: 381-391.
The Rice Chromosomes 11 and 12 Sequencing Consortia. 2005. The sequence of rice
chromosomes 11 and 12, rich in disease resistance genes and recent gene
duplications. BMC Biol. 3:20 doi:10.1186/1741-7007-3-20.
Tikhonov, A., P. SanMiguel, Y. Nakajima, N.M. Gorenstein, J.L. Bennetzen, and Z.
Avramova. 1999. Colinearity and its exceptions in orthologous adh regions of maize and sorghum. P. Natl. Acad. Sci. USA96: 7409-7414.
Tu, Z. 2001. Eight novel families of miniature inverted repeat transposable elements in
the African malaria mosquito, Anopheles gambiae. P. Natl. Acad. Sci. USA98:
1699-1704.
Vicient, C.M., A. Suoniemi, K. Anamthawat-Jonsson, J. Tanskanen, A. Beharav, E.
Nevo, and A. Schulman. 1999. Retrotransposon BARE-1 and its role in genome evolution in the genus Hordeum. Plant Cell11: 1769-1784.
Vision, T.J., D.G. Brown, and S.D. Tanksley. 2000. The origins of genomic duplications
Wang, X., S. Shi, B. Hao, S. Ge, and J. Luo. 2005. Duplication and DNA segmental loss
in the rice genome: implications for diploidization. New Phytol.165: 937-946.
Wendel, J.F. 2000. Genome evolution in polyploids. Plant Mol. Bio.42: 225-249.
Wendel, J.F. and R.C. Cronn. 2002. Polyploidy and the evolutionary history of cotton.
Adv. Agron.79: 139-186.
Wendel, J.F., R.C. Cronn, J.S. Johnston, and H.J. Price. 2002. Feast and famine in plant
genomes. Genetica115: 37-47.
Wendel, J.F., R.L. Small, R.C. Cronn, and C.L. Brubaker. 1999. Genes, jeans, and
genomes: Reconstructing the history of cotton. In Plant evolution in man-made habitats. Proceedings of the VIIth international symposium of the international organization of plant biosystematists (ed. J.C.M. den Nijs), pp. 133-161. Hugo de Vries Laboratory, Amsterdam.
Wessler, S.R., T.E. Bureau, and S.E. White. 1995. LTR-retrotransposons and MITEs:
important players in the evolution of plant genomes. Curr. Opin. Genet. Dev.5:
814-821.
Wicker, T., N. Stein, L. Albar, C. Feuillet, E. Schlagenhauf, and B. Keller. 2001.
Analysis of a contiguous 211 kb sequence in diploid wheat (Triticum
monococcum L.) reveals multiple mechanisms of genome evolution. Plant J.26:
307-316.
Wolfe, K.H. and D.C. Shields. 1997. Molecular evidence for an ancient duplication of the
Yang, G. and T.C. Hall. 2003. MDM-1 and MDM-2: two mutator-derived MITE families in rice. J. Mol. Evol.56: 255-264.
Zhang, Q., J. Arbuckle, and S.R. Wessler. 2000. Recent, extensive, and preferential
insertion of members of the miniature inverted-repeat transposable element family
CHAPTER THREE
Differential lineage-specific amplification of transposable elements is responsible for
genome size variation in Gossypium
A paper published in the journal Genome Research1
Jennifer S Hawkins2, HyeRan Kim3, John D Nason4, Rod A Wing5,
and Jonathan F Wendel6
Abstract
The DNA content of eukaryotic nuclei (C-value) varies approximately
200,000-fold, but there is only an approximate 20-fold variation in the number of protein coding
genes. Hence, most C-value variation is ascribed to the repetitive fraction, although little
is known about the evolutionary dynamics of the specific components that lead to
genome size variation. To understand the modes and mechanisms that underlie variation
in genome composition, we generated sequence data from whole genome shotgun (WGS)
libraries for three representative diploid (n =13) members of Gossypium that vary in
genome size from 880 to 2460 Mb (1C) and from a phylogenetic outgroup, Gossypioides
kirkii, with an estimated genome size of 588 Mb. Copy number estimates including all dispersed repetitive sequences indicate that 40-65% of each genome is composed of
transposable elements. Inspection of individual sequence types revealed differential,
1 Reprinted with permission of Genome Research, 2006, 16(10), 1252-1261. 2 Graduate student, primary researcher and author, EEOB department, Iowa State
University.
3 Graduate student, GSS library construction, Arizona Genomics Institute, University of
Arizona.
4 Xxx professor, derivation of statistical equations for sampling effort and copy number
estimation, EEOB department, Iowa State University.
5 Xxx professor, GSS library constructions, Arizona Genomics Institute, University of
Arizona.
6 Principal investigator and corresponding author, EEOB department, Iowa State
lineage-specific expansion of various families of transposable elements among the
different plant lineages. Copia-like retrotransposable element sequences have differentially accumulated in the Gossypium species with the smallest genome, G. raimondii, while gypsy-like sequences have proliferated in the lineages with larger genomes. Phylogenetic analyses demonstrated a pattern of lineage-specific amplification
of particular subfamilies of retrotransposons within each species studied. One particular
group of gypsy-like retrotransposon sequences, Gorge3 (Gossypium retrotransposable
gypsy-like element), appears to have undergone a massive proliferation in two plant lineages, accounting for a major fraction of genome-size change. Like maize, Gossypium
has undergone a 3-fold increase in genome size due to the accumulation of LTR
retrotransposons over the 5-10 my since its origin.
The sequence data described in this paper have been submitted to the GSS
Division of GenBank under accessions DX390732 - DX406528.
Introduction
Genomes of eukaryotic organisms vary over 200,000-fold in size, ranging from
2.8 Mb in Encephalitozoon cuniculi (Biderre et al. 1998) to over 690,000 Mb in the diatom Navicolapelliculosa (Cavalier-Smith 1985; Li and Graur 1991). Among angiosperms, genome sizes range from approximately 108 Mb for Fragaria viridis
(Bennett and Leitch 2005) to over 120,000 Mb in some members of the Liliaceae
(Bennett and Leitch 1995; Bennett and Leitch 1997; Bennett and Smith 1991; Flavell et
al. 1974; Leitch et al. 1998). Not only is wide variation in genome size common among
distantly related organisms, but it also is unexceptional even among closely related
species. For example, genome sizes range approximately 6-fold among members of the
genus Vicia (Chooi 1971), and 9-fold within the genus Crepsis (Jones and Brown 1976). Some portion of this genome size variation may be ascribed to differences in gene
number amplification due to gene, chromosome segment, and whole-genome duplication,
as well as to gene loss (Bancroft 2001; Bennetzen and Ramakrishna 2002; Blanc et al.
2000). Nevertheless, greater than 90% of plant genes possess close homologs within
other plant species, indicative of highly conserved gene content (Bennetzen 2000a).
There appears to be no correlation between the amount of DNA per cell and
organismal advancement or genetic complexity (Price 1988; Sparrow et al. 1972). This
well-documented lack of correspondence between genome size and morphological or
physiological complexity of an organism has been historically termed the "C-value
paradox" (Thomas 1971). Since the discovery of non-coding DNA and its impact on
genome size variation, "paradox" has been replaced by "enigma" in an attempt to more
appropriately identify the topic as a "perplexing subject" made up of several independent
components (Gregory 2002; Gregory 2004). It is now generally agreed that the C-value
enigma can be largely explained by the differential amplification and proliferation among
organisms of the repetitive fraction of the genome (Bennetzen 2000b; Bennetzen 2002;
Kidwell 2002).
In plants, amplification and insertion of newly activated long terminal repeat
(LTR) retrotransposable elements appears to be a major contributor to genome size
expansion. For example, approximately 70% of the maize nuclear genome is composed
of LTR-retrotransposons (SanMiguel and Bennetzen 1998). In the span of just a few
million years, the maize genome doubled in size due to transposable element activity
(SanMiguel and Bennetzen 1998). These transposable elements are often found in nested
arrangements located between "gene islands", and often are associated with centromeres
(SanMiguel et al. 1996). To date, little is known regarding the extent to which various
transposable elements contribute to genome size variation or how transposable element
(TE) types are distributed among closely related species. Other mechanisms posited to be
responsible for genome size expansion include variation in intron size (Deutsch and Long
1999), expansion of tandemly repetitive DNA sequences (Ellegren 2002; Morgante et al.
2002), segmental duplication (Bancroft 2001; Blanc et al. 2000; Ku et al. 2000; Vision et
al. 2000; Wendel 2000), accumulation of pseudogenes (Zhang 2003), and transfer of
organellar DNA to the nucleus (Adams and Palmer 2003; Shahmuradov et al. 2003).
However, these mechanisms generally do not appear to have a large impact on genome
Although it has been suggested that organisms may have a "one-way ticket to
genomic obesity" (Bennetzen and Kellogg 1997), it is possible that differences in genome
size are not only the outcome of an organism's tolerance for accrual of non-genic DNA,
but also its efficiency in removal of non-essential DNA (Petrov 2002a; Petrov and Hartl
1997; Petrov et al. 2000; Wendel et al. 2002b). Many organisms with smaller genomes
are striking in their relatively small proportion of non-genic DNA. Evidence of a
deletional bias among organisms with smaller versus larger genomes (Bennett and Leitch
1997; Kirik et al. 2000; Petrov and Hartl 1997; Petrov et al. 2000) has led to the
"mutational equilibrium model" of DNA loss (Petrov 2002b). Other suggested
mechanisms of DNA loss include unequal intrastrand homologous recombination
between two tandem repeats in the same orientation, such as the LTRs of
retrotransposable elements (Bennetzen 2002; Chen et al. 1998; SanMiguel et al. 1996;
Shepherd et al. 1984; Vicient et al. 1999), illegitimate recombination (Bennetzen et al.
2005; Devos et al. 2002; Ma et al. 2004; Wicker et al. 2003) and double-stranded break
repair (Filkowski et al. 2004; Kirik et al. 2000; Orel and Puchta 2003).
To effectively study genome size evolution from a phylogenetic perspective, it is
necessary to exploit a system in which the closely related species vary widely in genome
size and for whom phylogenetic relationships are well understood. A good example in
this respect is the monophyletic genus Gossypium (Malvaceae), which is composed of approximately 50 species of small trees and shrubs with an aggregate distribution that
encompasses many tropical and subtropical semi-arid regions of the world (Cronn et al.
2002; Fryxell 1992; Seelanan et al. 1997; Wendel and Cronn 2003). Diploid members of
the genus are divided into eight groups based on chromosome pairing behavior and
fertility in interspecific hybrids (Beasley 1941; Endrizzi et al. 1985). All diploid
members of the genus have 13 chromosomes, yet genome sizes range approximately
threefold, from a median estimate of 885 Mb per haploid nucleus in the American
D-genome species, to 2572 Mb per haploid nucleus in the Australian K-D-genome species
(Figure 1) (Hendrix and Stewart 2005). An even larger range in genome size is observed
in the tribe to which Gossypium belongs (the Gossypieae), from only 590 Mb in
et al. 2002b). The wide range in genome size observed across closely related diploid
species and the well-established phylogeny makes Gossypium an excellent system for the study of genome size evolution.
To better appreciate the relevance of genome size variation to organismal fitness
and evolution, it is first necessary to enhance our understanding of the quantity and
quality of the genomic components that distinguish two or more genomes, as well as the
modes and mechanisms by which these differences arise. This insight may derive from
comparative sequence analysis of specific genomic regions or from using more global
approaches. An example of the former is the recent study by Grover et al. (Grover et al.
2004), who compared approximately 104 kb of aligned sequence surrounding the CesA1
gene from the D- and A- genomes of tetraploid cotton. In this case both gene content and
intergenic regions were largely conserved, and hence there was no evidence of the
mechanisms responsible for the twofold size variation that characterizes these genomes.
Here we employ the second approach, utilizing whole genome shotgun (WGS) libraries
constructed for three members of Gossypium that range threefold in genome size, and one outgroup species, Gossypioidies kirkii. Copy number estimates for several Gossypium
transposable elements suggest that different types of repetitive sequences have
accumulated at different rates in different plant lineages. Additionally, the results suggest
that different families within a repetitive sequence type proliferate differentially. Indeed,
the major fraction of the genome size variation observed in Gossypium is largely due to recent, lineage-specific amplification of one particular group of gypsy-like
retrotransposon sequences, Gorge3 (Gossypium retrotransposable gypsy-like element), within the larger-genome Gossypium species.
Methods
Construction and Sequencing of WGS libraries
WGS libraries were constructed according to Meyers et al. (Meyers et al. 2001)
with minor modifications and sequenced at the Arizona Genomics Institute, University of
Arizona. Briefly, total genomic DNA extracted from young leaves of a single individual
automated hydrodynamic point-sink based DNA shearing device (Oefner el al. 1996), at
speed code 13 for 25 cycles at room temperature to obtain fragments from G. herbaceum
(JMS), G. raimondii (JFW stock), G. exiguum (Gos 5184), and G. kirkii (JFW stock) (Fig. 1). Sheared fragments between 2500 and 6000 bp were excised and converted to
bunt-ended DNA fragments using the "End-it" DNA end repair kit (Epicentre) containing
T4 DNA polymerase (for 5' → 3' polymerase and 3' → 5' exonuclease activities) and T4
Polynucleotide Kinase (for phosphorylation of 5' -ends of blunt DNA), followed by
ligation into pBluescriptII KS+ (Strategene) and electroporation into E. coli strain
DH10B T1 phase resistant electrocompetent cells (Invitrogen). WGS library clones were
sequenced from one direction using the T7 primer (5’ TAA TAC GAC TCA CTA TAG GG 3’) and BigDye Terminator v3.1 (Applied Biosystems, ABI) according to
manufacturer’s instruction. Cycle sequencing was performed using PTC-200 thermal
cyclers (MJ Research, Waltham, MA) in a 384-well format with the following regime: 35
cycles of 30 sec at 96C, 20 sec at 50C, and 4 min at 60C. After the cycle-sequencing
step, the DNA was purified by ethanol precipitation.
Samples were eluted into 20 ul of water and separated using ABI 3730xl DNA
sequencers (ABI, USA). Sequence data was collected and extracted using sequence
analysis software (ABI, USA). The sequencing data was base-called using the program
Phred (Ewing et al. 1998). Vector and low quality sequences were removed by the
program Lucy (Chou and Holmes 2001) and then submitted to the GSS division of
GenBank under accessions DX390732 - DX406528.
Analytical framework
The number of sequences needed to generate 95% confidence that at least one
member of a given class of sequences will be sampled was determined for each species
using the following equation:
where N.95 is the sampling effort required to be 95% confident that at least one target
sequence will be sampled, n is the number of targets present in the genome, l is the length
of the target sequence, m is the estimated minimum length required to identify the
sequence in a BLAST search, e is the number of base pairs sequenced from each insert,
and G is genome size. By using this equation we were able to estimate the sampling
intensity needed to detect at least one repetitive sequence of an estimated length and copy
number in each of the four genomes. Published data for diverse types of repetitive
elements, such as Ty3-gypsy, Ty1-copia, LINE retroposons, SINEs, and MITEs of various estimated lengths (l) and copy numbers (n) were used to calculate N.95 in order to
determine how many clones should be sequenced from each library. The value for m was
conservatively estimated at m=200 bp, which in a BLASTX analysis would equal
sequence similarity over 66 or more amino acids. We estimated e to be 700 bp, based on
the average high-quality sequencing read length reported from the Arizona Genomics Institute. Based on these estimates, libraries were constructed that contain 1.5% (based on ~5 kb plasmid insert length) of the genome from each species. One pass sequencing
from one end of the insert (e ~ 700 bp) was performed, which, when totaled across the
number of clones sequenced, yielded sequence data for approximately 0.2% of each
haploid genome (Table 1).
Data analysis and copy number estimation
Because of rapid sequence divergence of repetitive DNA and the limited database
of repetitive sequences available in GenBank for plants closely related to Gossypium, sequences from the WGS libraries were subjected to BLASTX (amino acid) in addition
to BLASTN (nucleotide) analyses at the NCBI web site. Hits of e-5 or better were
retained for further analysis. In addition, libraries were queried against themselves in an
attempt to identify families of repetitive elements not recognized in the initial search. In
this self-BLAST analysis, sequences with greater than 80% identity over 100 bp were
considered related. Clones were assigned to a general category according to their best
BLAST hit. These general categories were 1) nuclear, 2) chloroplast, 3) mitochondrial,
Plant transposable elements are broadly divided into 3 main lineages: the
"Transposons" consisting of the Class II DNA elements, the "Retrotransposons"
containing the LTR Class I elements, and the "Retroposons" consisting of the non-LTR
Class I elements (Eickbush and Malik 2002). Class I elements transpose via a duplicative
mechanism, in which an RNA intermediate formed from the parental copy is reverse
transcribed, and the newly translated copies are inserted into new positions in the
genome. Class I LTR retrotransposons are subdivided into two classes, gypsy and copia -like, based on the position of the integrase coding domain. The non-LTR retroposons
consist of autonomous Long Interspersed Nuclear Elements (LINEs) and the
non-autonomous Small Interspersed Nuclear Elements (SINEs). Class II DNA elements
transpose via a cut-and-paste mechanism in which the element is excised and inserted
into a new area of the genome. DNA elements characteristically contain terminal
inverted repeats (TIR) ranging from 11 to a few hundred base pairs in length, and
families of elements are defined by these TIR sequences (Bennetzen 2000b). Class II
transposons can be divided into three main superfamilies: hAT (hobo from Drosophila,
Activator of maize, and Tam from Snapdragon), Mutator and En/Spm, both first
described in maize (Kidwell 2002). Therefore, dispersed repetitive sequences recovered
from the WGS libraries were placed into the specific categories 1) gypsy-like, 2) copia -like, 3) LINE--like, 4) hAT-like, 5) En/Spm-like, and 6) Mutator-like. DNA sequence alignments were performed with published sequences of the same type to confirm
sequence identity.
Tandem repeats were identified using the program Tandem Repeat Finder
(Benson 1999). Searches were performed using the default settings. Any tandem repeat
present in more than three clones with a score greater than 500 were retained for further
analysis. These sequences were queried against GenBank using BLASTN to search for
sequence similarity to known sequences deposited in GenBank. Sequences were queried
against one another to identify sequences that were shared among the libraries.
Copy numbers (n) for various repetitive elements recovered from the WGS