International Journal of Innovative Technology and Exploring Engineering (IJITEE) ISSN: 2278-3075,Volume-8 Issue-12, October 2019
Dengue cases has become endemic in Malaysia. The cost of operation to exterminate mosquito habitats are also high. To do effective operation, information from community are crucial. But, without knowing the characteristic of Aedes larvae it is hard to recognize the larvae without guide from the expert. The use of deep learning in image classification and recognition is crucial to tackle this problem. The purpose of this project is to conduct a study of characteristics of Aedes larvae and determine the best convolutional neural network model in classifying the mosquito larvae. 3 performance evaluation vector which is accuracy, log-loss and AUC-ROC will be used to measure the model’s individual performance. Then performance category which consist of Accuracy Score, Loss Score, File Size Score and Training Time Score will be used to evaluate which model is the best to be implemented into web application or mobile application. From the score collected for each model, ResNet50 has proved to be the best model in classifying the mosquito larvae species.
Keywords: Aedes, dengue, convolution neural network, deep learning, performance vector, performance category.
I. INTRODUCTION
Rrecently several diseases such as Dengue fever, Chikugunya, Malaria and Zika which are transmitted through mosquito as their vectors are causing serious problems in human health. These diseases are mostly transmitted by mosquito genus Aedes, especially species Aedes Aegypti [1]. To combat this problem, various method was implemented by the local government to control the mosquito outbreak but to no avail. One of the reasons is due to lack of effective mosquito control in areas where dengue is endemic [2]. Although there was the method of fogging which is a large-scale extermination of mosquito habitat but the cost to operate this is quite high and inefficient as dengue cases must appear in that area before the operation will be executed.
Deep learning is one of the branches in machine learning where we create a model to train our data and do some
Revised Manuscript Received on September 05, 2019.
Siti Azirah Asmai, Faculty of Information and Communication Technology, Universiti Teknikal Malaysia Melaka, Hang Tuah Jaya, 76100 Durian Tunggal, Melaka, Malaysia. Email: [email protected].
Mohamad Nurallik Daniel Mohamad Zukhairin, Faculty of Information and Communication Technology, Universiti Teknikal Malaysia Melaka, Hang Tuah Jaya, 76100 Durian Tunggal, Melaka, Malaysia. Email: [email protected].
Abdul Syukor Mohamad Jaya, Faculty of Information and Communication Technology, Universiti Teknikal Malaysia Melaka, Hang Tuah Jaya, 76100 Durian Tunggal, Melaka, Malaysia. Email: [email protected].
Ahmad Fadzli Nizam Abdul Rahman, Faculty of Information and Communication Technology, Universiti Teknikal Malaysia Melaka, Hang Tuah Jaya, 76100 Durian Tunggal, Melaka, Malaysia. Email: [email protected].
Zuraida Binti Abal Abas, Faculty of Information and Communication Technology, Universiti Teknikal Malaysia Melaka, Hang Tuah Jaya, 76100
Durian Tunggal, Melaka, Malaysia. Email: [email protected].
analysis, prediction or others that are suitable. The deep learning architecture has allowed a computational model that were composed of multiple processing layers to learn representations of data with multiple levels of abstraction [3]. Deep learning or artificial neural network (ANN) was modelled after human brain neural network where there are at least 3 layers of nodes. The first layer is the input layer where the data enter the neural network. Second layer usually consist of hidden nodes to do the processing of data[4]. The third layer is the output layer where output of the process is produced [5].
In deep learning there are few models that has been created using the deep learning architecture that is Convolutional Neural Network, Recurrent Neural Network and Recursive Neural Network [6], [7], [8]. In the field of image recognition and classification, CNN has created a good performance in the last decade in large scale [11] – [14]. Especially with the sprouting of image recognition competition such as ImageNet Large Scale Visual Recognition Challenge, Low Power Image Recognition Challenge and many more [17], [22]. The advancement of deep visual recognition architecture has been largely played by the ImageNet Large Scale Visual Recognition Challenge (ILSVRC) which act as the testbed for a few generations of large-scale image classification systems [13], [22]. With image recognition model, a computer can easily identify the object using visual from camera or images.
II. RELATEDWORK
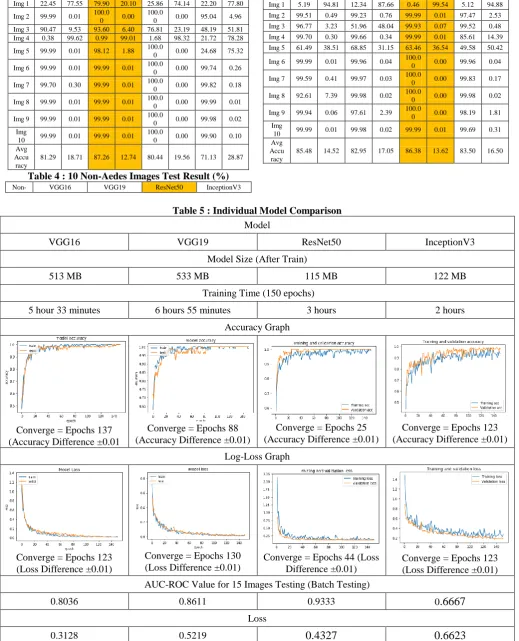
[image:1.595.342.520.567.678.2]The project by Sanchez-Ortiz et al [1] proposed using CNN to classify mosquito larvae species into Aedes and Others. The paper proposed to classify the larvae species by the larvae 8th segment where they can observe a comb-like figure as shown in Figure 1.
Figure 1: Classes of larva based on 8th segment [14]
The paper proposed a rather simple methods in their project that is data acquisition, image pre-processing, training the CNN and real-time classification [1]. The result from the classification is the system is capable to recognize the larvae of Aedes mosquitos with an accuracy of approximately 96.88% in average while for
Others is 64.95%.
Mosquito Larvae Detection using Deep Learning
III. CONVOLUTIONALNEURALNETWORK
Deep learning is a subfield of machine learning methods based on artificial neural network. This learning can be supervised, unsupervised or semi-supervised [15]. Convolution Neural Network (CNN) is a class of deep learning which is commonly applied to analysing visual imagery. It was inspired by biological processes where connectivity pattern between neurons are resembling the animal visual cortex [23]. Basically, CNN perceive the images the same as brain process visual that is in 3-dimensional.
CNN are widely used architecture in detecting, recognizing, or classifying images. The most popular CNN for object detection and object category classification from images are AlexNet, GoogLeNet, and ResNet50 [6]. CNN constitute many classes of models such as generic object recognition, convolutional deep belief network, handwritten digit recognition and many more related to images [9], [16], [19]. CNN learns the filters that in traditional image processing algorithm which make it independence from prior knowledge and human effort in feature design.
CNN has many applications in the field of computer learning, which is image and video recognition, recommender system, image classification, medical image analysis and natural language processing [9], [10], [20].
A. VGG16
VGG16 is a CNN model that was proposed by K. Simonyan and A. Zisserman from the University of Oxford. It was one of the famous models that was submitted to ILSVRC-2014 which has achieved 92.7% top-5 accuracy test in ImageNet which has a dataset of over 14 million images that belong to 1000 classes [13].
B. VGG19
VGG19 is a CNN model which was also proposed by K. Simonyan and A. Zisserman from the University of Oxford to compete in ILSVR-2014 along with VGG16. The differences of VGG16 and VGG19 is only on their number of weight layers which is 16 layers for VGG16 and 19 layers for VGG19. VGG19 also has achieved results of Top-5 Error Rate with value of 9.0% [13].
C. InceptionV3
InceptionV1 or GoogLeNet was developed by Google to compete in ILSVRC 2014 and become the winner. It achieved a top-5 error rate of 6.67% which was very close to human level performance. The network used the architecture of LeNet but implemented a novel element which is the inception module. It used batch normalization, image distortions and RMSprop in the architecture.
This architecture allows for increasing the number of units at each stage significantly without an uncontrolled blow-up in computational complexity [21]. The inception architecture is based on finding out how an optimal local sparse structure in a convolutional vision network can be approximated and covered by readily available dense components [21]. InceptionV3 is an upgrade of InceptionV1 architecture where there is an addition of batch normalization of InceptionV2 and additional factorization ideas in third iteration of InceptionV3 [21].
D. ResNet50
ResNet50 is a 50 layers Residual Network where Residual Network is a type of residual learning where its purposes are to solve the difficulty of network training and saturating of network accuracy. It is explicitly letting these layers fit a residual mapping. Formally, we let the stacked nonlinear layers fit another mapping of F(x):= H(x)−x where H(x) is the desired underlying mapping. The original mapping is recast into F(x)+x. It is hypothesized that it is easier to optimize the residual mapping than to optimize the original, unreferenced mapping. If an identity mapping were optimal, it would be easier to push the residual to zero than to fit an identity mapping by a stack of nonlinear layers [18].
IV. METHODOLOGY
The methodology used in this project is as follow. First, we acquire the dataset to train the models. Then, we pre-processed the acquired dataset to perform the functionality of data mining and train the model. Then, the classification task will be performed using the 4 selected models; VGG16, VGG19, InceptionV3 and ResNet50. The individual model will be evaluated using performance vector; Accuracy, Log-Loss and AUC-ROC graph and using this performance vector each model will be scored using the Performance Category Score; Accuracy Score, Loss Score, File Size Score, and Training Time Score. This scoring is using tournament rule where we rank the Performance Category of each model.
A. Data Collection
The data collected was from various image collection platform such as Flickr.com and Shutterstock.com while some of the images are captured in Pusat Kesihatan Melaka Tengah using live Aedes larvae sample.
B. Data Pre-Processing
The acquired data will be separated into different folders named ‘test_set’, ‘training_set’ and ‘validation_set’. Each folder set has 2 subfolders called Aedes and Non-Aedes
containing their respective images. All the data will be standardized by converting the size to 244×244×3 for all images with RGB color channel.Data augmentation will be applied to the images before being fed to the model. The augmentation technique is very important to increase the training dataset as each augmented image has 20 random orientations of images.
C. CNN Model Training
During this step, the log-loss, training time and model file size after training will be recorded for score evaluation using Performance Category.
D. Classification using Selected Model
In this step, the trained model will be tested using ‘testing_set’ and validated using ‘validation_set’.
The accuracy of 15 random images of Aedes and
International Journal of Innovative Technology and Exploring Engineering (IJITEE) ISSN: 2278-3075,Volume-8 Issue-12, October 2019
The model needed to be fine-tuned before training as we currently have only very small dataset with low computational power and the augmentation technique was not enough as to avoid the overfitting problem.
To fine-tuned VGG16 and VGG19, all the layers except for the last 4 layers will be freeze (untrainable) as the initial layers learned the general features.
To fine-tuned ResNet50, I freeze all the layers except the fully connected SoftMax layers in the last layers.
For fine-tuning InceptionV3, all convolutional
InceptionV3 layer will be trained except for top layers.
E. Model Performance Evaluation Vector Scoring
The performance evaluation vector was used to measure the performance of each individual models in terms of classifying the mosquito larvae. Three elements that was used are accuracy, log loss and the value of AUC-ROC where all these results derived from the graph. Description is shown in Table 1.
Table 1:Performance Evaluation Vector
Performance
Evaluation Vector Description
Accuracy
Epochs in which prediction accuracy and validation accuracy differences is ±0.01.
Log Loss Epochs in which prediction loss and validation loss differences is ±0.01
AUC-ROC Value of AUC-ROC of tested model
F. Tournament Selection using Performance Category Using the recorded result of Performance Vector of each model, the models Performance Category (Accuracy Score, Loss Score, File Size Score and Training Time Score) will be ranked between 1 (the best) and 4 (the worst) for each model. Table 2 shows the description for Performance Category. The scoring for each model based on the Performance Category will be added as shown in (1) and the best model has the lowest ∑Score among them.
∑Score=score(a)+score(l)+score(f)+score(t) (1)
Where, a = Accuracy
l = loss
f = file size
[image:3.595.39.297.525.722.2]t = training time
Table 2:Performance Category
Performance Category Description
Accuracy, a
Average classification accuracy of 10 images testing,
+ + + +
Loss, l Average Loss
File Size, f Size of trained model in Megabyte
Training Time, t
Time taken to train the model in hour and minute
V. RESULTSANDDISCUSSION
The result will be divided into few parts. The first one is the individual model comparison which compare the model’s individual accuracy, loss, and AUC-ROC. Next will be the
result for 20 images testing (10 images of Aedes class and 10 images of Non-Aedes class). The last part is the scoring result to evaluate which model is the best to be implemented into web or mobile application.
A. Individual Model Comparison
Each model will be evaluated according to accuracy graph, log loss graph, the value of AUC-ROC and loss during training. The training dataset was imported into the system and the training result will be analysed. Their individual performance will be evaluated using the performance evaluation vector.
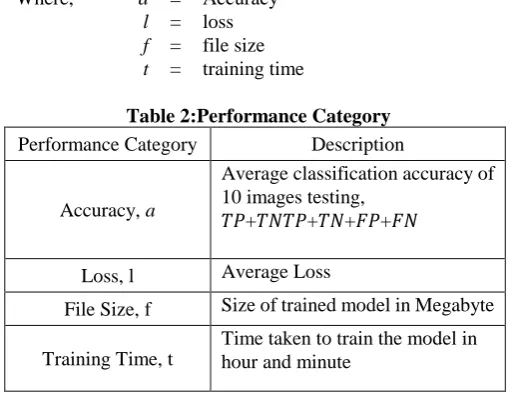
From the results in Table 5, in terms of log-loss during training VGG16 yield the best results compared to other models where the loss is 0.3128 which is lower than other models. ResNet50 has the highest value of AUC-ROC compared to VGG16, VGG19, and InceptionV3. The high value of AUC-ROC indicates its capability to perform better for classification task. In terms of high accuracy achieved per epoch, ResNet50 performs the best as it achieved high training and validation accuracy in less than 40 epochs.
B. 20 Images Testing Results
Table 3 record the confidence of classification in classifying 10 images of Aedes larva while Table 4 record the confidence of classifying 10 images of Non-Aedes class. According to the result in Table 4, VGG19 has the highest average accuracy with 87.26% for classifying Aedes larvae followed by VGG16 at 81.29% accuracy. As shown in the Table 5 ResNet50 has the highest accuracy in classifying non-Aedes class with 86.38% classification confidence followed by VGG16.
C. Performance Tournament Results
In Table 6, the value to be used in the performance criteria are taken from Table 3 until Table 5. To get a value, we use (2) to get the value for each model. Then we will rank their performance category from 1 until 4, from best to worst.
(2)
Where, avg Aedes(p) = Avg. accuracy
Aedes class
avg Non-Aedes(p) =
Avg. accuracy Non-Aedes class
From Table 7, we can see the respective ranking of each models according to the performance category. From Table 8 we can conclude that ResNet50 is the best model to be employed into mobile application or web application. The accuracy for this model is quite high with little loses. In terms of deployment into application its file size is still quite small compare to VGG models with training time that’s only second to InceptionV3.
Table 3 : 10 Aedes Images Test Result (%)
s Img Aede
s Non-Aede s
Aede s
Non-Aede s
Aede s
Non-Aede s
Aede s
Non-Aede s Img 1 22.45 77.55 79.90 20.10 25.86 74.14 22.20 77.80
Img 2 99.99 0.01 100.0
0 0.00
100.0
0 0.00 95.04 4.96
Img 3 90.47 9.53 93.60 6.40 76.81 23.19 48.19 51.81 Img 4 0.38 99.62 0.99 99.01 1.68 98.32 21.72 78.28
Img 5 99.99 0.01 98.12 1.88 100.0
0 0.00 24.68 75.32
Img 6 99.99 0.01 99.99 0.01 100.0
0 0.00 99.74 0.26
Img 7 99.70 0.30 99.99 0.01 100.0
0 0.00 99.82 0.18
Img 8 99.99 0.01 99.99 0.01 100.0
0 0.00 99.99 0.01
Img 9 99.99 0.01 99.99 0.01 100.0
0 0.00 99.98 0.02
Img
10 99.99 0.01 99.99 0.01 100.0
0 0.00 99.90 0.10
Avg Accu racy
[image:4.595.40.560.77.719.2]81.29 18.71 87.26 12.74 80.44 19.56 71.13 28.87
Table 4 : 10 Non-Aedes Images Test Result (%)
Non- VGG16 VGG19 ResNet50 InceptionV3
Aede s Img Aede
s Non-Aede s
Aede s
Non-Aede s
Aede s
Non-Aede s
Aede s
Non-Aede s Img 1 5.19 94.81 12.34 87.66 0.46 99.54 5.12 94.88
Img 2 99.51 0.49 99.23 0.76 99.99 0.01 97.47 2.53
Img 3 96.77 3.23 51.96 48.04 99.93 0.07 99.52 0.48
Img 4 99.70 0.30 99.66 0.34 99.99 0.01 85.61 14.39
Img 5 61.49 38.51 68.85 31.15 63.46 36.54 49.58 50.42
Img 6 99.99 0.01 99.96 0.04 100.0
0 0.00 99.96 0.04
Img 7 99.59 0.41 99.97 0.03 100.0
0 0.00 99.83 0.17
Img 8 92.61 7.39 99.98 0.02 100.0
0 0.00 99.98 0.02
Img 9 99.94 0.06 97.61 2.39 100.0
0 0.00 98.19 1.81
Img
10 99.99 0.01 99.98 0.02 99.99 0.01 99.69 0.31
Avg Accu racy
85.48 14.52 82.95 17.05 86.38 13.62 83.50 16.50
Table 5 : Individual Model Comparison
Model
VGG16 VGG19 ResNet50 InceptionV3
Model Size (After Train)
513 MB 533 MB 115 MB 122 MB
Training Time (150 epochs)
5 hour 33 minutes 6 hours 55 minutes 3 hours 2 hours
Accuracy Graph
Converge = Epochs 137 (Accuracy Difference ±0.01
Converge = Epochs 88 (Accuracy Difference ±0.01)
Converge = Epochs 25 (Accuracy Difference ±0.01)
Converge = Epochs 123 (Accuracy Difference ±0.01) Log-Loss Graph
Converge = Epochs 123 (Loss Difference ±0.01)
Converge = Epochs 130 (Loss Difference ±0.01)
Converge = Epochs 44 (Loss Difference ±0.01)
Converge = Epochs 123 (Loss Difference ±0.01) AUC-ROC Value for 15 Images Testing (Batch Testing)
0.8036 0.8611 0.9333 0
.6667
Loss
International Journal of Innovative Technology and Exploring Engineering (IJITEE) ISSN: 2278-3075,Volume-8 Issue-12, October 2019
Table 6 : Performance Category Comparison
Model Accuracy, a Loss, l File Size, f Training
Time, t
VGG16 83.3850 0.3128 513 MB 5 hours 33
minutes
VGG19 85.1050 0.5219 533 MB 6 hours 55
minutes
ResNet50 83.4100 0.4327 115 MB 3 hours
InceptionV3 77.3150 0.6623 122 MB 2 hours
Table 7 : Score of Performance Category
Model Accuracy,
a
Loss, l File Size, f
Training Time, t
VGG16 3 1 3 3
VGG19 1 3 4 4
ResNet50 2 2 1 2
InceptionV3 4 4 2 1
Table 8 : Performance Category Scoring Performance
Criteria VGG16 VGG19 ResNet50 InceptionV3
Accuracy, a 3 1 2 4
Loss, l 1 3 2 4
File Size, f 3 4 1 2
Training
Time, t 3 4 2 1
Total Score,
∑Score 10 12 7 11
VI. CONCLUSION
This study empirically evaluates the performance of four CNN models (VGG16, VGG19, ResNet50, and InceptionV3) in classifying mosquito larvae images based on their class (Aedes and Non-Aedes). From the results we can conclude that ResNet50 is the best model to be implemented into web app or mobile app. For future improvement we hope that we can improve the accuracy of each models by increasing the dataset and adding algorithm to increase the performance of models.
ACKNOWLEDGMENT
The authors would like to acknowledge, Centre for Advanced Computing Technology, Universiti Teknikal Malaysia Melaka (UTeM) for contribution to this study.
Special thanks to Melaka Tengah District Health Office for the support and expertise in gathering information to this study.
REFERENCES
1. A. Sanchez-Ortiz, A. Fierro-Radilla, A. Arista-Jalife, M.
Cedillo-Hernandez, M. Nakano-Miyatake, D. Robles-Camarillo, and V. Cuatepotzo-Jimenez. (2017). “Mosquito Larva Classification Method Based on Convolutional Neural Networks.” 2017 International Conference on Electronics, Communications and Computers (CONIELECOMP), 1–6.
2. D. J. Gubler. (1998). “Dengue & Dengue Hemorrhagic Fever.” Clinical
Microbiology Reviews 1998; 11: 480–496.
3. Y. LeCun, Y. Bengio, and G.E. Hinton. (2015). “Deep Learning.”
Nature Volume 521, 436–444.
4. S. A. Asmai, A. S. H. Basari, A. S. Shibghatullah, N. K. Ibrahim and B.
Hussin (2011). "Neural Network Prognostics Model for Industrial Equipment Maintenance.” 11th International Conference on Hybrid Intelligent Systems (HIS), Melaka, 2011, pp. 635-640.
5. Azirah, S. A., Hussin, B., & Mohd-Yusof, M. (2013). A data-driven
prognostic model for industrial equipement using time series prediction methods. J.Eng.Technol., 4, 1-12.
6. N. Sharma, V. Jain, and A. Mishra. (2018). “An Analysis of
Convolutional Neural Networks for Image Classification.” International Conference on Computational Intelligence and Data Science. 132. 377–384.
7. A. Chinea. (2009). “Understanding the Principles of Recursive Neural
Networks: A Generative Approach to Tackle Model Complexity.” International Conference on Artificial Neural Networks, Springer, 952–963.
8. A. Sherstinsky. (2018). “Fundamentals of Recurrent Neural Network
(RNN) and Long Short-Term Memory (LSTM) Network.” arXiv preprint arXiv: arXiv:1808.03314. Accessed on May 2019 from https://arxiv.org/abs/1808.03314
9. Y. LeCun, F.J. Huang, and L. Bottou. (2004). “Learning Methods for
Generic Object Recognition with Invariance to Pose & Lighting.” Computer Vision and Pattern Recognition, Proceedings of the 2004 IEEE Computer Society Conference Volume 2, 97–104.
10. R. Collobert, and J. Weston. (2008). "A Unified Architecture for Natural Language Processing: Deep Neural Networks with Multitask Learning." Proceedings of the 25th International Conference on Machine Learning. 160-167.
11. A. Krizhevsky, I. Sutskever, and G.E. Hinton. (2012). “ImageNet
classification with deep convolutional neural networks.” Advances in Neural Information Processing Systems, 1097–1105.
12. P. Sermanet, D. Eigen, X. Zhang, M. Mathieu, R. Fergus, and Y. LeCun.
(2014) “Overfeat: Integrated Recognition, Localization and Detection using Convolutional Networks.” 2014 International Conference on Learning Representations, 16.
13. K. Simonyan, and A. Zisserman. (2015). “Very Deep Convolutional
Networks for Large-Scale Image Recognition.” arXiv preprint
arXiv:1409.1556. Accessed on May 2019 from
https://arxiv.org/abs/1409.1556
14. M. D. Zeiler, and R. Fergus (2013). "Visualizing and Understanding Convolutional Networks." arXiv preprint arXiv:1311.2901. Accessed
on May 2019 from https://arxiv.org/pdf/1311.2901v3
15. Y. Bengio, A. Courville, and P. Vincent. (2013). "Representation Learning: A Review and New Perspectives". IEEE Transactions on Pattern Analysis and Machine Intelligence. 35(8). 1798-1828. 16. Y. LeCun, B. Boser, J. S. Denker, D. Henderson, R. E. Howard, W.
Hubbard and L. D. Jackel. (1990). “Handwritten Digit Recognition with a Back-Propagation Network.” Advances in Neural Information Processing Systems, 396–404.
17. K. Gauen, R. Rangan, A. Mohan, Y.H. Lu, W. Liu, and A.C. Berg.
(2017). “Low-power Image Recognition Challenge.” Design Automation Conference (ASP-DAC), 2017 22nd Asia and South Pacific, 99–104.
18. K. He, X. Zhang, S. Ren, and J. Sun. (2016). “Deep Residual Learning
for Image Recognition.” Computer Vision and Pattern Recognition (CVPR).
19. H. Lee, R. Grosse, R. Rangarath, and A. Y. Ng. (2009). “Convolutional
Deep Belief Networks for Scalable Unsupervised Learning of Hierarchical Representations.” Proceedings of the 26th Annual International Conference on Machine Learning, 609–616.
20. A. Van Der Ood, S. Dieleman and B. Schrauwen. (2013). "Deep
content-based music recommendation". Curran Associates, Inc. 2643-2651.
21. C. Szegedy, W. Liu, Y. Q. Jia, P. Sermanet, S. Reed, D. Anguelov, D.
Erhan, V. Vanhoucke, and A. Rabinovich. (2014). “Going Deeper with Convolutions.” arXiv e-prints arXiv:1409.4842. Accessed on 8th
August 2019 from https://arxiv.org/pdf/1409.4842
22. O. Russakovsky, J. Deng, H. Su, J. Krause, S. Satheesh, S. Ma, Z.H. Huang, A. Karpathy, A. Khosla, M. Bernstein, A.C. Berg and L. Fei-Fei. (2014). “ImageNet Large Scale Visual Recognition Challenge.” arXiv
preprint arXiv:1409.0575. Accessed on May 2019 from
https://arxiv.org/abs/1409.0575
oto
AUTHORSPROFILE
Dr. Siti Azirah Asmai is a senior lecturer at Faculty of Information and Communication at Universiti Teknikal Malaysia Melaka (UTeM), Malaysia. She obtained her BSc in Computer Science from Universiti Teknologi Malaysia and MSc. in Information and Communication Technology for Engineer from Coventry University. She received her Ph.D. in Information and Communication Technology from UTeM in 2014. Her current research work focuses predictive analysis, Data analytics and Visualization, Time Series, AI and Image Processing.
Mohamad Nurallik Daniel Mohamad Zukhairin is an undergraduate student at Faculty of Information and Communication at Universiti Teknikal Malaysia Melaka (UTeM), Malaysia. He obtained his BSc in Computer Science from Universiti Teknikal Malaysia Melaka. His current project focuses on data analytic, predictive analysis and natural language processing.
Dr. Abdul Syukor Mohd Jaya is a senior lecturer in Faculty of Information and Communication Technology, Universiti Teknikal Malaysia Melaka (UTeM), Malaysia. He got his Bachelor of IT (Industrial Computing) from Universiti Kebangsaan Malaysia and Master of Mechanical Engineering (Advanced Manufacturing Technology) from Universiti Teknologi Malaysia. He received his Ph.D. in Computer Science also from Universiti Teknologi Malaysia in 2014. His research interest focuses on Intelligent Manufacturing and Data Analytics.
Ahmad Fadzli Nizam bin Abdul Rahman, is currently a Senior Lecturer in Department of Intelligent Computing & Analytics (ICA), Fakulti Teknologi Maklumat dan Komunikasi (FTMK). He received his MSc in Information Technology from Universiti Teknologi MARA (UiTM), Shah Alam, Selangor and his degree is in Bachelor of Applied Science (Computer Modeling) from Universiti Sains Malaysia (USM), Pulau Pinang. He has joined OptiMAS research lab since 2013 and his research interests, including Modeling and Simulation, Analytics, AI and Image Processing.
Zuraida Abal Abas, PhD is an associate professor Universiti Teknikal Malaysia Melaka (UTeM). Graduated with first class degree in BSc in Industrial Mathematics from Universiti Teknologi Malaysia (UTM), obtained MSc in Operational Research from London School of Economics (LSE) and received PhD in Mathematics from Universiti Teknologi Malaysia (UTM). Very passionate in research in which obtained more than 15 grants from the university and several government agencies. Has authored and co-authored more than 100 academic papers and presented in local and international
conferences. Has been invited as keynote speaker in some of the
![Figure 1: Classes of larva based on 8thThe paper proposed a rather simple methods in their project that is data acquisition, image pre-processing, training the CNN and real-time classification [1]](https://thumb-us.123doks.com/thumbv2/123dok_us/8163929.250409/1.595.342.520.567.678/figure-classes-proposed-methods-acquisition-processing-training-classification.webp)