Theses
Thesis/Dissertation Collections
7-23-2013
A Quantitative analysis of the mental workload
demands of MRAP vehicle drivers using
physiological, subjective, and performance
assessments
Elizabeth Khol
Follow this and additional works at:
http://scholarworks.rit.edu/theses
This Thesis is brought to you for free and open access by the Thesis/Dissertation Collections at RIT Scholar Works. It has been accepted for inclusion in Theses by an authorized administrator of RIT Scholar Works. For more information, please [email protected].
Recommended Citation
A Quantitative Analysis of the Mental Workload Demands of MRAP Vehicle
Drivers using Physiological, Subjective, and Performance Assessments
by
Elizabeth A. Khol
A Thesis Submitted in Partial Fulfillment of the
Requirements for the Degree of
Master of Science in Industrial Engineering
Department of Industrial & Systems Engineering
Kate Gleason College of Engineering
Rochester Institute of Technology
Rochester, NY
DEPARTMENT OF INDUSTRIAL AND SYSTEMS ENGINEERING
KATE GLEASON COLLEGE OF ENGINEERING
ROCHESTER INSTITUTE OF TECHNOLOGY
ROCHESTER, NEW YORK
CERTIFICATE OF APPROVAL
______________________________________________________________________________
M.S. DEGREE THESIS
______________________________________________________________________________
The M.S. Degree Thesis of Elizabeth A. Khol has
been examined and approved by the thesis committee as
satisfactory for the thesis requirement for the
Master of Science Degree.
Approved by:
Dr. Matthew Marshall, Thesis Advisor
Associate Professor, Industrial & Systems Engineering
Dr. Jacqueline Mozrall, Thesis Committee Member
Professor and Associate Dean, College of Engineering
Dr. Shannon Foley, Thesis Committee Member
Abstract
United States Special Operations Command (USSOCOM) Operators and vehicle Commanders are specially trained United States military Warfighters that have the demanding task of operating or working onboard Mine Resistant Ambush Protected (MRAP) All Terrain Vehicles (M-ATVs). Their missions encounter significant mental demands resulting from fatigue, highly stressful situations, and interactions with Government Furnished Equipment (GFE). Excessive mental demands can be the primary factor leading to compromised vehicle communication, missed improvised explosive device (IED) detection, and increased incidents of vehicle roll-over. Research has demonstrated the
consequences of mental overloading including increased errors, performance decrements, distraction, cognitive tunneling and inadequate time to appropriately process information. The objectives of this thesis were to evaluate the extent to which task-related factors impact the mental workload of Warfighters and to evaluate the consistency among the three categories of mental workload metrics.
Table of Contents
Abstract ... 3
List of Abbreviations ... 8
List of Tables ... 10
List of Equations ... 10
List of Figures ... 11
Introduction ... 19
Literature Review... 20
Mental Workload ... 20
Factors that Impact Mental Workload
... 21
Consequences of Not Considering Mental Workload
... 22
Relationship between Workload and Performance
... 23
Relationship between Workload and Stress
... 25
Mental Workload Assessment Tools ... 26
Objective/Physiological Tools
... 27
Subjective Tools
... 28
Performance Measures
... 30
Environments Used to Study Mental Workload ... 30
Operational Environments
... 30
Laboratory Environments
... 31
Signal Detection Theory ... 32
Mental Workload Assessment Tools Used in this Study ... 34
Purpose of Study ... 38
Statement of Hypotheses ... 38
Participants ... 40
Materials ... 40
Ride Motion Simulator
... 41
Modified Cooper Harper (MCH) Scale
... 42
Electroencephalography (EEG)
... 42
Blink Frequency/Duration
... 43
Tasks and Stimuli
... 44
Design ... 44
Procedure ... 45
Data Analysis ... 47
EEG Analysis
... 47
Signal Detection Analysis
... 48
Analysis of Variance
... 49
Eye Blink Analysis
... 49
Correlations
... 51
Linear Regression Analysis
... 51
Results ... 52
Driver Experience ... 53
Modified Cooper Harper Scale Rating ... 54
IED Miss Rate ... 58
IED False Alarm Rate ... 61
Signal Detection Theory Sensitivity ... 62
Signal Detection Theory Response Criterion ... 64
Eye Blink Frequency ... 66
EEG Channel Time-Frequency Analysis ... 70
Overall EEG Results
... 70
Participant One
... 71
Participant Two
... 72
Participant Three
... 72
Participant Four
... 73
Participant Five
... 73
Participant Six
... 74
Participant Seven
... 74
Participant Eight
... 75
Participant Nine
... 75
Participant Ten
... 76
Participant Eleven
... 76
Participant Twelve
... 77
Participant Thirteen
... 77
Participant Fourteen
... 78
Prediction of Miss Rates ... 78
Discussion ... 80
Driver Experience ... 80
Workload Assessment Metrics ... 81
Eye Blink Frequency
... 81
Eye Blink Duration
... 82
Eye Metrics by Event
... 82
EEG
... 83
Modified Cooper Harper Rating
... 84
Prediction of Miss Rates ... 85
Task Performance ... 85
IED Miss Rate and False Alarm Rate
... 86
Signal Detection Theory Sensitivity
... 88
Signal Detection Theory Response Criterion
... 88
Relevance of Experiment ... 89
Conclusions ... 91
Recommendations ... 93
References ... 95
Appendix A – Summary of Studies using Physiological Tools to Assess Mental Workload .... 100
Appendix B – Summary of Studies using Subjective Tools to Assess Mental Workload ... 102
Appendix C – Modified Cooper-Harper Scale ... 103
Appendix D – Consent Form ... 104
Appendix E – Statistical Analysis Results ... 109
Appendix F – Time-Frequency Analysis Graphs ... 117
List of Abbreviations
AFRL
Air Force Research Lab
ANOVA
Analysis of Variance
ARL HRED Army Research Labs Human Research and Engineering Directorate
ECG
Electrocardiogram
EEG
Electroencephalography
ERP
Event Related Potential
ERSP
Event-Related Spectral Perturbation
FBCB2
Force XXI Battle Command Brigade and Below
Fro-theta
Frontal theta power/activity
GFE
Government Furnished Equipment
GSR
Galvanic Skin Response
HEOG
Horizontal Electrooculogram
HET
Heavy Equipment Transporter
HRV
Heart Rate Variability
HSI
Human Systems Integration
HUMAN
Human Universal Measurement and Assessment Network ICA Independent Component AnalysisIED
Improvised Explosive Device
IgA
Immunoglobulin A
LCS
Littoral Combat Ship
LRA
Linear Regression Analysis
MCH
Modified Cooper-Harper scale
MRAP
Mine Resistant Ambush Protected
NSWCDD
Naval Surface Warfare Center Dahlgren Division
OEF
Operation Enduring Freedom
OIF
Operation Iraqi Freedom
OPD
Ohmic perturbation duration
Par-alpha
Parietal alpha power/activity
RMS
Ride Motion Simulator
SWAT
Subjective Workload Assessment Technique
TARDEC
Tank and Automotive Research, Development and Engineering Center
TLX
Task Load Index
UAV
Unmanned Aerial Vehicle
USSOCOM
United States Special Operations Command
VAS-F
Visual Analog Scale for Fatigue
VDT
Visual Display Terminal
VEOG
Vertical Electrooculogram
VSW
Visual-analog Subjective Workload
List of Tables
Table 1: Outcomes of Signal Detection Theory ... 33
Table 2: Classification of Segment Difficult ... 45
Table 3: Percent of Missing Eye Tracking Data for Each Participant ... 50
Table 4: Mean and Standard Deviation of Years of Service ... 54
Table 5: Average MCH Rating between Segments ... 55
Table 6: Average MCH Rating between Experience Levels ... 56
Table 7: Average MCH Rating by Experience Level and Segment ... 58
Table 8: Individual Miss Rates by Participant ... 59
Table 9: Average Miss Rate between Segments ... 59
Table 10: Average False Alarm Rate between Experience Levels ... 61
Table 11: Average Sensitivity across Segments ... 63
Table 12: Average Sensitivity across Experience Level ... 63
Table 13: Average Sensitivity by Segment between Experience Levels ... 63
Table 14: Average Response Criterion for Each Participant (* indicates an outlier criterion) ... 65
Table 15: Average Criterion across Segments ... 65
Table 16: Average Criterion across Experience Levels ... 66
Table 17: Average Criterion by Segment between Experience Levels ... 66
Table 18: Average Blink Frequency for Each Participant across Segments ... 67
Table 19: Average Blink Duration for Each Participant across Segments ... 69
List of Equations
Equation 1: Formula to Calculate Sensitivity ... 62List of Figures
Figure 1: Ride Motion Simulator (RMS) ... 41
Figure 2: EEG BioSemi electrode cap system ... 43
Figure 3: TARDEC Eye Tracker ... 43
Figure 4: EEG Channel Locations ... 48
Figure 5: Targets Presented and Sample Responses for Signal Detection Task ... 52
Figure 6: Graph of Years of Military Service for 14 Study Participants ... 53
Figure 7: Average Years of Experience for Participant Categories ... 54
Figure 8: Average MCH Rating by Segment ... 56
Figure 9: Average MCH Rating by Experience Level ... 57
Figure 10: Average MCH Rating by Segment and Experience Level ... 58
Figure 11: Average Miss Rate by Segment ... 60
Figure 12: Average IED Miss Rate by Experience Level for Segments 2-4 ... 61
Figure 13: Average False Alarm Rate by Experience Level ... 62
Figure 14: Average Blink Frequency by Experience Level ... 68
Figure 15: Participant 1 EEG Channel 46 Alpha Frequency ... 72
Figure 16: Participant 12 EEG Channel 38 Beta Frequency ... 77
Figure 17: Scatterplot of Miss Rate versus MCH Rating ... 79
Figure 18: Minitab Two-Sample T-Test for Years of Service ... 109
Figure 19: ANOVA for Modified Cooper Harper Rating ... 109
Figure 20: Tukey Test between Segments for Modified Cooper Harper Rating ... 109
Figure 21: Tukey Test between Experience Levels for Modified Cooper Harper Rating ... 110
Figure 22: ANOVA for IED Miss Rate ... 110
Figure 23: Tukey Test between Segments for IED Miss Rate ... 111
Figure 24: ANOVA for IED Miss Rate with Segments 2-4 ... 111
Figure 26: ANOVA for IED False Alarm Rate ... 112
Figure 27: Tukey Test between Experience Levels for IED False Alarm Rate ... 112
Figure 28: ANOVA for Blink Frequency ... 112
Figure 29: Tukey Test between Experience Levels for Blink Frequency ... 113
Figure 30: Minitab Two-Sample T-Test for 2 Blink Rate Categories ... 113
Figure 31: ANOVA for Blink Duration ... 113
Figure 32: Minitab Two-Sample T-Test for 2 Blink Duration Categories ... 113
Figure 33: Minitab Regression Analysis for Miss Rate Explained by MCH Rating, Blink Duration and Blink Frequency ... 114
Figure 34: ANOVA for Miss Rate Explained by MCH Rating, Blink Duration and Blink Frequency .... 114
Figure 35: Minitab Regression Analysis for Miss Rate Explained by MCH Rating and Blink Frequency ... 114
Figure 36: ANOVA for Miss Rate Explained by MCH Rating and Blink Frequency ... 114
Figure 37: Minitab Regression Analysis for Miss Rate Explained by MCH Rating ... 115
Figure 38: ANOVA for Miss Rate Explained by MCH Rating ... 115
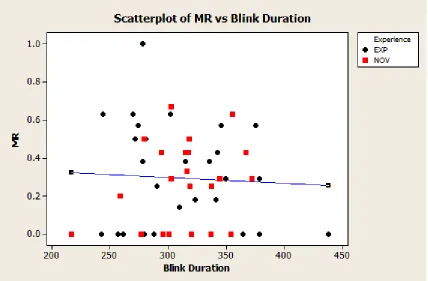
Figure 39: Scatterplot of Miss Rate versus Blink Duration ... 115
Figure 40: Scatterplot of Miss Rate versus Blink Frequency ... 116
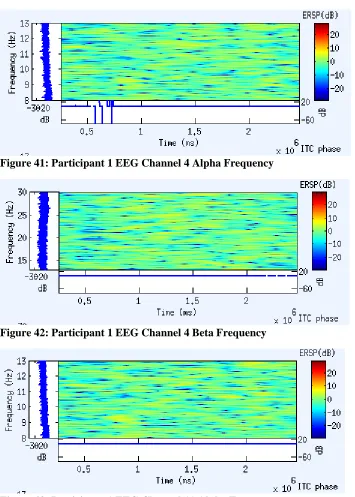
Figure 41: Participant 1 EEG Channel 4 Alpha Frequency ... 117
Figure 42: Participant 1 EEG Channel 4 Beta Frequency ... 117
Figure 43: Participant 1 EEG Channel 11 Alpha Frequency ... 117
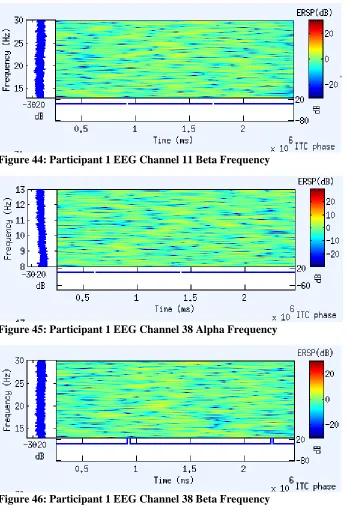
Figure 44: Participant 1 EEG Channel 11 Beta Frequency ... 118
Figure 45: Participant 1 EEG Channel 38 Alpha Frequency ... 118
Figure 46: Participant 1 EEG Channel 38 Beta Frequency ... 118
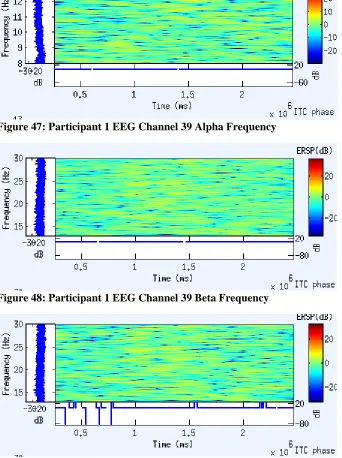
Figure 47: Participant 1 EEG Channel 39 Alpha Frequency ... 119
Figure 48: Participant 1 EEG Channel 39 Beta Frequency ... 119
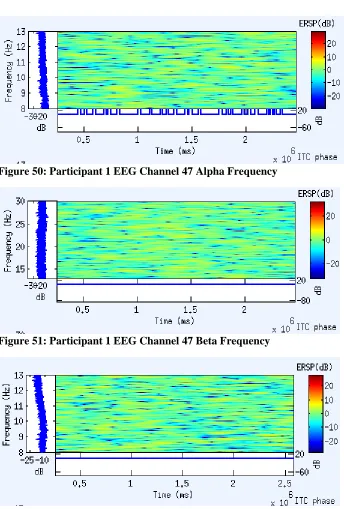
Figure 49: Participant 1 EEG Channel 46 Beta Frequency ... 119
Figure 51: Participant 1 EEG Channel 47 Beta Frequency ... 120
Figure 52: Participant 2 EEG Channel 4 Alpha Frequency ... 120
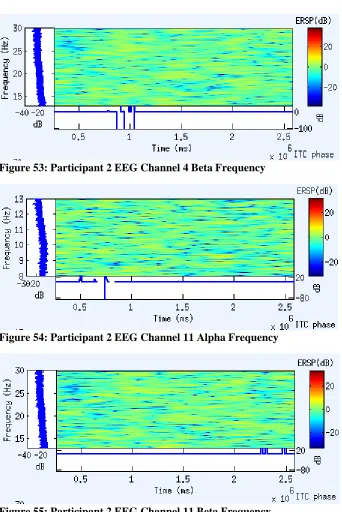
Figure 53: Participant 2 EEG Channel 4 Beta Frequency ... 121
Figure 54: Participant 2 EEG Channel 11 Alpha Frequency ... 121
Figure 55: Participant 2 EEG Channel 11 Beta Frequency ... 121
Figure 56: Participant 2 EEG Channel 38 Alpha Frequency ... 122
Figure 57: Participant 2 EEG Channel 38 Beta Frequency ... 122
Figure 58: Participant 2 EEG Channel 39 Alpha Frequency ... 122
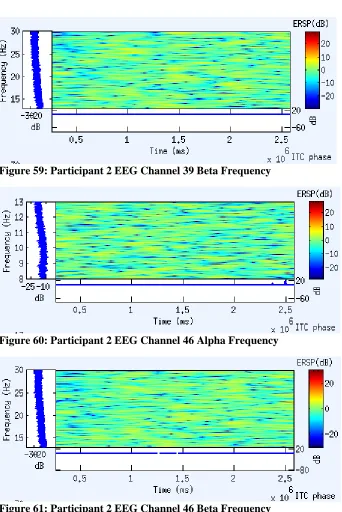
Figure 59: Participant 2 EEG Channel 39 Beta Frequency ... 123
Figure 60: Participant 2 EEG Channel 46 Alpha Frequency ... 123
Figure 61: Participant 2 EEG Channel 46 Beta Frequency ... 123
Figure 62: Participant 2 EEG Channel 47 Alpha Frequency ... 124
Figure 63: Participant 2 EEG Channel 47 Beta Frequency ... 124
Figure 64: Participant 3 EEG Channel 4 Alpha Frequency ... 124
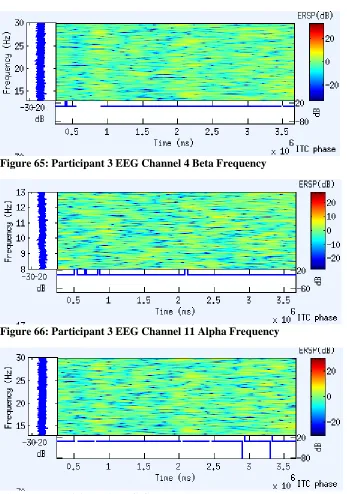
Figure 65: Participant 3 EEG Channel 4 Beta Frequency ... 125
Figure 66: Participant 3 EEG Channel 11 Alpha Frequency ... 125
Figure 67: Participant 3 EEG Channel 11 Beta Frequency ... 125
Figure 68: Participant 3 EEG Channel 38 Alpha Frequency ... 126
Figure 69: Participant 3 EEG Channel 38 Beta Frequency ... 126
Figure 70: Participant 3 EEG Channel 39 Alpha Frequency ... 126
Figure 71: Participant 3 EEG Channel 39 Beta Frequency ... 127
Figure 72: Participant 3 EEG Channel 46 Alpha Frequency ... 127
Figure 73: Participant 3 EEG Channel 46 Beta Frequency ... 127
Figure 74: Participant 3 EEG Channel 47 Alpha Frequency ... 128
Figure 75: Participant 3 EEG Channel 47 Beta Frequency ... 128
Figure 77: Participant 4 EEG Channel 4 Beta Frequency ... 129
Figure 78: Participant 4 EEG Channel 11 Alpha Frequency ... 129
Figure 79: Participant 4 EEG Channel 11 Beta Frequency ... 129
Figure 80: Participant 4 EEG Channel 38 Alpha Frequency ... 130
Figure 81: Participant 4 EEG Channel 38 Beta Frequency ... 130
Figure 82: Participant 4 EEG Channel 39 Alpha Frequency ... 130
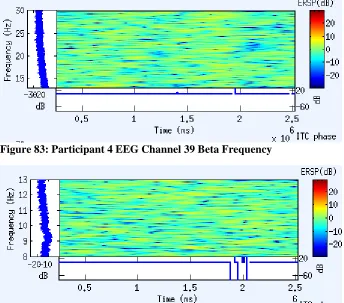
Figure 83: Participant 4 EEG Channel 39 Beta Frequency ... 131
Figure 84: Participant 4 EEG Channel 46 Alpha Frequency ... 131
Figure 85: Participant 4 EEG Channel 46 Beta Frequency ... 131
Figure 86: Participant 4 EEG Channel 47 Alpha Frequency ... 132
Figure 87: Participant 4 EEG Channel 47 Beta Frequency ... 132
Figure 88: Participant 5 EEG Channel 4 Alpha Frequency ... 132
Figure 89: Participant 5 EEG Channel 4 Beta Frequency ... 133
Figure 90: Participant 5 EEG Channel 11 Alpha Frequency ... 133
Figure 91: Participant 5 EEG Channel 11 Beta Frequency ... 133
Figure 92: Participant 5 EEG Channel 38 Alpha Frequency ... 134
Figure 93: Participant 5 EEG Channel 38 Beta Frequency ... 134
Figure 94: Participant 5 EEG Channel 39 Alpha Frequency ... 134
Figure 95: Participant 5 EEG Channel 39 Beta Frequency ... 135
Figure 96: Participant 5 EEG Channel 46 Alpha Frequency ... 135
Figure 97: Participant 5 EEG Channel 46 Beta Frequency ... 135
Figure 98: Participant 5 EEG Channel 47 Alpha Frequency ... 136
Figure 99: Participant 5 EEG Channel 47 Beta Frequency ... 136
Figure 100: Participant 6 EEG Channel 4 Alpha Frequency ... 136
Figure 101: Participant 6 EEG Channel 4 Beta Frequency ... 137
Figure 103: Participant 6 EEG Channel 11 Beta Frequency ... 137
Figure 104: Participant 6 EEG Channel 38 Alpha Frequency ... 138
Figure 105: Participant 6 EEG Channel 38 Beta Frequency ... 138
Figure 106: Participant 6 EEG Channel 39 Alpha Frequency ... 138
Figure 107: Participant 6 EEG Channel 39 Beta Frequency ... 139
Figure 108: Participant 6 EEG Channel 46 Alpha Frequency ... 139
Figure 109: Participant 6 EEG Channel 46 Beta Frequency ... 139
Figure 110: Participant 6 EEG Channel 47 Alpha Frequency ... 140
Figure 111: Participant 6 EEG Channel 47 Beta Frequency ... 140
Figure 112: Participant 7 EEG Channel 4 Alpha Frequency ... 140
Figure 113: Participant 7 EEG Channel 4 Beta Frequency ... 141
Figure 114: Participant 7 EEG Channel 11 Alpha Frequency ... 141
Figure 115: Participant 7 EEG Channel 11 Beta Frequency ... 141
Figure 116: Participant 7 EEG Channel 38 Alpha Frequency ... 142
Figure 117: Participant 7 EEG Channel 38 Beta Frequency ... 142
Figure 118: Participant 7 EEG Channel 39 Alpha Frequency ... 142
Figure 119: Participant 7 EEG Channel 39 Beta Frequency ... 143
Figure 120: Participant 7 EEG Channel 46 Alpha Frequency ... 143
Figure 121: Participant 7 EEG Channel 46 Beta Frequency ... 143
Figure 122: Participant 7 EEG Channel 47 Alpha Frequency ... 144
Figure 123: Participant 7 EEG Channel 47 Beta Frequency ... 144
Figure 124: Participant 8 EEG Channel 4 Alpha Frequency ... 144
Figure 125: Participant 8 EEG Channel 4 Beta Frequency ... 145
Figure 126: Participant 8 EEG Channel 11 Alpha Frequency ... 145
Figure 127: Participant 8 EEG Channel 11 Beta Frequency ... 145
Figure 129: Participant 8 EEG Channel 38 Beta Frequency ... 146
Figure 130: Participant 8 EEG Channel 39 Alpha Frequency ... 146
Figure 131: Participant 8 EEG Channel 39 Beta Frequency ... 147
Figure 132: Participant 8 EEG Channel 46 Alpha Frequency ... 147
Figure 133: Participant 8 EEG Channel 46 Beta Frequency ... 147
Figure 134: Participant 8 EEG Channel 47 Alpha Frequency ... 148
Figure 135: Participant 8 EEG Channel 47 Beta Frequency ... 148
Figure 136: Participant 9 EEG Channel 4 Alpha Frequency ... 148
Figure 137: Participant 9 EEG Channel 4 Beta Frequency ... 149
Figure 138: Participant 9 EEG Channel 11 Alpha Frequency ... 149
Figure 139: Participant 9 EEG Channel 11 Beta Frequency ... 149
Figure 140: Participant 9 EEG Channel 38 Alpha Frequency ... 150
Figure 141: Participant 9 EEG Channel 38 Beta Frequency ... 150
Figure 142: Participant 9 EEG Channel 39 Alpha Frequency ... 150
Figure 143: Participant 9 EEG Channel 39 Beta Frequency ... 151
Figure 144: Participant 9 EEG Channel 46 Alpha Frequency ... 151
Figure 145: Participant 9 EEG Channel 46 Beta Frequency ... 151
Figure 146: Participant 9 EEG Channel 47 Alpha Frequency ... 152
Figure 147: Participant 9 EEG Channel 47 Beta Frequency ... 152
Figure 148: Participant 10 EEG Channel 4 Alpha Frequency ... 152
Figure 149: Participant 10 EEG Channel 4 Beta Frequency ... 153
Figure 150: Participant 10 EEG Channel 11 Alpha Frequency ... 153
Figure 151: Participant 10 EEG Channel 11 Beta Frequency ... 153
Figure 152: Participant 10 EEG Channel 38 Alpha Frequency ... 154
Figure 153: Participant 10 EEG Channel 38 Beta Frequency ... 154
Figure 155: Participant 10 EEG Channel 39 Beta Frequency ... 155
Figure 156: Participant 10 EEG Channel 46 Alpha Frequency ... 155
Figure 157: Participant 10 EEG Channel 46 Beta Frequency ... 155
Figure 158: Participant 10 EEG Channel 47 Alpha Frequency ... 156
Figure 159: Participant 10 EEG Channel 47 Beta Frequency ... 156
Figure 160: Participant 11 EEG Channel 4 Alpha Frequency ... 156
Figure 161: Participant 11 EEG Channel 4 Beta Frequency ... 157
Figure 162: Participant 11 EEG Channel 11 Alpha Frequency ... 157
Figure 163: Participant 11 EEG Channel 11 Beta Frequency ... 157
Figure 164: Participant 11 EEG Channel 38 Alpha Frequency ... 157
Figure 165: Participant 11 EEG Channel 38 Beta Frequency ... 158
Figure 166: Participant 11 EEG Channel 39 Alpha Frequency ... 158
Figure 167: Participant 11 EEG Channel 39 Beta Frequency ... 158
Figure 168: Participant 11 EEG Channel 46 Alpha Frequency ... 158
Figure 169: Participant 11 EEG Channel 46 Beta Frequency ... 159
Figure 170: Participant 11 EEG Channel 47 Alpha Frequency ... 159
Figure 171: Participant 11 EEG Channel 47 Beta Frequency ... 159
Figure 172: Participant 12 EEG Channel 4 Alpha Frequency ... 160
Figure 173: Participant 12 EEG Channel 4 Beta Frequency ... 160
Figure 174: Participant 12 EEG Channel 11 Alpha Frequency ... 160
Figure 175: Participant 12 EEG Channel 11 Beta Frequency ... 161
Figure 176: Participant 12 EEG Channel 38 Alpha Frequency ... 161
Figure 177: Participant 12 EEG Channel 39 Alpha Frequency ... 161
Figure 178: Participant 12 EEG Channel 38 Beta Frequency ... 162
Figure 179: Participant 12 EEG Channel 46 Alpha Frequency ... 162
Figure 181: Participant 12 EEG Channel 47 Alpha Frequency ... 163
Figure 182: Participant 12 EEG Channel 47 Beta Frequency ... 163
Figure 183: Participant 13 EEG Channel 4 Alpha Frequency ... 163
Figure 184: Participant 13 EEG Channel 4 Beta Frequency ... 164
Figure 185: Participant 13 EEG Channel 11 Alpha Frequency ... 164
Figure 186: Participant 13 EEG Channel 11 Beta Frequency ... 164
Figure 187: Participant 13 EEG Channel 38 Alpha Frequency ... 165
Figure 188: Participant 13 EEG Channel 38 Beta Frequency ... 165
Figure 189: Participant 13 EEG Channel 39 Alpha Frequency ... 165
Figure 190: Participant 13 EEG Channel 39 Beta Frequency ... 166
Figure 191: Participant 13 EEG Channel 46 Alpha Frequency ... 166
Figure 192: Participant 13 EEG Channel 46 Beta Frequency ... 166
Figure 193: Participant 13 EEG Channel 47 Alpha Frequency ... 167
Figure 194: Participant 13 EEG Channel 47 Beta Frequency ... 167
Figure 195: Participant 14 EEG Channel 4 Alpha Frequency ... 167
Figure 196: Participant 14 EEG Channel 4 Beta Frequency ... 168
Figure 197: Participant 14 EEG Channel 11 Alpha Frequency ... 168
Figure 198: Participant 14 EEG Channel 11 Beta Frequency ... 168
Figure 199: Participant 14 EEG Channel 38 Alpha Frequency ... 169
Figure 200: Participant 14 EEG Channel 38 Beta Frequency ... 169
Figure 201: Participant 14 EEG Channel 39 Alpha Frequency ... 169
Figure 202: Participant 14 EEG Channel 39 Beta Frequency ... 170
Figure 203: Participant 14 EEG Channel 46 Alpha Frequency ... 170
Figure 204: Participant 14 EEG Channel 46 Beta Frequency ... 170
Figure 205: Participant 14 EEG Channel 47 Alpha Frequency ... 171
Introduction
Warfighters face many difficulties while operating or working onboard Mine Resistant Ambush Protected (MRAP) vehicles. United States Special Operations Command (USSOCOM) Operators and vehicle Commanders are some of the most taxed and most stressed Warfighters conducting missions for the United States military. Their deployments are often long and deep into enemy territory. Their
missions have significant mental demands resulting from fatigue and highly stressful situations. Excessive mental demands can be the primary factor leading to compromised vehicle communication, missed improvised explosive device (IED) detection, and increased incidents of vehicle roll-over.
One potential major source of mental workload on MRAP drivers is the Government Furnished Equipment (GFE) subsystems. A few examples of these subsystems include the remote weapons turret, the crosshairs system, and the Force XXI Battle Command Brigade-and-Below (FBCB2). Multiple GFE subsystems are installed inside MRAP vehicles in an attempt to improve situational awareness. It has been demonstrated by many researchers that excessive presentation of information can lead to increased mental workload, and ultimately overload. However, little is known about how much workload from the GFE, or other sources, will compromise the driver’s communications and proper IED detection.
The main focus of this study was to evaluate mental workload experienced by MRAP drivers during computer-based, high-fidelity simulated missions. Few studies have been able to collect either operational or simulator data specifically related to an MRAP vehicle. This thesis used data previously obtained from a study that subjected Warfighters to combinations of high and low levels of
communications and IED detection while driving through a simulated course. Physiological, subjective and performance measures of mental workload were collected from each Warfighterin order to assess the Warfighter’s ability to process information and interpret their surroundings while driving. The focus of
this thesis was on mental workload since driving efforts are primarily cognitive and information-processing intensive.
the three categories of mental workload metrics demonstrated similar sensitivity levels to the task
conditions. Due to the many settings under which workload needs to be measured, it is unlikely that one ideal form of measurement will ever be found for all applications. However, it may be possible to
determine the most appropriate measures for a particular situation (Miller, 2001), which this thesis sought to do for MRAP drivers using a controlled, laboratory environment in order to evaluate their feasibility for implementation in an operational environment. The overarching goal was to identify metrics that are reliable, sensitive, and easy to use, and determine whether a simple approach can be used or if an instrument-based approach is required for the desired sensitivity.
The results of this research were intended to provide the data to support or refute the theory that MRAP vehicle drivers experience varying levels of mental workload that can negatively impact IED detection performance. If such a finding is reached, this study also sought to identify which specific mental workload assessment tool(s) may be the most accurate, conclusive, and easy to use outside of a laboratory environment.
Literature Review
Mental Workload
Mental workload is a complex topic with no widely accepted definition or way to measure. Hancock and Meshkati (1988) defined mental workload as “the operator’s evaluation of the attentional
load margin (between their motivated capacity and the current task demands) while achieving adequate task performance in a mission-relevant context.” Other researchers defined mental workload as the “portion of operator information processing capacity or resources that is actually required to meet system demands” (Eggemeier, Wilson, Kramer, and Damos, 1991). Both definitions acknowledge the
consumption of limited cognitive resources required by a system. Individuals have finite resources and it is critical to understand and assess how task demands consume these limited resources (Wickens and Hollands, 2000).
assessed by human systems integration (HSI) experts in order to understand the impact these technologies have on the Warfighter, both good and bad. Many current HSI considerations focus heavily on physical human requirements and impacts. There is also a critical need to assess the mental demands that
technological advancements place on the Warfighter. These technological advancements generally come in the form of displays that provide enhanced information about the environment, the location of fellow troops, and known or suspected locations of enemy forces. The large number of complex displays can increase the level of information processing required and elevate the risk of overloading. These displays along with the demands of other tasks, such as driving or communication, all compete for the
Warfighter’s attentional resources, potentially compromising situational awareness and impacting primary
task performance (National Research Council, 1997). One tool, the Land Warrior System, intended to help Warfighters by having them wear a head-mounted eye piece that can provide maps and allow them to see around walls, while remaining in safety, through the use of a camera and video feed. During certain missions, soldiers did not use the map on the eye piece screen to identify the location of fellow soldiers. Instead, they handled the situation that was right in front of them, despite the presence of a map. These advancements may have intended to help, but presented visual noise that interfered with the way the Warfighter performed his duties (Shachtman, 2009).
Factors that Impact Mental Workload
the nature of the task, the precision required, the quality, presentation, and modality of the task, and the characteristics of input or response devices.
Cain (2007) highlighted additional specific factors that can impact mental workload. He noted that excessive task demands can lead to elevated levels of mental workload which could ultimately compromise performance. Additionally, he noted that these high demands could stress an individual’s limited cognitive resources beyond their capacity. Another factor contributing to mental workload is poor task design or system layout. For example, requiring an individual to search displays in a suboptimal manner will result in increased mental workload. Finally, simultaneous tasks competing for the same mental resources can also lead to overloading.
Consequences of Not Considering Mental Workload
Understanding the impacts of mental workload on tasks can also help researchers to recognize the causes and consequences of insufficient task performance. Researchers are well aware that excessive workload can be detrimental to performance. To help ensure optimal performance and satisfaction, individuals want to minimize their workload, and they will do their best to perform at the level dictated by their tasking. However, it is possible that the tasking can become overwhelming. Any increases in task uncertainty or unpredictability can also lead to higher levels of workload by causing stress from time pressures to meet tighter deadlines or working longer hours from overtime. These considerations are important not only for workload, but also for budget constraints and job satisfaction. Ignoring individual differences in mental workload can also impact task performance. Understanding that novices experience higher baseline workload levels than skilled experts can ensure tasks and duties are assigned appropriately to lead to success. For example, a report by Neill (2011) showed that nurses who experience high
It is also important for military vehicles to undergo an assessment of their impact on mental workload. In order to improve Warfighter safety, it is crucial to thoroughly understand how mental workload impacts MRAP vehicle Operators and Commanders. While MRAP vehicles have been shown to help save lives overseas, the consequences of driver overload can be potentially fatal. Between November 2007 and January 2010, there were more than 230 MRAP roll-overs, many of which were directly attributed to driver error (Sanborn, 2010). Additionally, in 2011 alone, there were more than 16,000 makeshift bomb attacks in Afghanistan (Brook, 2012). Therefore, the vigilance of the driver is crucial to properly identify these threats to avoid an incident. These two examples highlight the importance of ensuring MRAP vehicle driver workload does not adversely impact performance.
Relationship between Workload and Performance
Performance can be understood as successfully completing the task at hand without failure or damage to operator or machine (Lysaght, Hill, Dick, Plamondon, Linton, Wierwille, Zaklad, Bittner, Jr., and Wherry, 1989). The Yerkes-Dodson Law characterizes the relationship between workload and performance as an inverted U-shaped function. Essentially, as arousal, or workload, increases, an individual’s performance also increases, but only to a certain point. Once this optimum is reached,
performance begins to decline as workload continues to increase. Additionally, more complex tasks will have a lower performance optimum and require a lower workload level to reach that optimum (Yerkes and Dodson, 1908). The Yerkes-Dodson Law can further be explained by demonstrating that individuals experiencing low task stress are not fully engaged in their activities and will not improve performance. Under high levels of sustained stress, individuals must develop ways to cope with that stress, which will also ultimately degrade performance. Therefore, a moderate level of stress is best because individuals will be engaged in their tasks and are able to focus their energy to ultimately improve performance (Jamal, 2007).
experiment used operator utilization, or the percent of time busy, as an indicator of workload. The findings confirmed the hypothesis that high levels of workload would leave the operator too busy to process information appropriately. Conversely, under-utilized operators overlooked important information because they became complacent and were not fully engaged in the task at hand. The Yerkes-Dodson Law proved to be appropriate to help predict both human and system performance in this situation.
In order to maintain a certain level of performance, individuals develop strategies to cope with workload. They can reschedule, postpone, or even eliminate tasks in order to achieve the desired level of performance. These coping mechanisms are often used when workload levels are too high, but there is also the risk of having workload levels too low. If workload levels are too high, errors increase because individuals are not able to respond fast enough to task requirements. If workload levels are too low, individuals can experience boredom and a lack of vigilance (Huey and Wickens, 1993).
Workload imbalances can occur under many different scenarios. Warfighters are just one group of individuals subject to under- or overloading. At very low levels of workload, the Warfighter can face boredom, reduced alertness and a lack of attention (Brookhuis and de Waard, 2001). Many tasks performed by Warfighters are vigilance tasks and underloading is a serious problem. Understimulation resulting from monitoring for infrequent events should be avoided because lapses in attention can lead to missed cues. High workload levels lead to performance decrements as well as cause distraction, cognitive tunneling or inadequate time to properly process information (Brookhuis, and de Waard, 2001). The optimum level of workload is desired so that Warfighters are not bored but also not overwhelmed, causing performance to suffer. The pace of the Warfighter’s environment requires them to process large amounts of information and make critical decisions in a short amount of time.
By establishing a link between workload levels and human performance, several outcomes can be obtained. Manpower and personnel requirements can be established, helping to ensure the proper number of individuals on a task, as well as the appropriate knowledge, skills and abilities for the task.
Relationship between Workload and Stress
Stress is understood as a psychological state of tension resulting from a detected threat
(Congleton, Jones, Shiflett, McSweeney, and Huchingson, 1997). Sources of stress can come from time pressure, environmental stressors such as noise, heat, vibration, or poor lighting, and psychological factors including anxiety, fatigue, or danger, to name a few. Along with workload, stress has been found to have an interaction with performance, often affecting it in a negative manner. Techniques such as design changes or training attempt to mitigate the negative impacts of stress (Huey and Wickens, 1993).
Many responsibilities placed upon the Warfighter are stressful and these individuals have many other things on their mind beyond just daily work duties. Stress has also been shown to result in excessive task demands and performance decrements (Embrey, Blackett, Marsden and Peachey, 2006). Warfighters subjected to varying levels of physiological stressors such as stress and fatigue consequently experience an increase in mental workload. As systems and demands on the Warfighter become more complex, there is a desire to decrease their stress and workload so they can continue to operate and perform at a high level. Assuming that workload induces stress, one way to identify levels of stress faced by individuals is to measure workload (Congleton, et.al., 1997).
Biron (2012) reported about military efforts that are currently underway by the Air Force
Research Laboratory (AFRL) to study how stress affects performance of unmanned aerial vehicle (UAV) pilots. The Human Universal Measurement and Assessment Network (HUMAN) Laboratory is working on integrating a wide variety of sensors, from electroencephalography (EEG) to eye trackers,
galvanic skin response, voice stress analyzers, and brainwave monitors, to try and gather the
most complete picture of what happens to these pilots as they experience stress. Researchers note
that all pilots will experience overloading but at different levels, depending on their level of
expertise. The same is likely true of MRAP vehicle drivers. The research initiative at the
HUMAN Lab seeks to identify when operators become stressed to help improve system design
Mental Workload Assessment Tools
Mental workload measurement devices can be broadly grouped into three distinct categories: physiological, or objective, measures, subjective measures, and performance measures. Physiological measures are objective in that they attempt to capture data without any personal opinion or emotions, subjective measures are based on individual opinions, and performance measures are surrogate measures that evaluate task performance and can be used to vary workload levels. The study performed to collect data for this thesis used all three measurement tools.
There are several factors to consider when selecting metrics to evaluate workload. These factors serve as criteria to help determine which tasks contribute to mental workload (Miller, 2001). According to Wierwille and Eggemeier (1993), the three most important factors to consider when conducting
experiments in test and evaluation environments are sensitivity, intrusion, and diagnosticity. The data gathered for this thesis were collected in a six degree-of-freedom motion-based simulator representative of military ground vehicles. Since a simulator is a test and evaluation environment, these three factors were considered most important. Additionally, metrics that rank highly on these three factors will likely face greater acceptance when expanding testing to operational military environments. The military desires metrics that are simple yet robust, providing practical results with minimal impact to participants.
(Wierwille and Eggemeier, 1993). Diagnosticity allows researchers to understand specific factors that cause workload or types of resources that are being consumed.
The aforementioned factors are the primary areas of interest for this thesis effort. Other additional factors that are important but not considered in this research include validity, reliability, cost, time
required, interval of collection, operator acceptance, and ease of data collection, processing, and analysis (Miller, 2001).
Objective/Physiological Tools
Using physiological tools to measure mental workload has many benefits. The results obtained from these tools can be compared across multiple participants, and with high inter-rater reliability because of the standardization of the tools. The inter-rater reliability also allows results to be generalized across a sampling group, or population, depending on the similarity of testing conditions. These tools lend themselves to statistical analysis and interpretation, aiding in the assessment of participants. The NATO Research and Technology Organisation (2001) recommends the use of objective metrics because
individuals cannot voluntarily influence the results. Consequently, these tools provide unbiased measures of workload. Finally, the nature of these tools allows researchers to measure workload continuously over time and not just at one particular instance of an individual’s experience.
While there are many benefits to using physiological measures, there are also some drawbacks. Certain tools can require cumbersome equipment, such as electroencephalography (EEG). Extensive equipment requirements can be a major limitation to using these tools in an operational environment. For example, in an operational setting, there may be space constraints, mobility requirements, or tasks that require high precision that cannot have equipment interference. Additionally, expert data interpreters, or extensive learning to achieve expertise, may be required, resulting in additional costs as well as a delay in processing the collected data. A consideration to be mindful of from Lee (2000) is that certain
measurement devices can be sensitive to other environmental factors that are unrelated to workload which could undermine validity and reliability of results. For example, pupil dilation can be affected by
Many studies have been performed using a wide range of physiological tools to assess mental workload in both laboratory and operational environments. However, it is clear that there is no consensus on which measurement tools are best either overall or in a specific environment. It is often up to the researcher to decide what metric should be used since a standard approach is lacking. The lack of consistency when objectively measuring mental workload often makes comparisons across studies very difficult even if the same metric is used.
Appendix A provides a table outlining the results of several studies that used physiological tools. Across 16 studies, 17 different techniques were used to assess workload. Some studies attempted to compare results across different workload measures, while others simply sought to validate one particular technique. Most of the studies were able to show some change in workload but the inconsistency in techniques used and results obtained make it nearly impossible to determine which situations truly had too much workload to the point requiring system redesign. These inconsistencies make comparisons between studies and generalizability to other situations extremely difficult.
Subjective Tools
Subjective mental workload tools are used in an attempt to capture an individual’s personal interpretation of a task’s demands (Cain, 2007). Subjective tools are often used because they are generally
and Technology Organisation, 2001). These tools are beneficial for assessing one specific task, but generally not for combinations of tasks that must be performed at the same time.
There are, however, several drawbacks to be mindful of when considering using subjective tools. Given the large individual variability in results, there is very limited inter-rater reliability and the
repeatability of the results is limited. The results are subject to individual biases across participants (NATO Research and Technology Organisation, 2001). Although scales are generally predefined and ratings clearly described, subjects will set their own criteria for ratings (Embrey, et. al., 2006). Since the ratings generally produce ordinal data, the ability to perform certain types of statistical parametric analyses with the data may be limited. These tools suffer from limited precision and experimenters may not be able to determine how workload fluctuates during a particular task. Finally, these tools may be potentially disruptive to the task or activity at hand by distracting an individual from their task in order to complete a subjective assessment. Disrupting a task could negatively affect the results, both of the task and the rating, especially if the interruption occurs at a critical point in an activity. Fortunately, under certain laboratory or simulator conditions, it has been shown that subjective ratings can be administered up to 15 minutes after a task has been performed and ratings will not be impacted (NATO Research and Technology Organisation, 2001).
Appendix B contains a summary of several studies that have used subjective measures and the results obtained. Some of these studies used a single subjective measure in combination with either physiological or performance measures. Other studies used several subjective measures to compare the effectiveness or validate a tool. Consistent with the physiological metrics, the results using subjective measures are somewhat inconclusive. NASA-TLX was the most popular metric for these selected studies; however, it did not outperform the other metrics in all cases. Even though the results are inconsistent, these studies show that subjective metrics are effective in assessing an individual’s workload in a variety
measures across multiple environments would indicate that these tools offer the best way to get
meaningful data at the lowest cost. Providing justification for broad implementation of a relatively easy tool would allow for more comparisons to be made across studies because the tool can be tested under many settings without much effort or cost.
Performance Measures
Performance measures rely on primary and secondary tasks to assess mental workload. An underlying assumption to using performance measures is that the increased processing required for higher levels of workload will degrade performance of the tasks being performed. Additional tasks beyond the primary responsibilities of the participant are added to vary the workload level. Accuracy and efficiency of the primary and secondary tasks are used to assess an individual’s workload. The drawbacks to performance measure are that they can lead to underloading, overloading, or confounding effects such as training and experience. Additionally, they are very task-specific and not generalizable between tasks (Gawron, 2000). The study performed to collect data for this thesis introduced secondary tasks in order to manipulate workload levels and assess performance.
Environments Used to Study Mental Workload
Studies can be conducted in laboratory settings, simulators, or operational environments. Regardless of the setting that is used, the desire is for the collection environment to be as realistic as possible so results have practical significance and are generalizable to similar environments.
Operational Environments
Collecting data in operational environments allow experimenters to conduct research in the setting where the results are often employed. Operational environments are often very different from the controlled environments of a laboratory. These environments can suffer from noise and no precise ability to duplicate the exact scenario among multiple participants (Carsten and Brookhuis, 2005).
which is derived from the Cooper Harper Scale. It was determined that all three scales were appropriate metrics for use in operational environments. The Littoral Combat Ship (LCS) Manpower, Workload, and Fatigue study collected workload data underway onboard LCS through time on task measurements to identify specific billets at risk for experiencing high workload levels and negative impacts from fatigue and ship motion. At this time, no findings or conclusions have been reported (Gattie, Mead, Baron, Hamilton, Iden, and Thurber, 2011). Due to the limited amount of operational data collected on mental workload, it is clear that more research needs to be performed. The next step for many studies should be to implement the laboratory set-up into an operational environment to validate findings.
Laboratory Environments
Laboratory environments make use of simulators to collect data in an environment that is modeled after the real world. Technological advancements over time have made enhancements to the fidelity of simulators and their representation of real-world environments. The generalizability of laboratory results depends greatly on the fidelity of simulators. Mock-ups or simulators may not entirely represent true workload demands, but they can provide some preliminary results or findings and help direct future studies. The benefit to using laboratory environments is they provide a safe place to test new set-ups, configurations, or technological advancements. They are also controlled environments which can help reduce confounding variables.
Laboratory studies have been conducted and proved the sensitivity of experiments conducted in a simulated setting. A simulation done for guided missile cruisers included an assessment of workload over time (Santoro, Kieras, and Pharmer, 2004). A seven-point rating scale was used to assess workload; however, no training, definitions or instructions were provided. The findings showed subjective workload increases were significant over time even though the variability between individuals’ ratings was not very
Regli, Tremoulet, and Stibler, 2005) used real-time electroencephalogram (EEG) in an attempt to demonstrate the possibility of developing a closed-loop system that could reallocate tasks and streamline an individual’s cognitive workload. This low-fidelity simulator consisted of a 17-inch monitor displaying
images along with a spoken language interface. Even with this simple simulator, varying levels of mental workload and resulting performance could be detected.
While operational environments are often the ideal location to assess mental workload, there are practical limitations to testing in this type of environment. Laboratory environments have been shown to be effective substitutes for operational environments because they can produce authentic results. An automobile driving study by Reimer and Mehler (2011) showed that once a participant had adapted to an environment, their base level of arousal was higher in the real-world environment than a simulator. This is likely due to the fact that the consequences of mistakes in the real-world environment are much more significant than in a simulator. However, the same study credits a medium fidelity simulator for providing a similar pattern of response to an increase in mental demands as was observed for a field condition.
A European driving study conducted by Engström, Johansson, and Östlud, (2005), compared the results obtained from a simulator and field driving experiment through the use of secondary tasks. The goal was to assess the generalizability of results between environments. The results found consistent trends between both environments. However, the physiological workload was higher in the field
environment, indicating an increased effort because of the actual risk associated with real-world driving. It is important to conduct additional research on simulator set-ups to better understand the effectiveness of simulators as compared to operational environments.
Signal Detection Theory
Signal detection tasks require that an operator be able to detect that a signal is present along with the inevitable noise. Signal detection theory can be used when a subject is presented with a task and their job is to respond either “yes” a signal was present or “no” a signal was not present. From these responses come four possible outcomes based on signal presentation and the subject’s response. These are shown
below in Table 1.
State of World Operator Behavior Signal Present (+ Noise) Signal Absent (Noise only)
“Yes” (Signal seen) Hit (H) False Alarm (FA)
“No” (No signal perceived) Miss (M) Correct Rejection (CR)
Table 1: Outcomes of Signal Detection Theory
Two important parameters that can be evaluated with signal detection theory are sensitivity, also known as d’, and response criterion, also known as β. Sensitivity represents the separation of internal
noise from a signal and noise; the inherent ability of observer to discriminate signal from noise. Low sensitivity leads to high misses and false alarms since the item of interest is easily confused with noise. High sensitivity leads to very few misses and false alarms because the item of interest is easily
distinguished as either a signal or noise.
The response criterion represents the decision strategy of the observer and the likelihood of an individual to indicate if there is a target or a distracter. When the observer has a conservative criterion, classified by β greater than one, they require a large amount of evidence to indicate a signal is present.
Therefore, the probability of a correct rejection is higher than the probability of a hit. Risky criterion with β less than one, indicates that less evidence is required for the observer to identify a signal is present. In
this case, the probability of a hit is larger than the probability of a correct rejection. Finally, observers can be neutral in their criterion, as shown when the probability of a correct rejection is equal to the probability of a hit (Wickens, Lee, Liu, and Becker, 2004). Rewards or punishments can be assigned to certain outcomes in an attempt to alter participant behavior (Knoblauch and Maloney, 2012).
consequences, such as in the case of IED detection, then the response criterion will be set to a level where misses are rare but false alarms are more likely. The response criterion can be affected by a driver’s expectancy that there will be an IED or other threat, such as if the area they are driving through is prone to IED attacks.
IED detection can be modeled using signal detection theory. In this experiment, IEDs and distracters were presented and participants were tasked with identifying whether the item presented was an IED or a non-IED. The four outcomes outlined above are all possible outcomes during IED detection. Although no rewards or punishments were administered during this experiment, in reality there are very strong consequences for failing to properly identify IEDs in the field. In the case of this signal detection task, the penalty for misses is more severe than false alarms. The IED performance from this study is likely tempered because the participants were identifying targets in a simulator. In a warzone where the stakes are much higher, the likelihood of false alarms is even greater due to the very severe and
potentially fatal consequences of missing an IED in the field. Although there is no way to mimic the severity of an IED in a simulated environment, researchers did their best to imitate the responses to IEDs as much as possible.
Mental Workload Assessment Tools Used in this Study
The subjective metric selected was the Modified Cooper-Harper scale (MCH), a 10-point unidimensional scale that uses a decision tree to guide individuals to appropriate workload ratings. Individuals answer yes or no to a series of decision points and then select the most appropriate rating based on the description provided. Coincidentally, this tool was initially developed for use in a military environment (Embrey, et. al., 2006). The MCH was originally developed to assess aircraft handling but was modified to estimate workload (Gawron, 2000). This assessment can be completed while performing a task or shortly after, so there is minimal disruption to the participant. The MCH has been shown to be ideal for primarily psychomotor tasks (Cain, 2007), which were relevant and required for the simulated driving task performed in this study. Gawron (2000) noted that the MCH was effective at assessing overall workload, and was sensitive to different types of workload.
There were two limitations to MCH that were noted when this tool was selected. First, the MCH assumes that it is desirable to have a low workload, which is not necessarily a valid assumption. This assumption is manifested in the scale by directing individuals to rate their workload at a “one” if minimal effort is required, “two” if low effort is required, and so on. Recall that the Yerkes-Dodson Law would suggest that an intermediate level of mental workload would lead to optimal task performance. On this scale, the intermediate workload ratings (four to six) describe workload as between moderately high and maximum in order to still maintain performance (Gawron, 2000). However, the optimum level of workload varies widely depending on the specific task. Also, the MCH has no diagnostic ability which would limit its usefulness in field environments or to help as a benchmark when scheduling activities based on workload levels (Embrey, et. al., 2006).
Electroencephalography (EEG) was selected as one physiological metric to assess mental workload. According to Berka, Levendowski, Cvetinovic, Petrovic, Davis, Lumicao, Zivkovic, Popovic, and Olmstead, (2004), EEG is the only physiological signal that accurately reflects subtle shifts in
EEG measures the variation in voltage over time of the brain, recorded through the use of
electrodes placed on the scalp. The presentation of varying stimuli will elicit a voltage change in the EEG reading. The term event-related potential describes these voltage changes as the result of a certain event (Coles and Rugg, 1995) and is another method used to assess an individual’s mental workload.
There are many different approaches to analyzing mental workload using EEG. One method is an EEG frequency analysis which would be used to assess an operator’s state, such as arousal during a vigilance task. There are four types of waves that are classified based on their frequency. Delta waves are found up to 4 hertz; theta waves from 4 hertz to less than 8 hertz; alpha waves from 8 to less than 13 hertz; and beta waves are anything greater than 13 hertz (de Waard, 1996). Murata (2005) found that alpha and beta are generally elicited from increased alertness during a period of higher mental workload. Examining wave presence and patterns can allow researchers to determine the amount of mental workload induced by certain tasks.
Two different methods exist to elicit event-related potentials. One method is through primary task stimuli, while the other involves an additional and less important secondary auditory task or visual probe. The P300 component has been shown to increase in amplitude with the increase in difficulty of the primary task. However, the P300 component elicited by the secondary task has a decrease in amplitude with the decrease in difficulty of the primary task (Kramer, Trejo, and Humphrey, 1995). The downside to using P300 to assess mental workload is the limited amount of time that information processing is
actually conducted in the central nervous system. Therefore, the P300 component is subject to missing changes in workload (Murata, 2005). Kramer, et. al. (1995) found the P300 component to be “sensitive to changes in processing demands.” Additionally, P300 is one of the more sensitive components of event-related potentials, as compared to N100 or P200 (Miller, Rietschel, McDonald, and Hatfield, 2011).
to identify abrupt changes in EEG. Wavelet analysis allows for appearance time and total power to be extracted, which are reliable metrics for assessing changes in workload in a variety of human-computer interaction environments (Murata, 2005).
Attempts to use EEG to analyze mental workload in an operational environment have been very limited at this time. Currently, the majority of studies have been conducted in a controlled laboratory environment. The application of these results to the real-world is unclear at this time, primarily due to the fact that operational environments are highly variable (Kohlmorgen, Dornhege, Braun, Blankertz, Müller, Curio, Hagemann, Bruns, Schrauf, and Kincses, 2007). However, one study found significant correlations between EEG indices of mental state changes and performance in labs, simulations, and operational environments (Gevins, Smith, McEvoy, and Yu, 1997; Gevins, Smith, Leong, et al., 1998). This suggests that further studies using EEG to assess mental workload may provide useful results in a variety of environments.
Eye blinks are another physiological eye metric that be used to measure mental workload. These data can be collected either through the use of a camera-based eye tracker or through electrooculogram (EOG). In this experiment, the camera used to record eye metrics collected eye blinks, fixations, and saccades. From these recorded eye metrics, blink frequency and blink duration were the eye metrics used to assess mental workload. The lack of physical control over eye blinks is one reason they are selected as a metric to assess mental workload. Blink frequency has not been used as extensively to assess workload; however, there is evidence suggesting that blink frequency is affected by detection and identification tasks. Several studies involving eye blinks have shown that as mental workload increases, blink frequency increases and blink duration decreases. A study using a mental arithmetic test found significant
Purpose of Study
There were three main objectives of this study. The first was to identify if mental workload was one of the major contributors to poor mission performance, such as the inability to detect improvised explosive devices (IEDs). Researchers were interested in determining if the requirements of MRAP vehicle drivers exceed their capabilities to do their job and keep fellow Warfighters safe. Confounding factors related to workload are driver training received, driving environment, and driving demands such as communication within one’s MRAP and between vehicles. The second objective was to determine the ability of heavy vehicle drivers to appropriately assess their workload level by measuring the statistical significance of the results from physiological measure, performance measures, and subjective workload measures. Physiological measures could be correlated to assess validity and interchangeability. Also, if physiological and subjective measures varied as expected, it was possible that a quick, subjective tool could be used to immediately assess an MRAP vehicle driver’s mental workload to a reasonable level of accuracy and sensitivity. The third objective was to identify if heavy vehicle drivers’ mental workload and performance varied significantly based on their level of expertise. Researchers expected more experienced drivers to be able to perform under higher levels of workload than novices. The differences in physiological workload, subjective workload, and performance have not been quantified.
Statement of Hypotheses
It is hypothesized that:
If experimental conditions under which blink frequency and electroencephalography
measures of mental workload are constant, then these two measures of mental workload will be correlated.
If significant differences exist for average blink frequency between the four course
segments, then significant differences will also exist between subjective workload ratings for the four segments.
If simulated events are consistent across all participants, then participants who are novice
If mental workload is increased, then the miss rate and false alarm rate for IED detection
Methods
Participants
The participants for this study were Marine Corps personnel who ranged in rank from Marine Lance Corporal through Staff Sergeants (E3-6) with a minimum of two combat deployments to Operation Enduring Freedom (OEF) or Operation Iraqi Freedom (OIF). All participants had heavy vehicle driver experience in an MRAP, Stryker, Abrams, Bradley or Heavy Equipment Transporter (HET) during at least one deployment. All volunteers were licensed and qualified drivers. Participants were U.S. citizens between the ages of 20 and 30. They had normal or corrected to normal vision and normal hearing. Fourteen military volunteers participated in this study (N = 14).
All participants were recruited on a voluntary basis from Camp Lejeune, North Carolina. There was no compensation for participation nor were individuals penalized for not participating. All
participants signed informed consent documents in order to demonstrate their agreement to participate in the study. Individual identification numbers were used to protect the identity of the participants.
Materials
This mental workload study utilized subjective and physiological (objective) metrics to collect Warfighter workload data while using a Ride Motion Simulator (RMS). Subjective data were collected via the Modified Cooper Harper (MCH) scale that participants filled out to monitor their perceived workload level after specific events occurred throughout the simulator drive. Physiological data were collected from electroencephalography (EEG) and eye trackers were used to eye characteristics, such as blink rate, blink duration, saccade length, saccade duration and fixation duration. The physiological metrics were continuously recorded throughout the entire experiment.
Video data were captured using video cameras mounted on the inside cabin of the simulator. Audio data were also recorded in order to capture responses and communications from the participant.
Ride Motion Simulator
The Ride Motion Simulator (RMS) is a six degree-of-freedom motion-based simulator capable of reproducing the dynamics of military ground vehicles over a vast array of terrains (Figure 1) seen by current force vehicles. Located at the Tank and Automotive Research, Development and Engineering Center (TARDEC) in Warren, Michigan, the simulator is comprised of a platform mounted on a hexapod design base producing longitudinal, lateral, vertical, roll, pitch, and yaw motion. The simulator cab is re-configurable and has the capability to collect performance data. The RMS has been safety certified to permit use by soldiers and experimenters.
Figure 1: Ride Motion Simulator (RMS)
The simulation environment was constructed to present participants with visual, motion and audio cuing to recreate a realistic driving experience. The simulator cab was configured with a Surrogate
Common Crew Station which includes a vehicle seat, a seat belt, a yoke, and flat panel displays. The temperature was typically normal room temperature. Audio cuing was limited to presenting the participant with the commander’s voice and the vehicle’s sounds (engine noise correlated to engine
The driving scenario consisted of driving through a simulated environment which consisted of four segments. The driving course between two checkpoints was classified as one segment. The order of segment presentation was the same across all participants. The difficulty of the terrain and frequency of communications and IED placements increased from segment one to segment four. Participants
experienced relatively easy driving conditions at the start of the experiment, concluding with a full ambush by the end of the experiment. The increase in the frequency of events and difficulty of the driving environment was intended to increase the participant’s workload.
Modified Cooper Harper (MCH) Scale
Subjective mental workload data were collected using the MCH scale. An example of the scale that was used in this experiment can be found in Appendix C. The MCH scale uses a decision tree to record an individual’s perception of the workload associated with specific, preselected tasks or series of
events. For this experiment, in order to minimize interference with the scenario, the scale shown in Appendix C was administered verbally after each of the four segments during the experiment. The MCH was administered at the latter checkpoint of each segment and was intended to reflect the workload experienced between that checkpoint and the previous one of each segment.
Electroencephalography (EEG)
both orbital fossa (HEOG). These eye movements were recorded to determine which specific aspects of the EEG recordings were directly attributed to eye movements.
Figure 2: EEG BioSemi electrode cap system
Blink Frequency/Duration
Participants’ blinks, fixations, and saccades were recorded via a camera-based, non-contact
tracking system shown in Figure 3. This system allows for observing the natural participant eye and head movement behavior at adequate spatial resolution (approximately 0.5o). Eye and head movements and measurement reliability data were recorded in real time and synchronized with the other data measures.
Tasks and Stimuli
The simulation environment was constructed to present participants with visual, motion, and audio cuing to recreate a realistic driving experience. Volunteers for this experiment served as the role of a vehicle driver. They were seated at a crew station, and were able to control the direction and speed of the vehicle as it navigated through a simulated environment. The experiment simulated a Stryker, or light-skinned combat vehicle, traversing cross-country terrain with maximum acceleration not exceeding 2 g's (g = acceleration due to gravity, 9.8 m/s2). The motions experienced by the test volunteers did not exceed ranges beyond ± 20 inches in the translational directions and ± 20 degrees. The simulator’s safety
interlock system was set to ensure that the ride motion did not exceed these position or acceleration levels. The driver was equipped with a headset that allowed audio communication to be presented to them in order to simulate the dynamic communications among members of the battalion. Experimenters were also able to communicate through the audio communication system, as well as maintain sight of the participants via camera views and direct vision, at all times throughout the experiment.
Design
Participants performed a primary task with secondary tasks. The primary task was driving and the secondary tasks were communications and IED detection. These tasks were all consistent with M-ATV driver tasks where vehicle operation is the primary task and the secondary tasks are monitoring communications and making return calls, in addition to monitoring and avoiding known, suspected, and unknown IED emplacements, as workload permits.
The experimental design was 2 x 2 within-subjects design. The within-subjects approach was chosen because of the limited number of experienced operators available to support this research. The independent variables were communications activity (Comms) and IED detectio