International Journal of Innovative Technology and Exploring Engineering (IJITEE) ISSN: 2278-3075, Volume-9 Issue-1, November 2019
Abstract: Semiconductor industry and the process involved in fabrication play a major role in a modern technology whatever the field may be. In this paper, the study discusses about the complete process flow of the IC fabrication and the interdependence of each steps involved. Seven important process flow steps have been considered and explained throughout this study. In particular, the present work inspects comprehensively the correlation between each process steps by using fuzzy DEMATEL technique. The fabrication steps have been separated as cause and effect groups, for the readers to get a good understanding of a inter relationship between the seven process steps. The result has proved that the market requirement (C1), the complexity of the fabrication process (C3) and the streamline of supply chain and time to market (C7) fall under causal group and cost to customer , design , customization , testing yield , packaging fall under effect group. The research analysis by fuzzy DEMATEL method has been demonstrated as an efficient approach in the inter relationship studies.
Index Terms: DEMATEL, IC fabrication, yield ,process steps
I. INTRODUCTION
Integrated Circuit (IC) design and fabrication has an important role in modern society like industrial application, telecommunication, smart household appliances and daily computing needs. Chip fabrication techniques and technology have been continually improved for manufacturing small devices with improved performance. Most of the semiconductor companies spend a considerable portion of their revenues and time on the research and development part of the process. This paper is written with the purpose of a). Explaining the important process steps involved in fabrication b). The interrelation among each step c). Analyzing the cause and effects groups by means of fuzzy DEMATEL method. The Decision Making Trial and Evaluation Laboratory (DEMATEL) technique is used to define and differentiate the cause and effects among the fabrication process steps and to provide understandings on how the interrelation affects each other and help in successful final result.
II. THE FUZZY DEMATEL METHOD
As complexity arises in the problem, an efficient decision is always favored. Decision-makers bound to assess complex and unclear concepts to recognize the underlying correlation of a problem to make insightful and efficient assessment. In order to craft a meaningful conclusion, it is necessary to value the causal link of the problem in uncertain environment. It is difficult job to confine the causal relationship. The
Revised Manuscript Received on November 06, 2019.
Velmathi Guruviah, School of Electronics Engineering, Vellore Institute of Technology, Chennai, India.
Felix Augustin, Division of Mathematics, School of Advanced Sciences, Vellore Institute of Technology, Chennai, India.
DEMATEL technique is a promising tool, developed by Fontela and Gabus in 1972 [4, 5] to study the causal relationship. Matrices and digraphs have been used to picture the complex structures in fuzzy decision makings. The traditional DEMATEL technique solves only the problem which contains crisp value either 0 or 1 to afford the interrelations between factors, whereas in real-life environments, the problem on interrelated factor investigation involves ambiguous information. Thus, fuzzy DEMATEL technique has been extended by different fuzzy numbers by the researchers Lin (2008), Lin (2004), Tseng (2007, 2009) and Devadoss (2013) [6, 7, 10, 11, 2].
DEMATEL is a powerful comprehensive method which helps the researchers to divide the criteria involved in any problem into groups of cause and effects based on the direct and indirect relationship and strength of influence among all the parameters/factors of the system on the basis of matrix calculation. In the following section, necessary definitions related to fuzzy set theory have been called out.
2.1 Fuzzy Set theory
Fuzzy set handles uncertainties and vagueness of human judgments in the event of providing profound judgments. Decision makers’ asses and come to a decision through past experiences and facts. Their assessments are frequently delivered in the form of linguistic term. In order to incorporate a variety of experiences, opinions of an individual decision maker, linguistic terms need to be converted into fuzzy numbers to make thoughtful decision. Hence, the need of fuzzy logic is vital when uncertainty of the problem increases.
Definition 2.1. Fuzzy set is a mapping from the universal set to [0, 1] or is an ordered tuple( , ( ))
A
x x where x is a member
of universal set and A( )x is a membership grade whose
value lies in [0, 1] which gives the closeness of an element belonging to the fuzzy set. Fuzzy set holds significant properties like convex, piece wise continuous and normal. Definition 2.2.Fuzzy number is a fuzzy set in real numbers, a mapping
:
[0,1]
, holds the following properties: i.µ is convex, i.e.( )
x
min( ( ), ( )), for
y
z
y
x
z
ii.µ is normal, i.e. there exists some x in
such that( )
x
1
iii.
µ is piecewise continuous.Definition 2.3. The α-cut in the fuzzy set
A
is defined to be a set of input elements from the universe of discourse X whose membership value is greater than or equal to α. Mathematically, it is writtenIC Fabrication Process Steps Analysis using
Fuzzy DEMATEL Method
as
A
{
x
X
/
A( )
x
}
, where
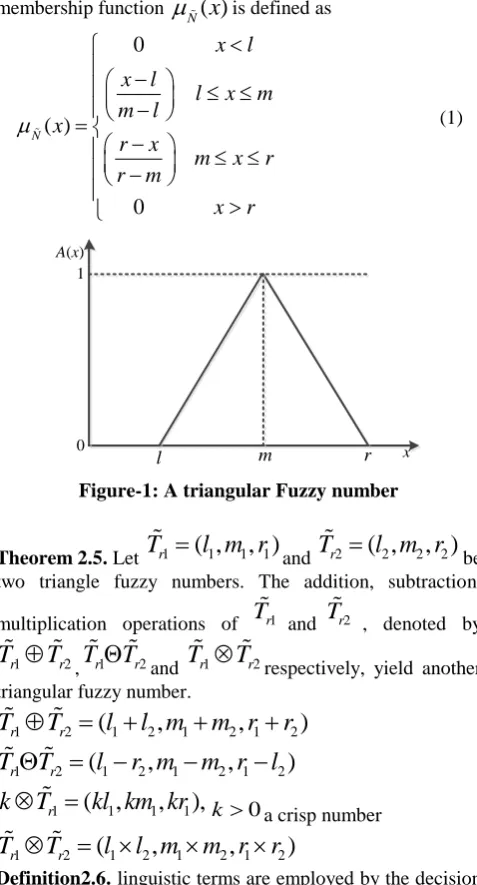
0,1 .Definition 2.4. A triangular fuzzy number
N
can be defined as a triplet (l, m, r) ϵ
such thatl
m
r
.
and its membership function
N( )
x
is defined as0
( )
0
N
x
l
x l
l
x
m
m l
x
r
x
m
x
r
r
m
x
r
(1)
l m r x
A(x) 1
[image:2.595.49.288.104.547.2]0
Figure-1: A triangular Fuzzy number
Theorem 2.5. Let
T
r1
( ,
l m r
1 1, )
1 andT
r2
( ,
l m r
2 2, )
2 be two triangle fuzzy numbers. The addition, subtraction,multiplication operations of
T
r1 andT
r2 , denoted by1 2
r r
T
T
,
T
r1
T
r2andT
r1
T
r2respectively, yield another triangular fuzzy number.1 2
(
1 2,
1 2,
1 2)
r r
T
T
l
l m
m r
r
1 2
(
1 2,
1 2,
1 2)
r r
T
T
l
r m
m r
l
1
(
1,
1,
1),
r
k
T
kl km kr
k
0
a crisp number
1 2
(
1 2,
1 2,
1 2)
r r
T
T
l
l m
m r
r
Definition2.6. linguistic terms are employed by the decision makers to describe the level of input parameters in the decision making techniques. And the membership function bridges linguistic variables and fuzzy numbers. Usually, linguistic terms are represented by the fuzzy numbers such as triangular, trapezoidal, Gaussian, etc.,(Zadeh, 1975) [13].
Table 1: The Fuzzy linguistic scale
Linguistic terms Triangular fuzzy numbers Very Low influence
Low Influence Medium High Influence Very High Influence
(0, 0, 0.25) (0, 0.25, 0.50) (0.25, 0.50, 0.75) (0.50, 0.75, 1) (0.75, 1, 1)
Domain experts provide views/opinions in the form of colloquial terms which are known as linguistic terms when there is no clear information about the problem. These vague linguistic terms are represented as input parameters in decision making process which are further represented by different fuzzy numbers [13]. Triangular fuzzy numbers are most commonly used by researchers. In fuzzy inference
system, final fuzzy value can be defuzzified into crisp value. The conversion of Fuzzy data into Crisp Scales (CFCS) technique has been introduced by Opricovic, et.al (2003) [8].
3. Fuzzy DEMATEL method
In the following section, the DEMATEL technique is proposed using CFCS method.
DEMATEL Process:
Step1 Setup the initial linguistic direct- relation matrixXˆk[xˆkij n n] , k = 1, 2, …, n
Let C={C1, C2,..., Cn}be a finite number of attributes and
E={E1, E2,..., Em} be the fixed number of domain experts.
Afterward, Experts provide views on the interrelation between the attributes in the form of linguistic terms from the linguistic set L={Very Low, Low Influence, Medium, High Influence, Very High Influence}. Let
x
ˆ
kij represents the intensity of the correlation between the attributes Ciand Cj.Here,
x
ˆ
kij
' '
denotes there is no relation.ˆ
[
ˆ
]
k kij n n
X
x
given by expert
E
k can be set up, i.e.,1
C
C
2
C
nˆ
[
ˆ
]
k kij n n
X
x
1
2
n
C
C
C
12 1
21 2
1 2
ˆ
ˆ
ˆ
ˆ
ˆ
ˆ
k k n
k k n
kn kn
x
x
x
x
x
x
, k=1,2,…,m
Step 2: Convert uncertain linguistic
matrix
ˆ
[
ˆ
]
k kij n n
X
x
into triangular fuzzy matrix
.
[
]
n nk kij
X
x
Step 3: Convert triangular fuzzy matrix into the crisp value matrix
X
i, (
i
1, 2,..., )
m
through the CFCS method.Let
( ,
,
)
k k k
ij ij ij ij
A
l m r
mean the degree of criteria j is affected by the criteria i and experts k (i=1, 2, 3…m).
Normalization max min
(
min )
k k k
ij ij ij
yr
r
l
max
min
(
min )
k k k
ij ij ij
ym
m
l
max
min
(
min )
k k k
ij ij ij
yl
l
l
Where max
min
max
min
k k
ij ij
r
l
Determine the normalized values of right side and left side:
(1
)
k k k k
ij ij ij ij
yrs
yr
yr
ym
(1
)
k k k k
ij ij ij ij
yls
ym
ym
yl
Compute total normalizes crisp values:
[
(1
)
] [1
]
k k k k k k k
ij ij ij ij ij ij ij
y
yls
yls
yrs
yrs
yls
yrs
Compute crisp
International Journal of Innovative Technology and Exploring Engineering (IJITEE) ISSN: 2278-3075, Volume-9 Issue-1, November 2019
max min
min
k k k
ij ij ij
x
l
y
Step 4: Set up the group direct relation matrix
.
[
]
n nk kij
X
x
1 2
1
(
...
m)
k
X
X
X
X
m
Step 5: Construct normalized relation matrix
[
]
.
k kij n n
Z
z
1
1
max
, ,
1, 2,...,
nij ij i n ij
j
z
x
x
i j
n
Step 6: Assemble the total-relation matrixT.
The total-relation matrix T is defined as
1 2
lim ( )
( )
...
( )
T
Z
Z
Z
Step 7: Calculate the prominence and relation of each factor. In the total-influence matrixT, the sum of rows and the sum of columns are symbolize by H and D, respectively
Let Hi denote the total intensity of correlation between Ci and
Cj influences others and it can be calculated by
1
,
1, 2...
n
i ij
j
H
t
i
n
. Let Di denote the total intensity
that attribute Ci is influenced by others, and it can be obtained
by 1
,
1, 2...
n
i ji
j
D
t
i
n
Let pibe the importance of criteria Ci, and it is evaluated
by
p
i
H
i
D
i, 1 1, 2,...
n
The importance of attribute Ci is determined based on
prominence pi. The large pi is the more important factor Ci. If
the prominence of an attribute is greater, then the decision maker is supposed to pay more concentration to it.
Let ri be the link of attribute Ci and is calculated by
, 1 1, 2,...
i i i
r
H
D
n
Relation ri is used to judge the role of attribute Ci, if ri>0, then
Ci is a cause attribute.
If ri<0, then Ci is an effect attribute.
Step 8: Construct the causal diagram.
Causal chart can be graphed to picture the prominence and categorization of all factors with respect to pi and ri. In the
causal graph, horizontal axis P denotes the significance of factors while the vertical axis R denotes the type of factors.
Linguistic initial direct- relation
Transform into triangular fuzzy number
Crisp value direct-relation
Group uncertain direct relation
Normalizing
overall-relation
Determine the Prominence and Relation
Construct the causal diagram
Experts
Causal diagram Fuzzy DEMATEL
Figure-2: Procedure of Fuzzy DEMATEL III. EMPIRICAL STUDY AND NUMERICAL ANALYSIS This section involves the identification of the core IC fabrication steps and measures the relationship among them and the apply fuzzy DEMATEL method of analysis to get the result. Totally seven critical influence factors were identified though expert interviews done among the scientists who had worked in Fab Labs in institutes like Indian Institute of Science (IISc) and Indian Institute of technology (IITs).
3.1.1 Market requirement (C1)
Semiconductor industry keeps updating itself from the mainframe to mini and PC to smartphone, where the computing devices getting cheaper,smaller and faster. Each of these transitional stage depended on advances in IC technology leads to sophisticated SOC-system on a chip. New companies emerged at each transitional stage,became dominant and drove the next iteration, outcompete the market share and profits. For example currently Internet of things (IoT) is the one which transforms the semiconductor industry to the next stage.However it is different this time.IoT-oriented chip market is highly diverse than depending on a single kind of devices. Semiconductors are needed for IoT which includes cloud computing, connectivity, communications and sensors .The market requirements are always the drive for the semiconductor industry to move to the next generation of their devices and Chips.
3.1.3 Fabrication process Complexity (C3)
IC industry is ranked based on its ability to produce huge number of small devices with integrated functionalities. Most of the other manufacturing processes are tightly coupled with the item they manufacture, whereas IC industry is fairly versatile. Simply by modifying few basic tools named masks different circuit types like CMOS, bipolar can be fabricated. Since the integrated circuit fabrication has so much of leverage, a huge number of parts can be fabricated with some standard procedures which improve IC manufacturing in a great way. However the cost of the designing goes up when the complexity of the design is increased and hence the overall cost of the chip too increased.
3.1.4 Customizing the design for different application (C4)
Both microwave oven controllers and microprocessors will be made by a single CMOS fabrication plant will make by modifying the masks whichhelps lithography process to make the patterns of transistors and wires on the chips. Keeping high performance complex functions on a single chip facilitates many applications possible. For example, high-speed numeric computation is done by single-chip floating point processors offers inexpensive personal computers.
3.1.5 Testing – Yield – Packaging (C5)
Decision to discard the defective parts by testing is an important process step in the IC manufacturing site. Testing and testability of a developed product is an essential one to understand the final yield calculations at the foundry. The yield of a chip depends on its functional as well as parametric sensitivity to different kinds of defects. As the size of the chip goes smaller the packaging too gets smaller. The fastest IC emits more heat and the packaging become more challenging as the heat dissipation increases and hence the cost of the packaging. As the pinout counts and chip complexity increase, reducing material costs becomes a pressing issue in packaging plants. Most industry managers accepts the fact that the packages themselves and other materials such as lead frames are quickly becoming the biggest cost in assembly, surpassing capital equipment costs and plant depreciation.
3.1.6 Cost to the customer (C6)
Cost reduction can be realized by improving packaging platforms, changes in processes and design methods. Minimizing the cost of the chip is always one of the design team’s highest priorities. By reducing the die size and the number of required mask layers the overall cost of the chip can get reduced.. The size of contemporary chip designs is often limited by the availability of metal resources (or routing capacity), and a chip’s performance (in the maximum attained operating frequency) is often limited more by routing than by its circuits. More the market demand, higher the production chip makers produce chips to sell at rock bottom prices.
3.1.7 Streamline of supply chain and time to market (C7)
The efficiency of the proper supply chain helps any industry reduce the cost to the customers and speed up the availability of the product in the market in time. Streamlining the supply chain has become more important due to the rise in customer expectation and the increase in globalization.The IC industry use complex and collaborative supply chain structure
to satisfy the increasing market demand and make the product to the market on time with the possible lowest cost.
3.2 Adaptation of the Problem Fabrication Process to DEMATEL method
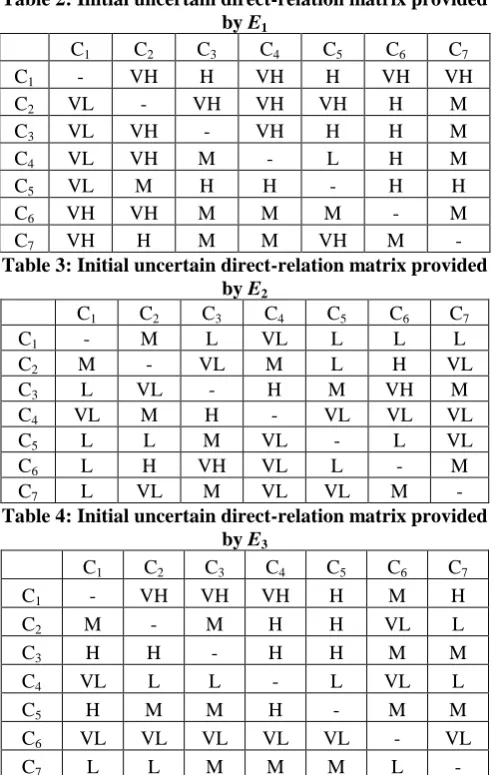
[image:4.595.304.551.230.618.2]Based on the seven important competences explained above, the research employed the DEMATEL method to find out the inter dependence of each competences. A questionnaire has been designed for collecting data and given for expert scientists to answer A pairwise comparison was generated in the form of matrix with influences represented as – No , Low influence (L),Very low influence (VL) , High influence (H),Very High influence (VH) and Medium (M). The preliminary average of 3 experts direct influence matrix collected is shown in Table 2-Table 4.
Table 2: Initial uncertain direct-relation matrix provided by E1
C1 C2 C3 C4 C5 C6 C7
C1 - VH H VH H VH VH
C2 VL - VH VH VH H M
C3 VL VH - VH H H M
C4 VL VH M - L H M
C5 VL M H H - H H
C6 VH VH M M M - M
C7 VH H M M VH M -
Table 3: Initial uncertain direct-relation matrix provided by E2
C1 C2 C3 C4 C5 C6 C7
C1 - M L VL L L L
C2 M - VL M L H VL
C3 L VL - H M VH M
C4 VL M H - VL VL VL
C5 L L M VL - L VL
C6 L H VH VL L - M
C7 L VL M VL VL M -
Table 4: Initial uncertain direct-relation matrix provided by E3
C1 C2 C3 C4 C5 C6 C7
C1 - VH VH VH H M H
C2 M - M H H VL L
C3 H H - H H M M
C4 VL L L - L VL L
C5 H M M H - M M
C6 VL VL VL VL VL - VL
C7 L L M M M L -
Using the Direct influence entries, the direct relation matrix shown in table 5 and Table 6 have been obtained by the process explained in section 2.
Table-5: the group direct relation matrix
C
1C
2C
3C
4C
5C
6C
7C
1 0.00 00.81 1
0.65 6
0.66 1
0.57 8
0.57 8
0.65 6
C
2 0.35 00.00 0
0.50 6
0.73 3
0.65 6
0.50 5
0.27 2
C
3 0.35 00.58 3
0.00 0
0.81 1
0.65 5
0.73 3
International Journal of Innovative Technology and Exploring Engineering (IJITEE) ISSN: 2278-3075, Volume-9 Issue-1, November 2019
[image:5.595.48.293.49.138.2]C
4 0.05 0 0.57 8 0.50 0 0.00 0 0.19 5 0.27 8 0.27 2C
5 0.35 0 0.42 2 0.57 8 0.50 5 0.00 0 0.50 0 0.42 8C
6 0.42 8 0.58 3 0.50 6 0.20 0 0.27 2 0.00 0 0.35 0C
7 0.50 0 0.35 0 0.50 0 0.35 0 0.50 6 0.42 2 0.00 0Table-6: The Normalized direct relation matrix
C
1C
2C
3C
4C
5C
6C
7C
1 0.000 0.244 0.197 0.199 0.173 0.1740.19 7
C
2 0.105 0.000 0.152 0.220 0.197 0.1520.08 2
C
3 0.105 0.175 0.000 0.244 0.197 0.2200.15 0
C
4 0.015 0.174 0.150 0.000 0.058 0.083 0.08 2C
5 0.105 0.127 0.173 0.152 0.000 0.150 0.12 8C
6 0.129 0.175 0.152 0.060 0.082 0.000 0.10 5C
7 0.150 0.105 0.150 0.105 0.152 0.1270.00 0
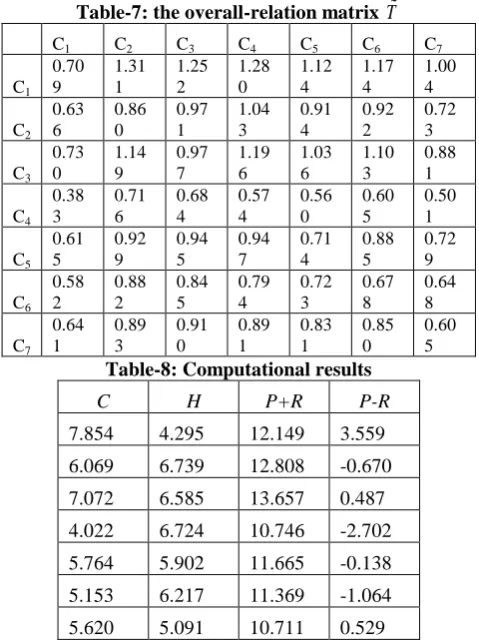
Table 7 and 8 present the total influence matrix and the computational results respectively.
Table-7: the overall-relation matrix T
C1 C2 C3 C4 C5 C6 C7
C1 0.70 9 1.31 1 1.25 2 1.28 0 1.12 4 1.17 4 1.00 4 C2 0.63 6 0.86 0 0.97 1 1.04 3 0.91 4 0.92 2 0.72 3 C3 0.73 0 1.14 9 0.97 7 1.19 6 1.03 6 1.10 3 0.88 1 C4 0.38 3 0.71 6 0.68 4 0.57 4 0.56 0 0.60 5 0.50 1 C5 0.61 5 0.92 9 0.94 5 0.94 7 0.71 4 0.88 5 0.72 9 C6 0.58 2 0.88 2 0.84 5 0.79 4 0.72 3 0.67 8 0.64 8 C7 0.64 1 0.89 3 0.91 0 0.89 1 0.83 1 0.85 0 0.60 5 Table-8: Computational results
C H P+R P-R
7.854 4.295 12.149 3.559
6.069 6.739 12.808 -0.670
7.072 6.585 13.657 0.487
4.022 6.724 10.746 -2.702
5.764 5.902 11.665 -0.138
5.153 6.217 11.369 -1.064
5.620 5.091 10.711 0.529
Finally using the formulas explained in section 2, by mapping the data set of ( P+R, P-R) 2 the causal diagram has been drawn and shown in figure 3
Figure :3 Causal diagram IV. CONCLUSION
The important 7 competences were identified by experts’ interviews and literature reviews. DEMATEL technique has been adapted to this case study to investigate the causal relationships among the various fabrication process steps involved in semiconductor industry. However, as chips design goes more complex, the designing cost of a chip goes up and will share major part of the overall cost of the chip. The study reveals that the consumer demand ie. The market requirement (C1), the complexity of the fabrication process (C3) and the streamline of supply chain and time to market (C7) fall under causal group and cost to customer , design , customization , testing yield , packaging fall under effect group. The complexity of the fabrication process cause Designing , customizing, testing, packaging as a challenging tasks. As the market demand increases and if the supply chain goes smoothly the production will go very high and as a result the cost to the customer gets reduced drastically. This research helps to provide a better perception of IC industry business plans and fabrication process in an analytical way.
REFERENCES
1. Araz, C., &Ozkarahan, I. (2007). Supplier evaluation and management system for strategic sourcing based on a newmulticriteria sorting procedure, International Journal of Production Economics, 106(2), 585–606.
2. Devadoss AV., Felix, A., (2013). A new Fuzzy DEMATEL method in an uncertain linguistic environment, Advances in Fuzzy Sets and Systems, 16(2), 93-123.
3. Gabus A, Fontela E, (1972). World problems an invitation to further thought within the framework of DEMATEL, Battelle Geneva Research Centre, Geneva.
4. Gabus A, Fontela E, (1973). Perceptions of the world problematique: communication procedure, communicating with those bearing collective responsibility (DEMATEL Report no.1). Battelle Geneva Research Centre, Geneva.
5. International technology roadmap for semiconductor: http://public.itrs.net.in , 2005.
6. Lin, W, (2004). A fuzzy extension of the dematel method for group decision-making. McGraw Hill, New York, USA.
7. Lin, W, (2008). A causal analytical method for decision making under fuzzy environment, Expert System with Applications, 34, 205-213. 8. Opricovic, S & Tzeng G.H.
[image:5.595.302.556.50.210.2] [image:5.595.49.289.344.665.2]Uncertainty, Fuzziness and Knowledge-based Systems, 11(5), 635- 652.
9. Sevkli. M, Koh. S.C.L, Zaim. S, Demirbag. M and Tatoglu. E (2008). Industrial Management & Data Systems, 108(1), 122-142.
10. Tseng ML, (2009). A causal and effect decision making model of service quality expectation using grey-fuzzy DEMATEL approach. Expert System with Applications 36(4):7738–7748.
11. Tzeng GH, Chen WH, Yu RC, Shih ML, (2010). Fuzzy decision maps: a generalization of the DEMATEL methods, Soft Computing 14(11):1141–1150.
12. Zadeh LA, (1965). Fuzzy sets, Information Control 8(3):338–353. 13. Zadeh LA, (1975). The concept of a linguistic variable and its
application to approximate reasoning (Part II), Information Science, 8, 301–357.
AUTHORSPROFILE
Dr.Velmathi Guruviah, Professor in School of Electronics Engineering, VIT , Chennai currently in the research of IC technology, MEMS and Biomedical Instrumentation. She had done her Fabrication work in Indian Institute of science as part of her doctoral work.