https://doi.org/10.5194/bg-15-1775-2018 © Author(s) 2018. This work is distributed under the Creative Commons Attribution 4.0 License.
Carbon dioxide emissions from the flat bottom and shallow
Nam Theun 2 Reservoir: drawdown area as a neglected
pathway to the atmosphere
Chandrashekhar Deshmukh1,2,3,a, Frédéric Guérin1,4,5, Axay Vongkhamsao6, Sylvie Pighini6,b,c, Phetdala Oudone6,d, Saysoulinthone Sopraseuth6, Arnaud Godon6,e, Wanidaporn Rode6, Pierre Guédant6, Priscia Oliva1,
Stéphane Audry1, Cyril Zouiten1, Corinne Galy-Lacaux2, Henri Robain7, Olivier Ribolzi1, Arun Kansal3, Vincent Chanudet8, Stéphane Descloux8, and Dominique Serça2
1Géosciences Environnement Toulouse (GET), Université de Toulouse (UPS), 14 Avenue E. Belin, 31400 Toulouse, France 2Laboratoire d’Aérologie, Université de Toulouse, CNRS UMR 5560, 14 Av. Edouard Belin, 31400, Toulouse, France 3Centre for Regulatory and Policy Research, TERI University, New Delhi, India
4IRD, UR 234, GET, 14 Avenue E. Belin, 31400, Toulouse, France
5Departamento de Geoquimica, Universidade Federal Fluminense, Niterói, Brasil
6Nam Theun 2 Power Company Limited (NTPC), Environment & Social Division, Water Quality and Biodiversity Dept.,
Gnommalath Office, P.O. Box 5862, Vientiane, Lao PDR
7IRD, iEES-Paris, Centre IRD France-Nord, 32 avenue Henri Varagnat, 93143 Bondy CEDEX, France 8Electriciteì de France, Hydro Engineering Centre, Sustainable Development Dpt., Savoie Technolac,
73373 Le Bourget du Lac, France
anow at: Asia Pacific Resources International Limited (APRIL), Indonesia
bnow at: Innsbruck University, Institute of Ecology, 15 Sternwartestrasse, 6020 Innsbruck, Austria cnow at: Foundation Edmund Mach, FOXLAB-FEM, Via E. Mach 1, 38010 San Michele all’Adige, Italy dnow at: Department of Environmental Science, Faculty of Environmental Sciences,
National University of Laos, Vientiane, Lao PDR
enow at: Arnaud Godon Company, 44 Route de Genas, Nomade Lyon, 69003 Lyon, France
Correspondence:Frédéric Guérin (frederic.guerin@ird.fr)
Received: 4 September 2017 – Discussion started: 22 September 2017
Revised: 30 January 2018 – Accepted: 9 February 2018 – Published: 26 March 2018
Abstract. Freshwater reservoirs are a significant source of CO2 to the atmosphere. CO2is known to be emitted at the
reservoir surface by diffusion at the air–water interface and downstream of dams or powerhouses by degassing and along the river course. In this study, we quantified total CO2
emis-sions from the Nam Theun 2 Reservoir (Lao PDR) in the Mekong River watershed. The study started in May 2009, less than a year after flooding and just a few months after the maximum level was first reached and lasted until the end of 2013. We tested the hypothesis that soils from the draw-down area would be a significant contributor to the total CO2
emissions.
Total inorganic carbon, dissolved and particulate organic carbon and CO2concentrations were measured in 4 pristine
rivers of the Nam Theun watershed, at 9 stations in the reser-voir (vertical profiles) and at 16 stations downstream of the monomictic reservoir on a weekly to monthly basis. CO2
bubbling was estimated during five field campaigns between 2009 and 2011 and on a weekly monitoring, covering water depths ranging from 0.4 to 16 m and various types of flooded ecosystems in 2012 and 2013. Three field campaigns in 2010, 2011 and 2013 were dedicated to the soils description in 21 plots and the quantification of soil CO2emissions from the
drawdown area. On this basis, we calculated total CO2
the year, from 40 to 75 % of total annual gross emissions in this flat and shallow reservoir. Since the CO2 emissions
from the drawdown zone are almost constant throughout the years, the large interannual variations result from the signif-icant decrease in diffusive fluxes and downstream emissions between 2010 and 2013. This overlooked pathway in terms of gross emissions would require an in-depth evaluation for the soil organic matter and vegetation dynamics to evaluate the actual contribution of this area in terms of net modifica-tion of gas exchange in the footprint of the reservoir, and how it could evolve in the future.
1 Introduction
Carbon dioxide (CO2) emissions from inland waters were
recently revisited and it appears that emissions from fresh-water reservoirs contribute significantly despite the dispro-portionally small surface area of these systems (Barros et al., 2011; Raymond et al., 2013; Deemer et al., 2016). The CO2 production and subsequent emissions in reservoirs
re-sult from the degradation of the flooded organic matter (OM) and the OM originating from the watershed (Galy-Lacaux et al., 1997b; Abril et al., 2005; Guérin et al., 2008; Barros et al., 2011; Teodoru et al., 2011). As the amount of labile OM originating from the flooded soils and biomass decreases with time due to the progressive mineralization of the carbon stock, emissions decrease progressively with reservoir age-ing (Abril et al., 2005; Barros et al., 2011). CO2emissions
are higher in tropical reservoirs than in temperate and boreal ones, a latitudinal difference attributed to the enhancement of OM degradation with temperature (Barros et al., 2011; Marotta et al., 2014; Yvon-Durocher et al., 2014). Emissions occur through diffusion at the air–water interface of the reser-voir and from rivers downstream of dams (Abril et al., 2005; Guérin et al., 2006; Kemenes et al., 2011). At the surface of reservoirs, it is well known that emissions significantly vary spatially and temporally. Spatial variations can be higher than temporal variations (Roland et al., 2010; Teodoru et al., 2011; Zhao et al., 2013; Pacheco et al., 2015). Thus, the integration of both temporal and spatial variations is mandatory for the determination of accurate emission factors.
In some reservoirs with large water-level variations, large surface areas of soils known as drawdown zones are peri-odically exposed to the atmosphere (for example, the Three Gorges and Nam Theun 2 reservoirs). Recently, the impor-tance of the drawdown emissions was pointed out as a signif-icant source of CH4in the Three Gorges Dam in China (Chen
et al., 2009, 2011; Yang et al., 2012) and a very minor source at Nam Theun 2 Reservoir (NT2R; Serça et al., 2016). CO2
emission from the drawdown area was only measured in agri-cultural plots of the drawdown area of the Three Gorges Dam (Li et al., 2016). However, the hypothesis of significant CO2
emissions from those soils seasonally flooded and exposed to
air was never tested in unmanaged drawdown areas represen-tative of tropical reservoirs with large water-level variations. In the present study, we measured CO2, organic and
inor-ganic carbon concentrations and physico-chemical parame-ters at 9 stations in the NT2R and 16 stations downstream of the dam and the powerhouse. This weekly to fortnightly sam-pling was conducted in order to estimate emissions from the reservoir surface and downstream emissions during 4.5 years of monitoring after impoundment. We also measured CO2
emissions from the large drawdown area of the NT2R that represented seasonally up to 65 % of the maximum reservoir area during the study. The spatial, seasonal and interannual variation in emissions by all of the above-listed pathways and their contribution to total gross CO2emissions will be
dis-cussed.
2 Material and methods 2.1 Study site
The NT2R is located in the Lao People’s Democratic Re-public (Lao PDR), it was impounded in April 2008 and was commissioned in April 2010. It floods 489 km2of very di-verse types of ecosystems including forest, agricultural soils and wetlands (Descloux et al., 2011). Geological formations responsible for the soil development in the NT2R area are mainly composed of more or less consolidated sedimentary rocks (Lovatt Smith et al., 1996; Smith and Stokes, 1997). The parental rocks belong to the Khorat group and Phon Hong group formations (Cretaceous) with two main litholo-gies: (1) late cretaceous Maha Sarakham formation (i.e. evap-orites and mudstones) and (2) aptian Khot Kruat forma-tion (i.e. mainly fluvial formaforma-tion of red siltstones and sand-stones)
The NT2R, described in detail in Descloux et al. (2016); Deshmukh et al. (2016) and Guérin et al. (2016) is under the influence of a monsoon subtropical climate with three main seasons: the cold dry season (CD, from mid-October to February), the warm dry season (WD, from mid-February to mid-June) and the warm wet season (WW, from mid-June to mid-October). Owing to the large seasonal vari-ations in the river discharges in the region, the reservoir area ranged seasonally between 489 km2 in the WW sea-son and 170 km2in the WD season during the course of the study. Conversely, the surface of the drawdown area reached its maximum (320 km2)when the water level was the low-est. During the monitoring, the wettest years were 2011 and 2013 with an average water discharge in the reservoir of
be-Figure 1.Map of the Nam Theun 2 monitoring network. The station names are defined by numbers and an abbreviated name as follow: RES standing for reservoir, NTH for Nam Theun River, NON for Nam On River, NXT for Nam Xot, NPH1 for Nam Phao River, TRC for tail race channel, REG for regulation pond, DCH for downstream channel, NKT for Nam Kathang River, NGM for Nam Gnom and XBF for Xe Bangfai River.
low the powerhouse and one below the Nakai Dam (Fig. 1). Except for during the occasional use of the spillways, only 2 m3s−1of water are discharged downstream of the Nakai Dam in the Nam Theun River and around 240 m3s−1are
[image:3.612.111.482.62.595.2]2.2 Sampling strategy
The CO2and O2concentrations in water and the water
tem-perature were determined in surface waters of six pristine rivers and three rivers under the influence of the reservoir (10 stations) and in the artificial channel (5 stations), whereas it was done along vertical profiles in the reservoir (9 stations) and the regulation pond (1 station; Fig. 1). At all sites located downstream of the powerhouse, sampling was done weekly (from March 2010 to December 2013), whereas it was done fortnightly in incoming pristine rivers and in the reservoir (from May 2009 to December 2013). The stations RES1– RES3 flooded dense forest, the stations RES4-RES6 flooded degraded forest, the station RES7 flood swamps and the sta-tion RES8 flooded a rice field area (Descloux et al., 2011; Guérin et al., 2016). The station RES9 is located at the wa-ter intake, an area of continuous vertical mixing of the wawa-ter column, where CH4 emissions are enhanced (Guérin et al.,
2016). Degassing of CO2 was calculated below the Nakai
Dam, just below the turbines at TRC1, below the regulating dam (RD in Fig. 1) and at the aeration weir (AW in Fig. 1). Bubbling of CO2was determined during five field campaigns
covering different seasons and sites in 2009, 2010 and 2011, and during a weekly monitoring from March 2012 to August 2013 at seven stations. In the drawdown area, soil description was conducted in June 2010 at six sites and CO2emissions
were repeatedly measured at 21 plots over those sites in June 2010, 2011 and 2013.
2.3 In situ measurements and water analysis
Vertical profiles of O2, pH and temperature were measured
in situ at all sampling stations with a multi-parameter probe Quanta®(Hydrolab, Austin, Texas) since January 2009. In the reservoir, the vertical resolution was 0.5 m down to 5 m and 1 m deeper. Surface and deep-water samples for CO2,
dissolved organic carbon (DOC), particulate organic car-bon (POC) and dissolved inorganic carcar-bon (DIC) concentra-tions were taken with a surface water sampler (Abril et al., 2007) and a UWITEC™sampling bottle, respectively. Water samples for CO2 determination were stored in serum glass
vials, capped with butyl stoppers, sealed with aluminium crimps and preserved (Guérin and Abril, 2007). CO2
concen-trations were determined by the headspace technique and us-ing the solubility coefficient of Weiss (1974) as in Guérin et al. (2006). The CO2partial pressure in the headspace was
de-termined by gas chromatography (GC; SRI 8610C gas chro-matograph, Torrance, CA, USA) equipped with a flame ion-ization detector and a methanizer (Chanudet et al., 2011). Commercial gas standards (400, 1000 and 3000 ppmv, Air Liquid “crystal” standards) were injected after every 10 sam-ples for calibration. The detection limit was < 1 ppmv in the headspace and duplicate injection of samples showed repro-ducibility better than 5 %. For TIC, DOC and POC analyses were performed with a Shimadzu TOC-VCSH analyser.
Fil-tered (0.45 µm, Nylon) and unfilFil-tered samples were analysed for TIC and total organic carbon (TOC). POC was calculated by the difference between TOC and DOC concentrations in unfiltered and filtered samples. The detection limit was 8 µmol L−1 and the uncertainty was 2.0 µmol L−1 in TOC and DOC and 2.8 µmol L−1in POC.
2.4 Organic and inorganic carbon inputs from the watershed to the reservoir
Carbon inputs were calculated on a monthly basis using monthly averages of the river discharge of the four main tributaries of the NT2R. The Nam Theun River contributed 32 % (27 m3s−1) of the total discharge, while Nam Xot (22 m3s−1), Nam On (19 m3s−1)and Nam Noy (25 m3s−1; not monitored for biogeochemistry) contributed 23, 22 and 24 %, respectively. For the Nam On River, the specific water discharge and POC, DOC, TIC and CO2from this river were
used. For the other rivers, the specific water discharge of each river was used together with the average DOC, POC, TIC and CO2from Nam Theun, Nam Phao and Nam Xot rivers
all located in the Nam Theun watershed. Note that the Nam Phao reaches the Nam Theun River downstream of the Nakai Dam but we used this dataset together with the ones from other rivers to calculate the carbon inputs since the physico-chemical parameters and carbon concentrations are not dif-ferent from other rivers in the watershed.
2.5 Diffusive fluxes and degassing
Diffusive fluxes at the air–water interface of the reservoir were calculated from the surface CO2 concentrations, wind
speed and rainfall rates using the gas transfer velocity formu-lations of Guérin et al. (2007) and MacIntyre et al. (2010) as already described for CH4fluxes from this reservoir
(Desh-mukh et al., 2014; Guérin et al., 2016). Based on physical modelling and in situ measurements (Chanudet et al., 2012), we determined that the station RES9 located at the water in-take is representative of an area of about 3 km2(i.e. 0.6 % of the reservoir water surface at full reservoir water level), what-ever the season (Guérin et al., 2016). This area was therefore used to extrapolate specific diffusive fluxes from this sta-tion. For other stations, diffusive fluxes are calculated with the daily meteorological parameters and reservoir water sur-face area from the capacity curve. Degassing downstream of the powerhouse, the regulating dam and the aeration weir, all located along the artificial channel and downstream of the Nakai Dam (Fig. 1), were computed using the CO2
concen-tration upstream and downstream of these civil structures and the water discharge as in Deshmukh et al. (2016) for CH4.
Table 1.Soil type and characteristics at the sampling station of the drawdown area of the Nam Theun 2 Reservoir (Lao PDR). KKK formation.
Catena Solum %N %C C:N pH Soil name WRB FAO Soil texture Lithology
NNR NNR upland 0.11 1.47 13.69±1.73 4.33 planosol sandy micaceous
NNR interm. down 0.10 1.32 13.55±1.84 endogleyic planosol quartzose
NNR shoreline 0.13 1.89 14.78±1.60 4.23 gleysol
RES3S RES3 upland 0.18 2.38 13.21±0.63 4.18 plinthosol clay red
RES3 interm. etagnic plinthosol mudstone
RES3 shoreline 0.17 1.95 11.21±0.56 4.88 plinthic stagnosol
RES2S RES2 upland 0.16 2.24 13.62±0.60 plinthic ferralsol sandy clay micaceous
RES2 interm. 0.20 2.30 11.25±0.50 “stagnic” ferralsol sandstone
RES2 shoreline 0.13 1.41 10.55±0.54 stagnosol
RES8S RES8 upland 0.08 1.76 23.47±3.95 acrisol sandy clay quaternary
RES8 interm. up 0.06 0.68 11.93±1.46 stagnic acrisol deposits
RES8 interm. down 0.09 1.31 13.99±1.99 stagnic acrisol
RES8 shoreline 0.12 2.02 17.07±1.93 endogleyic stagnosol
RES8’S RES8’ upland 0.05 0.77 16.15±2.30 acrisol sandy clay quaternary
RES8’ shoreline 0.08 1.51 18.22±2.79 endogleyic stagnosol deposits
RES4S RES4 upland 0.16 1.98 12.76±1.17 4.14 acrisol sandy clay micaceous
RES4 interm. up 0.13 1.92 14.66±1.58 stagnic acrisol sandstone
RES4 interm. down 0.12 1.67 14.33±1.71 stagnic acrisol
RES4 shoreline 0.10 1.36 14.35±1.97 4.44 gleysol
2.6 CO2bubbling
Bubbling of CO2 was determined with funnels (Deshmukh
et al., 2014) during five field campaigns covering different seasons (between May 2009 and June 2011), and during a weekly monitoring from March 2012 to August 2013. Dur-ing this monitorDur-ing, spatial variation was explored through measurements spread over six stations (Fig. 1) representa-tive of the different types of flooded ecosystems (dense and medium forests, light and degraded forest, and agricultural lands as determined by Descloux et al., 2011), and with dif-ferent depths (from 0.4 to 16 m) at each station. We stopped measuring bubbling at sites deeper than 16 m after no ebul-lition was observed during the first three campaigns. Bubble samples were taken with a 50 mL syringe and the syringe was immediately connected to a N2-preflushed 10 mL serum vial,
leading to a dilution factor of 5/6 (Guérin et al., 2007). Gas samples were analysed with the GC described above.
2.7 Soil descriptions and CO2fluxes from the
drawdown area
Since the drawdown area of the NT2R could represent up to 65 % of the surface area of the reservoir at the end of the WD season, emissions from this major area under the in-fluence of flooding were evaluated. Soil types were deter-mined together with CO2 emissions. Soil description was
carried out in June 2010 at six sites and soils from the sta-tion RES4S plot were characterized in detail in June 2013
(Fig. 1, Table 1). Four sites were selected in the Nam Theun River riparian’s area (NMR, RES2S, RES4S, RES8S’), one site in the flooded primary forest (RES3S) and one site in the flooded agricultural area (RES8S). Soil study was con-ducted through soil catenae of two to four soils profiles from the pristine soils on top (“upland” samples) to the shoreline of the reservoir (“shoreline” samples). One or two other soil profiles were performed in between (“interm. up” and “in-term. down” samples, with “interm” standing for interme-diate). Soil sampling was performed with an Edelman soil corer down to a depth of 1m, but only 0–20 cm depth sam-ples were considered in this study. Information on horizon depth, soil texture and structure (e.g. compactness, poros-ity), colour (Munssel chart for soil colour), soil fauna ac-tivity, and pedological features (e.g. redoximorphic features, concretions) were provided through soil descriptions in the field. Samples for C, N and pH were selected following the horizon apparition for each soil profile. They were manually decompacted and stored in plastic bags. Back in the labora-tory, soil samples were dried out at room temperature under a laminar flow hood, sieved at 2 mm and properly split in two representative subsamples. One of the subsamples was crushed with an agate mortar before chemical analysis. The non-crushed subsample was dedicated to soil pH and granu-lometric measurements. C and N analysis where performed with a Elementar Vario EL III C/N/S analyser and soil pH measurements were performed in ultrapure water (18.2 M)
Table 2.Temperature (◦C), relative humidity (%) and CO2fluxes (mmol m−2d−1)from the soils of the drawdown area of the Nam Theun
2 Reservoir (Lao PDR).
2010 2011 2013
Site Hum. Temp. CO2flux Hum. Temp. CO2flux Hum. Temp. CO2flux
NNR upland 17.5 25.7 265±37 18.3 24.4 328±43
NNR interm. up 26.9 27.5 669±56
NNR interm. down 19.6 32.3 201±19 23.7 29 251±99
NNR shoreline 37 31.9 40 46.4 27.3 67±7
RES3S upland 22.3 26.8 231 23.6 25.6 366±14
RES3S interm. 49.5 27.4 184±50 30.2 26.1 186±57
RES3S shoreline 42.3 28.3 503±97 25.6 19.8 391±23
RES2S upland 19.9 26.4 183±1 24.5 25.2 531±41
RES2S interm. 34.6 29.2 138±21 30.2 26.1 339±52
RES2S shoreline 49.4 28.5 332±5 48.7 27.1 166±23
RES8S upland 27.7 28.2 86±0 26.9 27.0 468
RES8S interm. up 32.3 28.3 75±15 33.2 26.9 300±19
RES8S interm. down 32.9 29.1 110±10 32.3 27.8 239±44
RES8S shoreline 45.3 29.7 286±59 44.5 28.5 660±121
RES8S’ upland 32.6 32.5 342±70
RES8S’ interm. 35.9 31.9 143±24
RES8S’shoreline 42.7 31.9 34±7
RES4S upland 26.7 28.6 326±20 21.7 29.5 526±35 18.1 31.1 232±50
RES4S interm. up 24.3 28.7 196±29
RES4S interm. down 26.0 34.2 168±28 21.8 32.7 619±39 35.1 29.8 443±67
RES4S shoreline 44.6 31.1 34±7 18.3 32.1 115 51.2 29.6 393±57
At the six sites, fluxes were measured along the soil mois-ture gradient between the shoreline and the zone not im-pacted by the reservoir water-level fluctuation. Three to four sites with contrasting moisture content were selected at each site. At those six sites, fluxes were measured at 21 plots in total and 40 CO2fluxes were gathered, mostly in duplicates
(from 1 to 4 replicates; Table 2). CO2emissions were
mea-sured during three field campaigns in 2010, 2011 and 2013 using a stainless steel chamber (volume 12 L, 0.08 m2) de-scribed in Serça et al. (1994, 2016). At each site, two cham-bers were deployed in parallel and the collars were installed at least 1 h prior to measurement. Air samples were taken and stored with the same methodology as for bubbling samples every 15 min in each chamber before subsequent GC analy-sis. It has to be noted that soil studies and measurement of fluxes were restricted for safety reasons due to the high den-sity of unexploded ordinances from the 60s and 70s in that area.
3 Results
3.1 Temperature, oxygen, pH, and organic and
inorganic carbon in the Nam Theun watershed and carbon inputs to the reservoir
In the rivers of the Nam Theun watershed, the water tem-perature was 24.5±0.2◦C ranging from 13.5 to 32.0◦C and pH was 6.83±0.03 (4.75–8.95,n=405). The Nam On River was, on average, less oxygenated (77±2 %) than the others. It is characterized by the highest DOC concentra-tions (222±11 µmol L−1,n=93), and amongst the highest CO2concentrations (59±6 µmol L−1,n=107) and the
low-est TIC concentration (237±11 µmol L−1,n=107; Fig. 2). The Nam Phao and the Nam Theun rivers are not sig-nificantly different in terms of POC, DOC, TIC and CO2
concentrations (Fig. 2). During the monitoring, the aver-age DOC in the Nam Phao was 87±4 µmol L−1 (n=82) and 108±4 µmol L−1 (n=97) in the Nam Theun, that is more than 2 times lower than in the Nam On. TIC was 40 % higher in the Nam Theun and Nam Phao rivers than in the Nam On (Nam Phao: 380±12 µmol L−1, n=82; Nam Theun: 379±15 µmol L−1, n=97; Fig. 2). CO2 in
0 50 100 150 200
PO
C
µ
mo
l L
-1
0 100 200 300 400 500
DO
C
µ
mo
l L
-1
0 200 400 600 800
TIC
µ
mo
l L
-1
Nam On
Nam Phao Nam Theun Nam Xot 0
100 200 300
CO
2
µ
mo
l L
-1
0 50 100 150 200
0 100 200 300 400 500
0 200 400 600 800
Nam On
Nam Phao Nam Theun Nam Xot 0
100 200 300
0 50 100 150 200
0 100 200 300 400 500
0 200 400 600 800
Nam On
Nam Phao Nam Theun Nam Xot 0
100 200 300
[image:7.612.104.498.69.464.2]CD
WD
WW
Figure 2.Median and interquartile ranges (boxes), average (+), and full range of values (whiskers) of particulate organic carbon (POC), dissolved organic carbon (DOC), total inorganic carbon (TIC) and CO2concentrations in four pristine rivers of the Nam Theun watershed
during three distinct seasons: cold dry (CD), warm dry (WD) and warm wet (WW) seasons. The dataset includes data from 2009 to 2013.
15 % of TIC whereas it was almost 25 % in the Nam On. The Nam Xot River had amongst the lowest DOC (90±3 µmol L−1,n=93), TIC (272±12 µmol L−1,n=94) and CO2(45±3 µmol L−1,n=110) concentrations (Fig. 2).
Comparing results from all rivers, we could not find any sig-nificant differences in POC concentration. In all rivers dur-ing this monitordur-ing, the average POC was 28±2 µmol L−1 (n=200) and contributed less than 20 % of the TOC in this watershed (Fig. 2). We could not identify any clear seasonal pattern for POC, DOC, TIC and CO2concentrations in the
four rivers of the Nam Theun watershed (Fig. 2).
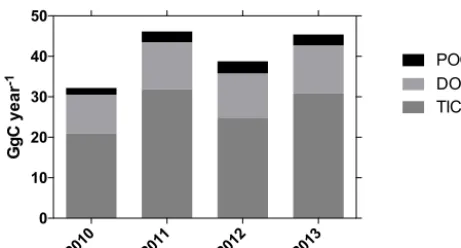
As reported in Descloux et al. (2016), the average to-tal water discharge in the reservoir is 238 m3s−1 ranging from 6 m3s−1 during the WD seasons to 2061 m3s−1 dur-ing the WW seasons. Carbon input to the reservoir as DOC,
POC and TIC ranged from 32.2±1.3 Gg C yr−1in 2010 to 46.2±1.5 Gg C yr−1 in the wet year 2011 (Fig. 3). During the monitoring, TIC represented 60 to 70 % of the carbon in-puts to the reservoir (Fig. 3).
3.2 Vertical profiles of temperature, O2, pH, CO2and
organic carbon in the reservoir water column At the stations RES1–RES8, the typical vertical distributions of temperature, O2, DOC, POC and CO2for the three
stratifica-2010 2011 2012 2013 0
10 20 30 40 50
GgC
y
e
a
r
-1
[image:8.612.53.284.69.193.2]POC DOC TIC
Figure 3.Total carbon inputs in the form of particulate organic car-bon (POC), dissolved organic carcar-bon (DOC) and total inorganic carbon (TIC) from the Nam Theun watershed to the Nam Theun 2 Reservoir for 4 distinct years after reservoir impoundment.
tion, the warm epilimnic waters are well oxygenated (> 80 % saturation), whereas the hypolimnion is anoxic (Fig. 4). Oc-casionally, sporadic and local destratification occurred dur-ing high water inflow in the WW season. Durdur-ing the CD season, temperature and O2decreased gradually with depth
or O2 concentration was constant from the surface to the
bottom of the water column (Fig. 4). After the power plant commissioning, the water column located near the turbine intake (RES9) got totally mixed as revealed by the homo-geneous temperature and O2 profiles from the surface to
the bottom (Fig. 4). pH always decreased from the surface to the bottom with, on average during the monitoring, sur-face pH=6.66±0.02 (5.21–8.76,n=1316) and hypolimnic pH=6.15±0.01 (4.88–8.00,n=1488).
Over the monitoring period at the stations RES1-RES8, the average CO2 concentration in the water column was
389±9 µmol L−1 and ranged from 0.3 to 4770 µmol L−1 (n=3698). It decreased from 544±24 µmol L−1in 2010 to 154±9 µmol L−1in 2013. During the WD and WW seasons, CO2 concentrations increased with water depth and often
showed a maximum gradient at or just below the thermocline (Fig. 4). For the years 2010 to 2013, the average CO2
con-centrations in the water column during the WD and WW sea-sons were always 50 % higher than in the CD season (Fig. 4). DOC concentrations averaged 181±1 µmol L−1and ranged from 12.5 to 569 µmol L−1(n=3068). For the years 2010, 2011 and 2012, we observed a significant decrease in DOC in the water column from year to year with average DOC con-centrations of 208±3 µmol L−1in 2010, 190±3 µmol L−1 in 2011 and 177±2 µmol L−1 in 2012. In 2013, the DOC was not significantly lower than in 2012 (175±2 µmol L−1). From 2010 to 2013, DOC concentrations were about 25 % higher in the WD and WW seasons than in the CD sea-son. Whatever the year, the average epilimnic DOC con-centration was 30 % higher than in hypolimnic water. POC concentration was 63±2 µmol L−1(n=2488). POC in hy-polimnic waters (92±3 µmol L−1)was almost twice higher
than in the epilimnion (45±2 µmol L−1;p< 0.0001,t test). The POC in the epilimnion decreased significantly from 41±4 µmol L−1 in 2010 to 23±2 µmol L−1 in 2013 in the epilimnion (p< 0.0001). POC in hypolimnic waters did not show any consistent trend with yearly average values being 87±6 µmol L−1 in 2010, 67±6 µmol L−1 in 2011, 104±7 µmol L−1in the wet year 2012 and 83±5 µmol L−1 in 2013. No clear seasonal variation was observed.
At the station RES9 where the presence of the water in-take enhances vertical mixing of the water column lead-ing to the transport of bottom water to the surface, the water column is not thermally stratified and always oxy-genated from the surface to the bottom after the reser-voir was commissioned in April 2010 (Guérin et al., 2016; Fig. 4). Since commissioning, O2 saturation was 60±2 %
over the water column. The water column was significantly more oxygenated during the overturn in the CD (74±3 %) than in the WW and WD seasons (56±2 %; p< 0.0001,
t test) and significantly more oxygenated (p< 0.0001) in the wet year 2011 (70±3 % on average) than in 2010 and 2012 (56±3 % on average). In 2013, which was an av-erage hydrological year, the water column was well oxy-genated with 71±1 % suggesting of improvement of the wa-ter quality. CO2 concentrations were almost constant from
the surface to the bottom and averaged 216±13 µmol L−1 over the whole monitoring period (n=512; Fig. 4). CO2 concentration in the water column decreased from
311±32 µmol L−1 in 2010 down to 28±2 µmol L−1 in 2013. Concentrations in the WW and WD seasons were similar 204±14 µmol L−1 and more than 2 times higher than during the CD season (105±6 µmol L−1). POC con-centration was 25±1 µmol L−1 (n=431) and DOC was 157±2 µmol L−1 (n=642) over the whole water column and both follow the same seasonal and temporal variations as described for the other stations.
3.3 Reservoir surface CO2concentration and diffusive
fluxes
The reservoir surface CO2concentrations (n=1067) ranged
from 0.3 to 970 µmol L−1 (Fig. 5a, b) and diffusive fluxes ranged from−40.4 up to 2694.9 mmol m−2d−1(Fig. 5c, d). Most of the dataset (85 % of all measurements) showed CO2supersaturation with respect to the atmosphere. In 2009
(from May to December), surface concentrations and dif-fusive fluxes from all nine sampling stations located in the reservoir were statistically similar (p> 0.05, ANOVA test). The average surface concentration was 68.2±47.9 µmol L−1 and the diffusive flux was 101.6±137.7 mmol m−2d−1.
From 2010 to 2013 at the stations RES1 to RES8, the yearly average surface CO2 concentrations decreased
16 20 24 28 32 0
5
10
15
Temperature (°C)
De p th ( m )
0 250 500
DOC (µmol L-1)
0 1500 3000
CO2 (µmol L-1)
16 20 24 28 32 0
5
10
15
Temperature (°C)
0 250 500
DOC (µmol L-1)
0 1500 3000
CO2 (µmol L-1)
16 20 24 28 32 0
5
10
15
Temperature (°C)
0 250 500
DOC (µmol L-1)
0 1500 3000
CO2 (µmol L-1)
0 200 400 0 50 100 150 200 0 200 400 0 50 100 150 200 0 200 400 0 50 100 150 200
16 20 24 28 32 0 5 10 15 De p th ( m )
0 250 500 0 500 1000 1500 16 20 24 28 32
0
5
10
15
0 250 500 0 500 1000 1500 16 20 24 28 32
0
5
10
15
0 250 500 0 500 1000 1500
0 200 400 0 50 100 150 200 0 200 400 0 50 100 150 200 0 200 400 0 50 100 150 200
16 20 24 28 32 0 5 10 15 De p th ( m )
0 250 500 0 300 600 16 20 24 28 32
0
5
10
15
0 250 500 0 300 600 16 20 24 28 32
0
5
10
15
0 250 500 0 300 600
0 200 400
O2 (µmol L-1)
0 50 100 150 200 POC (µmol L-1)
0 200 400
O2 (µmol L-1)
0 50 100 150 200 POC (µmol L-1)
0 200 400
O2 (µmol L-1)
0 50 100 150 200 POC (µmol L-1)
RES3
RES7
RES9
[image:9.612.58.543.68.308.2]Cool dry Warm dry Warm wet
Figure 4.Temperature (grey solid circle) and oxygen (black solid circle), DOC (open square) and POC (solid square), and CO2(triangle) concentrations in the Nam Theun 2 Reservoir water column during the cool dry (CD), warm dry (WD) and warm wet (WW) seasons in 2011 at three stations (RES3, RES7 and RES9).
period, the highest concentration and fluxes were al-ways observed in the WD season (70±3 µmol L−1
and 90±9 mmol m−2d−1), they decreased down to 51±3 µmol L−1 and 65±8 mmol m−2d−1in the WW and reached their minima in the CD season (45±3 µmol L−1 and 22±2 mmol m−2d−1) (Fig. 5a, c). In 2013, the reservoir was a net CO2 sink from March to August
(−11±2 mmol m−2d−1,n=96) and emissions in the CD season were 66±9 mmol m−2d−1 (n=41) that is 3 times higher than usually observed for that season.
At the water intake (RES9) after the commissioning, sur-face concentrations and diffusive fluxes were statistically dif-ferent from the other stations and were significantly higher as already observed for CH4(Guérin et al., 2016). The
aver-age surface CO2concentrations at RES9 were 287±350 and
184±234 µmol L−1for the year 2010 and 2011, respectively that is 3- to 5-fold higher than the average at the other sta-tions (Fig. 5b). In 2012, surface CO2concentrations at RES9
dropped down to 65±23 µmol L−1, still almost twice the concentration at the other stations. In 2013, surface concen-tration at RES9 was not statistically different than at the other station in the reservoir (33±4 µmol L−1in 2013). On an annual basis, the diffusive fluxes at RES9 decreased from an average of 745±195 to 18±9 mmol m−2d−1 between 2010 and 2013 (Fig. 5d). The same seasonality as described before was observed at RES9 with an exacerbated effect at the transition between the WD and WW seasons since
diffu-sive fluxes were then up to 17-fold higher than the average fluxes at the other stations for that same period (Fig. 5c, d).
Monthly emissions by diffusive fluxes varied by 2 or-ders of magnitude between 2009 and 2012. Superimposed on the general decrease in emissions with time, we observed very significant seasonal variations with emissions peaking during the transition between the WD and WW seasons, even though the reservoir water surface was at its minimum (Fig. 5e). The annual diffusive CO2emission from the
reser-voir was 730.0±46.2 Gg(CO2)yr−1 in 2009 and dropped
down by a factor of 6 in 2013 (118±11.5 Gg(CO2)yr−1;
Fig. 5f).
3.4 O2, pH, organic carbon and CO2downstream of
the reservoir
After the commissioning, immediately downstream of the power station (station TRC1), the average O2
concentra-tion was 174±58 µmol L−1, that is, 67±20 % saturation (n=189) and pH was 6.55±0.04 (n=234). Further down-stream, the O2 concentration always increased and the O2
saturation downstream of station DCH4 located 30 km from the turbines was always around 100 % saturation in the artificial downstream channel (average 100.4 %, n=146). Just below the regulating dam, in the Nam Kathang River (NKT3), the average O2 concentration was 237 µmol L−1,
that is, 93 % saturation (n=120). There was no marked in-terannual change in the O2concentration. At DCH4, pH
Jan-09Apr-09Jul-09Oct-09Jan-10Apr-10Jul-10Oct-10Jan-11Apr-11Jul-11Oct-11Jan-12Apr-12Jul-12Oct-12Jan-13Apr-13Jul-13Oct-13 0 100 200 300 1500 3000 CO 2 fl ux ( m m ol m
-2 d -1)
Jan-09Apr-09Jul-09Oct-09Jan-10Apr-10Jul-10Oct-10Jan-11Apr-11Jul-11Oct-11Jan-12Apr-12Jul-12Oct-12Jan-13Apr-13Jul-13Oct-13
0 1000 2000 3000 2CO
flu x ( m m ol m -2 d-1 )
Jan-09Apr-09Jul-09Oct-09Jan-10Apr-10Jul-10Oct-10Jan-11Apr-11Jul-11Oct-11Jan-12Apr-12Jul-12Oct-12Jan-13Apr-13Jul-13Oct-13
0 50 100 150 200 RES9 RES1-8 Di ff us io n (G g (CO 2 ) mo nth -1)
Stations located in the reservoir (RES1–RES8) Station before water intake (RES9)
0 400 800 1200
WD WW CD WD WW CD WD WW CD WD WW CD WD WW CD
CD
CO
2 (
µ mo l L -1 ) 0 50 100 150 200 500 1000
WD WW CD WD WW CD WD WW CD WD WW CD WD WW CD
CD CO 2 ( µ mo l L
-1)
(a)
(c)
(e)
(b)
(d)
(f)
Powerplant commissioning2009 2010 2011 2012 2013
[image:10.612.56.537.85.370.2]0 200 400 600 800 1000 RES1-8 RES9 Gg (C O 2 ) y ea r-1
Figure 5.Monthly average CO2concentrations at the stations RES1–8(a)and at the station RES9(b), average diffusive fluxes at the stations
RES1–8(c)and at the station RES9(d)and total monthly(e)and yearly(f)CO2emissions by diffusive fluxes from the Nam Theun 2
Reservoir (Lao PDR).
On average at all the stations in between TRC1 and DCH4, DOC concentration was 159±2 µmol L−1 (n=1366) over all stations for all years between 2009 and 2013. DOC decreased from 187±2 µmol L−1 in 2010 (n=272) to 157±2 µmol L−1 in 2013 (n=303). Average POC was 25±1 µmol L−1 (n=818) for all years between 2009 and 2013, and followed interannual variations already observed for the reservoir, i.e. higher POC concentration in the WW season of 2012.
CO2concentration below the Powerhouse (TRC1), which
receives water from the station RES9 in the reservoir after the water transiting through the turbines, varied by almost 3 orders of magnitude, ranging from 1.4 to 856 µmol L−1 with an average of 153±14 µmol L−1(n=199). The CO2
concentrations varied seasonally with maximum concentra-tions at the end of the WD season, and minimum at the end of the CD season. Below the powerhouse, along the longi-tudinal transects from TRC1 to DCH4, surface CO2
con-centration decreased by a factor of 3 within a distance of 30 km during the WD and WW seasons (from 267±34 to 90±10 µmol L−1and from 235±28 to 70±8 µmol L−1, respectively for WD and WW). In the CD season when CO2 concentrations were lower, the decrease in
concentra-tion with distance from the dam was only by a factor of 2 (from 49±8 to 30±4 µmol L−1). Between 2010 and 2013 for all stations in the downstream channel (TRC1 to DCH4), annual average CO2 concentrations decreased by a factor
of 7 from 182±9 µmol L−1 to 24±2 µmol L−1. On aver-age, CO2 concentration reached down to 56±5 µmol L−1
at DCH4, which is in the same order of magnitude as the concentrations found in the pristine Xe Bangfai River (XBF1, 60±2 µmol L−1,n=64), Nam Kathang Noy River (NKT1, 35±3 µmol L−1,n=47) and Nam Kathang Gnai River (NKT2, 82±10 µmol L−1,n=70).
Immediately downstream of the Nakai Dam (NTH3) after the commissioning, the average O2
concentra-tion was 224 µmol L−1, that is 87 % saturation (n=73), and the concentration increased further downstream. pH was 6.84±0.06 (n=166). Average DOC concentra-tion was 166±2 µmol L−1 (n=653) and decreased from 197±4 µmol L−1 in 2010 (n=147) to 162±3 µmol L−1 (n=127) in 2013. The average POC concentration was 50±5 µmol L−1 (n=7) and CO2 concentration was
67±9 µmol L−1(n=77). The CO2concentration decreased
Jan-09Apr-09Jul-09Oct-09Jan-10Apr-10Jul-10Oct-10Jan-11Apr-11Jul-11Oct-11Jan-12Apr-12Jul-12Oct-12Jan-13Apr-13Jul-13Oct-13 0
10 20 30 40
Diffusion below PH Degassing below PH Diffusion below ND Degassing below ND
Gg
(C
O2
) mon
th
-1
2009 2010 2011 2012 2013
0 50 100 150
Diffusion below PH Degassing below PH Diffusion below ND Degassing below ND
Gg
(C
O2
) ye
ar
-1
(a)
[image:11.612.133.465.74.309.2](b)
Figure 6.Diffusive fluxes and degassing below the powerhouse (PH) and the Nakai Dam (ND) on a monthly(a)and yearly basis(b)at the
Nam Theun 2 Reservoir (Lao PDR). Note that degassing below ND includes spillway release (main contributor to 2009 and 2011 emissions below ND). Degassing below the powerhouse includes degassing immediately downstream of the turbines, downstream of the regulation dam and downstream of the aeration.
7.19±0.06 (n=97). At NTH4, the observed concentrations were in the same order of magnitude as the concentrations in the pristine rivers in the same watershed (53±6 µmol L−1at NPH1 in the Nam Phao River,n=59).
3.5 CO2emissions downstream of the reservoir
After the commissioning, the annual average diffu-sive fluxes downstream of the powerhouse decreased from 482±603 mmol m−2d−1 in the year 2010 (−32– 33 762 mmol m−2d−1) to 32±8 mmol m−2d−1 (−39– 216 mmol m−2d−1) in 2013 (not shown). They followed the same seasonal dynamics as the CO2 concentrations
and they decrease with the distance from the power-house. Total emissions by diffusion from the downstream channel decreased from 14±12 Gg(CO2)yr−1 in 2010
to 1.3±0.5 Gg(CO2)yr−1 in 2013 (Fig. 6a). Degassing
in the whole downstream channel (including degassing below the turbines, the regulating pond and the aeration weir) reached up to 28.5 Gg(CO2)month−1 just after the
commissioning of the reservoir when the water was released for the first time (Fig. 6a). During the monitoring, 60–90 % of the annual degassing occurred within 3–4 months of transition between the WD and WW seasons corresponding to the seasons when the hypolimnic waters were the most enriched in CO2 (Fig. 6a). Total degassing decreased from
80±36 Gg(CO2)yr−1 in 2010 to 8±4 Gg(CO2)yr−1 in
2013 (Fig. 6b).
Disregarding periods of spillway releases from April to June 2009 for water-level regulation and in September– October 2011 during the flood, degassing downstream of the Nakai Dam (up to 0.48 Gg(CO2)month−1) is usually
10 times lower than degassing in the downstream channel because of (1) the low continuous water discharge at the Nakai Dam (2 m3s−1) and (2) the withdrawal of the wa-ter from the reservoir epilimnion (Deshmukh et al., 2016; Fig. 6a). However, during the use of spillways for water-level regulation in the reservoir, degassing reached up to 26 Gg(CO2)month−1 in 2009 before the commissioning
and 4 to 10 Gg(CO2)month−1 during the occasional uses
in October 2010 and September 2011 (Fig. 6a). As de-termined from the longitudinal profiles of CO2
concen-trations downstream of the dam, diffusive emissions from the Nam Theun River that are actually attributable to the NT2R occurred within the first 10 km below the dam as it was also the case for CH4 (Deshmukh et al., 2016). The
annual average diffusive CO2 fluxes were 126±137 and
288±346 mmol m−2 d−1 in 2010 and 2011, respectively. The annual average diffusive CO2flux was 1 order of
magni-tude lower in 2013 (24±68 mmol m−2d−1; not shown). The total emissions by diffusion and degassing resulting from these fluxes ranged between 5.5±0.1 Gg(CO2)yr−1in 2010
and 0.14±0.06 Gg(CO2)yr−1in 2013 (Fig. 6b).
On a yearly basis, emissions downstream of NT2R de-creased from 99.7±25.3 to 15.0±6.5 Gg(CO2)yr−1
com-0 100 200 300 400 Dr
awd
own
a
re
a (
km
2
)
Jan-09Apr-09Jul-09Oct-09Jan-10Apr-10Jul-10Oct-10Jan-11Apr-11Jul-11Oct-11Jan-12Apr-12Jul-12Oct-12Jan-13Apr-13Jul-13Oct-13
0 50 100 150 200 250 300
Commissioning CO2 emission
First full
impoundment Drawdown area
Di
ff
us
io
n
(G
g(
CO
2
) mo
nth
[image:12.612.139.460.78.213.2]-1)
Figure 7.Monthly emissions from the drawdown area and variation in the area of the drawdown of the Nam Theun 2 Reservoir (Lao PDR).
missioning in 2009, emissions were dominated by degassing due to spillway releases. After the commissioning, emissions were dominated by degassing in the downstream channel which contributed 80–90 % of total downstream emissions. 3.6 CO2bubbling
The CO2content in the sampled bubbles was 0.29±0.37 %
(n=2334). On average, the CO2 bubbling was 0.16 ±0.24 mmol m−2d−1 (0–2.8 mmol m−2d−1) for depths shallower than 16 m. Considering the water surface varia-tions, the monthly ebullitive CO2 emissions ranged from
0.04±0.06 to 0.11±0.16 Gg(CO2)month−1. CO2bubbling
was constant around 1.1±2.2 Gg(CO2)yr−1throughout the
monitoring.
3.7 CO2emissions from the drawdown area
Four types of pristine soils were identified in the six differ-ent studied catenae. Acrisols were the most represdiffer-ented soils and were found at three sites (RES4S, RES8S and RES8’S; Table 1). In the area with dense forest, soils were charac-terized as plinthosol (RES3S) and plinthic ferralsol (RES2S) and the pedological cover at the NNR (Nam Nien River) site belong to planosol type soil (Table 1). At all sites, from up-land pristine soils to the shoreline, stagnic properties were more and more pronounced. Average organic carbon con-tent (%C), nitrogen (%N) and C:N ratio were 1.84±0.10 %, 0.14±0.01 % and 12.83±0.30, in surface horizons, respec-tively. For those three parameters, no statistical differences were obtained according to soil type, topography or mea-surement site. Diffusive CO2fluxes ranged between 34±7
and 699±59 mmol m−2d−1 (Table 2). The fluxes were not significantly correlated with the surface moisture (17.5 to 51.2 %) and temperature (18.1 to 34.2◦C; Table 2). The fluxes neither varied significantly with soil types, topog-raphy, measurement sites, nitrogen content or C:N ratio (p> 0.05, ANOVA test). However, average fluxes at each site were significantly correlated with the average C
con-tent (p=0.0452). Since we did not observe significant spa-tial variations related to topography, humidity or tempera-ture that could have been considered for refined spatial and temporal extrapolation, we further consider the average of all fluxes that is 279±27 mmol m−2d−1throughout the years.
After the commissioning of the reservoir, emissions var-ied by 3 orders of magnitude. Since a constant CO2
emis-sion is accounted for, the seasonal pattern of CO2emission
from the drawdown mimics the variation of the surface of that area (Fig. 7). Monthly CO2emissions have reached up
to 110.8±10.7 Gg(CO2)month−1by the end of the WD
sea-son when drawdown area reached its maximum, whereas it decreased down to 0.6±0.1 Gg(CO2)month−1 at the end
of the WW season when drawdown area reached its min-imum (Fig. 7). Around 80–90 % of the annual emissions occurred within 4–6 months of the transition period be-tween the WD and WW seasons (Fig. 7) when the draw-down area surface is at its maximum. The lowest emissions from the drawdown area occurred during the wet year 2011 (386±16 Gg(CO2)yr−1)and the highest emissions during
the dry year 2012 (572±20 Gg(CO2)yr−1). On average
from 2009 to 2013, emissions from the drawdown area were 431±42 Gg(CO2)yr−1.
4 Discussion
4.1 CO2dynamics in the NT2R water column and
downstream rivers
The dynamics of CO2 in the NT2R is highly dependent on
the hydrology and hydrodynamics of the reservoir as it has already been described for CH4(Guérin et al., 2016). During
the warm seasons (WD and WW) when the water column is thermally stratified, the vertical profiles of CO2
high concentrations measured in the hypolimnion suggest that the main source of CO2 is located at the bottom and
very likely in the flooded soils, vegetation and sediments, whereas the decrease in CO2toward the surface suggest both
consumption by primary production and/or loss to the at-mosphere (Galy-Lacaux et al., 1997b; St Louis et al., 2000; Abril et al., 2005; Guérin et al., 2008; De Junet et al., 2009; Barros et al., 2011; Chanudet et al., 2011; Teodoru et al., 2011). In the CD season, after the reservoir overturn, the av-erage CO2concentration in the reservoir water column
de-creases sharply (by 50 % on average) and CO2concentration
increases regularly from the surface to the bottom of the wa-ter column. However, no CO2burst was observed at the
be-ginning of the CD season, evidence that reservoir overturn has only a moderate impact on CO2emissions. This
assump-tion is reinforced by the fact that during the same sampling, hot moments of CH4emissions that should have occurred at
the same time were captured (Guérin et al., 2016). As ob-served in most tropical and subtropical reservoirs, the higher concentrations were observed during the warm seasons due to long residence time of water and warmer conditions en-hancing CO2 build-up (Abril et al., 2005; Chanudet et al.,
2011; Kemenes et al., 2011), whereas the lowest were found after reservoir overturn when the water outgassed (Chanudet et al., 2011). A significant shift in the carbon biogeochemi-cal cycling occurred in the reservoir in 2013 with the reser-voir water surface becoming a CO2sink during the WD
sea-son and the beginning of the WW seasea-son (from March to August). Although no major change was observed in nu-trient concentrations, the number of phytoplanktonic cells was 50 % higher in 2013 than 2012 (Maud Cottet, personal communication, 2017) indicating that primary production was significantly enhanced in 2013. Despite the fact that the reservoir was a sink for the 6 months when CO2emissions
are usually the highest of the year, annual CO2emissions at
the surface of the reservoir were only 50 % lower in 2013 than in 2012. In 2013, CO2was mainly emitted in the CD
af-ter the period of high biological productivity suggesting that the degradation of autochthonous OM fuels CO2emissions.
The maximum concentration and the highest CO2stock in
the water column highly depend on the age of the reservoir. In the NT2R, average CO2concentration was 3 times higher
in 2010 than in 2013 and the maximum concentrations in 2010 was almost 2 times higher than in 2013 (4771 µmol L−1 in 2010 vs. 2649 µmol L−1 in 2013). Those high concen-trations are slightly lower than the maximum concentration measured in the hypolimnion of the Petit Saut Reservoir less than a year after it was flooded (Galy-Lacaux et al., 1997a; Abril et al., 2005). Disregarding these high concentrations observed in the hypolimnion of the reservoir at the end of the WD season and beginning of the WW season in 2009 and 2010, the CO2concentrations in the NT2R are in the same
range as concentrations in other older reservoirs in the trop-ics or the subtroptrop-ics (Abril et al., 2005; Guérin et al., 2006; Chanudet et al., 2011; Kemenes et al., 2011). This decrease
during the first 4 years after impoundment is very consistent with the decrease in the CO2concentration with the reservoir
age as already observed at the Petit Saut Reservoir (Abril et al., 2005), at the Eastmain I Reservoir (Teodoru et al., 2012) or over a multi-site study (Barros et al., 2011).
Disregarding the station RES9 located at the water intake, no significant spatial variation in CO2surface concentrations
was found despite very significant differences in hypolimnic concentration between stations located upstream of the Nakai Dam (RES1, 2 and 3) and stations located in areas close to the three main tributaries (RES6, 7 and 8). The average hy-polimnic concentrations at the stations RES1–3 were 2 times higher than at the stations RES6–8. This difference is at-tributed to both (1) the difference in carbon density at the bot-tom of the reservoir in those two contrasted areas in terms of submerged ecosystems (Descloux et al., 2011; see Sect. 4.3) and (2) the difference in terms of water residence time be-tween those two zones (Guérin et al., 2016). Stations RES1– 3 are located in areas with the longest water residence time in the reservoir since the water mostly enters the reservoir in the RES6–8 area from the Nam Theun, Nam Noy and Nam On rivers before being delivered to the water intake (close to RES9) on the opposite side of NT2R, which has a narrow and elongated shape (Fig. 1). Therefore, the water renewal in the RES6–9 area is high and CO2accumulates less in the water
column confirming the importance of the reservoir hydrol-ogy on the spatial variability in dissolved gases in reservoirs (Pacheco et al., 2015; Guérin et al., 2016).
As found for CH4, the main factor influencing the spatial
variability of CO2 in the water column is the vertical
mix-ing of the water column induced by the water intake located close to RES9 (Deshmukh et al., 2016; Guérin et al., 2016). The design of the water intake enhances horizontal water cur-rent velocities and vertical mixing which lead to the transport of bottom waters to the surface. As a consequence, surface concentrations at RES9 were up to 30 times higher than at other stations in 2010 and 2011 (Fig. 5b). With the signif-icant decrease in concentrations in 2012 and 2013, the dif-ference with other stations dropped to a factor of 4. These maximum surface concentrations at RES9 are up to 10 times higher than concentrations found in other tropical reservoirs in South America (Abril et al., 2005; Guérin et al., 2006; Kemenes et al., 2011) and Lao PDR (Chanudet et al., 2011) showing that, as for CH4, CO2emissions can be enhanced
upstream of water intakes or dams.
Downstream of the reservoir in the Nam Theun River or the artificial channel, CO2 concentrations follow the same
Jan-09Apr-09Jul-09Oct-09Jan-10Apr-10Jul-10Oct-10Jan-11Apr-11Jul-11Oct-11Jan-12Apr-12Jul-12Oct-12Jan-13Apr-13Jul-13Oct-13
0 100 200 300 400
Em
is
si
on
s
(G
g(
C
O2
) mo
nth
-1)
Diffusion (reservoir) Degassing
Diffusion (drawdown)
Diffusion (downstream)
Ebullition
Power plant commissioning
WD WW CD WD WW CD WD WW CD WD WW CD WD WW CD
CD
520 530 540 Wat
er
le
ve
l (
m
)
Water level
(a)
(b)
2009 2010 2011 2012 2013
0 300 600 900 1200
Em
is
si
on
s
(G
g
(C
O2
) y
ea
r
[image:14.612.136.460.72.345.2]-1 )
Figure 8.Monthly(a)and yearly(b)average of the total emissions from the Nam Theun 2 Reservoir by diffusion at the reservoir surface, diffusion from the drawdown area, ebullition, degassing and diffusion from the Nam Theun River and artificial channel at the Nam Theun 2 Reservoir (Lao PDR). In panel(a), water-level variations in the reservoir are also given.
the watershed. Downstream of the powerhouse, CO2
concen-trations in 2010 were in the same order of magnitude as in 10–20 year-old reservoirs in South America flooding tropi-cal forest (Abril et al., 2005; Guérin et al., 2006; Kemenes et al., 2011), whereas 4 years after impoundment CO2
concen-trations were 2 times lower than in 20–30 year-old reservoirs in Lao PDR (Chanudet et al., 2011). We hypothesize that the low CO2concentration downstream of the NT2R result from
a significant degassing of the water at the water intake be-fore the water is transferred downstream as observed for CH4
(Deshmukh et al., 2016; Guérin et al., 2016).
4.2 Total CO2emissions from the Nam Theun 2
Reservoir
From 2009 to 2013, total CO2emissions from NT2R show
the same seasonal pattern (Fig. 8a). The lowest total emis-sions occur in the CD season while the highest emisemis-sions oc-cur at the transition between the WD and WW seasons, when emissions by all individual pathways reach their maximum. From 2010 to 2013, emissions at the transition between the WD and WW seasons (April–July) contributed 47 to 61 % of total annual emissions suggesting that quantification of emissions based on two to four campaigns in a year might
be subject to caution since seasonality of emissions signifi-cantly affects emission factors.
CO2 bubbling follows the same seasonal variations,
be-ing triggered by water level and concomitant hydrostatic de-crease as for CH4(Chanton et al., 1989; Engle and Melack,
2000; Smith et al., 2000; Boles et al., 2001; Deshmukh et al., 2014), but its contribution is negligible (< 1 %, Table 3). Low CO2emission by bubbling, as also observed in
temper-ate reservoirs (Bevelhimer et al., 2016), is attributed to the higher solubility of CO2in water than CH4which leads to
the solubilization of the majority of CO2as free CO2or as
DIC.
The relative contribution of emissions downstream of the reservoir by degassing and diffusion from rivers and channels at NT2R are low as compared to most of the reservoirs that were studied (Abril et al., 2005; Guérin et al., 2006; Kemenes et al., 2011; Bevelhimer et al., 2016), but the contribution of this pathway is comparable to what was observed in boreal reservoirs (Roehm and Tremblay, 2006) or in monomictic reservoirs from Lao PDR (Chanudet et al., 2011). The down-stream emissions contributed between 11 % at the maximum in the wet 2011 year down to 3 % at the minimum in 2013 (Table 3 and Fig. 8a). As for CH4 at NT2R (Deshmukh et
Table 3.CO2emissions (in Gg CO2year−1) from the Nam Theun 2 Reservoir (Lao PDR) for the first 5 years after impoundment (2009,
2010, 2011, 2012 and 2013). Percentages between brackets represent the proportion of each component to the total annual emission.
Year Ebullition Diffusion (reservoir) Diffusion (drawdown) Degassing Diffusion (downstream) Total
2009 1.2±0.5 730.0±46.2 6.3±0.5 52.7±14.9 4.0±0.3 794.1±48.5
(< 1 %) (92 %) (1 %) (7 %) (< 1 %)
2010 1.04±0.5 538.57±28.6 413.7±15.9 85.37±17.4 14.34±0.4 1053.0±37.0
(< 1 %) (51 %) (39 %) (8 %) (1 %)
2011 1.06±0.5 345.88±24.3 386.4±16.0 84.03±10.7 11.60±0.5 828.9±31.0
(< 1 %) (42 %) (47 %) (10 %) (1 %)
2012 0.95±0.4 173.30±11.5 572.3±19.9 17.03±3.8 2.23±0.2 765.8±23.3
(< 1 %) (23 %) (75 %) (2 %) (< 1 %)
2013 1.04±0.5 118.70±27.3 419±15.0 13.61±4.0 1.43±0.2 553.8±31.4
(< 1 %) (21 %) (76 %) (2 %) (< 1 %)
before the water reach the turbines and to the flush of CO2
due to the reservoir overturn in the CD season.
Emissions by diffusive fluxes at the surface of the reser-voir increased by a factor of 2 by the end of the WD sea-son (Fig. 5a) compared to the CD seasea-son from 2009 to 2012. The average CO2emissions in 2009 and 2010 and to a lesser
extend 2011 are in the same range as emissions from the Petit Saut Reservoir during the first 5 years after impound-ment (Abril et al., 2005), and in the upper range of average CO2 diffusive fluxes measured in older tropical reservoirs
(dos Santos et al., 2006; Kemenes et al., 2011; Yang et al., 2013) or in young boreal reservoirs (Teodoru et al., 2011; Tadonléké et al., 2012). In 2012 and 2013, emissions from NT2R by diffusive fluxes are still higher than most of the older Asian reservoirs (Wang et al., 2011; Chanudet et al., 2011; Xiao et al., 2013; Zhao et al., 2013; Panneer Selvam et al., 2014) and other Brazilian reservoirs flooding savannah (Roland et al., 2010; Pacheco et al., 2015). The low emis-sions in the CD season from the first 3.5 years might mostly result from lower heterotrophic activity due to the low tem-perature (down to 7◦C in air in March 2011). The high emis-sions in the CD season of 2013 as compared to the CD sea-son in 2011 and 2012 are likely to be originated from addi-tional autochthonous OM. We hypothesize that the signifi-cantly higher CO2emissions in the WD season result from
the increase in the water residence time that favour CO2
ac-cumulation in the water column (Abril et al., 2005) and the increase in temperature that enhance aerobic and anaerobic degradation of OM and the production of CO2(Sobek et al.,
2005). Although the reservoir area during the WD season is the smallest of the year, emissions by diffusive fluxes are the highest (Fig. 8a), highlighting the very significant increase in CO2emissions from May to July every year, disregarding the
year 2013.
This first estimation of the CO2emission from the
draw-down area to the total emission from a reservoir reveals that
with a contribution ranging from 40 to more than 75 %, it could be a major CO2 pathway to the atmosphere. These
results from the NT2R cannot be generalized to all reser-voirs since its contribution is tightly linked to the very large water-level variations and large surface area of the draw-down area (up to 320 km2, Fig. 7). However, areal fluxes from the drawdown area are on average 2.5 times higher than the diffusive fluxes from the reservoir water surface in 2009–2010 and 6 times higher than those fluxes in 2013 making the soils in the area of influence of the reservoir a hotspot for CO2 emissions compared to the reservoir
sur-face waters. The total emissions of reservoirs with contrasted hydrology characterized by marked wet and dry seasons and large water-level variations of 30 % of the total surface could have been significantly underestimated as it is the case for Petit Saut (∼100 km2), Samuel (∼280 km2), Balbina (∼220 km2)or The Three Gorges Reservoir (∼400 km2)for instance (Guérin et al., 2006; Kemenes et al., 2011; Li et al., 2016). This pathway is expected to be more significant in flat-bottom reservoirs than in valley-type reservoirs in mountain-ous regions and cannot be generalized to just the drawdown area without taking into account hydrological water man-agement and the local topography. At Petit Saut and NT2R at least, no vegetation regrowth occurs in the drawdown ar-eas. Soils at NT2R exhibit very clear modification related to the flooding (stagnic features) confirming soil modification as also observed in Canada (Furey et al., 2004), Australia (Watts, 2000) and France (Feìlix-Faure et al., 2017). The ecosystems of the seasonally flooded area are therefore sig-nificantly modified and CO2 emissions from the drawdown
must be accounted for in total gross emissions from reser-voirs. Although drawdown emissions cannot be neglected in terms of gross CO2exchange, the emissions resulting from
over-looked ecosystems (Prairie et al., 2018). So far, we cannot predict future evolution of CO2emissions in this area based
on the available data. The consequence of the flooding on the respiration rate of these soils may lead to a decrease in emis-sions with time or a stabilization (see next section). There-fore, the net contribution of the drawdown zone to emissions from the reservoir remains unclear and specifically requires research on soil OM dynamics and would also require the inclusion of the vegetation dynamics when present.
This is the first comprehensive quantification of CO2
emis-sions from a reservoir where all known CO2pathways to the
atmosphere were taken into account at one of the best spa-tial and temporal resolutions reported in the literature. We showed that downstream emissions and emissions around the water intake are not negligible (∼10 % overall) and that the overlooked drawdown area in CO2studies could be the
main emission pathway of CO2to the atmosphere. Overall,
this study highlights that global estimate of CO2emissions
from reservoirs are underestimated so far since relevant path-ways like drawdown emissions in flat or shallow reservoirs with large water-level variations and downstream emissions in thermally stratified reservoirs are missing in most site-specific studies used for extrapolations (Deemer et al., 2016; Barros et al., 2011).
4.3 Source of organic matter fuelling the reservoir CO2
emissions
In tropical reservoirs, the decrease in the CO2concentration
in the water column and subsequent emissions with the age of the reservoir (Fig. 8b) is supposed to result from the de-crease in the aerobic and anaerobic mineralization rate due to the exhaustion of labile OM from the pool of soil and vegeta-tion that was flooded during impoundment (Abril et al., 2005; Guérin et al., 2008). In boreal reservoirs, the decrease in ben-thic CO2production is sharp and after 3–5 years, most of the
CO2production appears to be pelagic and is supposed not to
result from the flooded OM (Teodoru et al., 2011; Brothers et al., 2012). The total CO2emissions were 9 and 3 times higher
than the carbon inputs from the watershed to the NT2R in 2010 (32 Gg C yr−1)and 2013 (45 Gg C yr−1), respectively (Fig. 3 and Table 3). It has to be noted that interannual varia-tions in carbon inputs to the NT2R (Fig. 3) are not correlated with the regular decrease in total CO2emissions from year to
year (Fig. 8b). It is therefore unlikely that most of CO2
emis-sions result from the mineralization of allochthonous OM but rather from the contribution of the flooded carbon pool (soil and vegetation), which is decreasing with time. This is con-sistent with the fact that at Petit Saut, even 10 years after flooding, the majority of the OM in the water column has a terrestrial origin (De Junet et al., 2009). According to Abril et al. (2005) at Petit Saut, total emissions (disregarding draw-down emissions which were not measured) were 9 to 6 times higher than carbon inputs from the watershed during the first 4 years for similar carbon inputs, which indicates a faster
crease in emissions in NT2R than at Petit Saut. This sharp de-crease in emissions at NT2R might be due to the fact that the flooded pool of OM and therefore the amount of labile OM in NT2R was twice smaller than the amount of OM flooded in the Petit Saut (Guérin et al., 2008; Descloux et al., 2011). We show here, as it was done at Petit Saut (Abril et al., 2005; Guérin et al., 2008), that external sources of carbon are not sufficient to fuel the CO2emissions from the NT2R and we
attribute the decrease in emissions with time to the exhaus-tion of the most labile fracexhaus-tion of the flooded pool of OM, which might be the main source of reactive carbon in the reservoir.
In the subtropical NT2R, CO2 concentrations are always
higher at the bottom than in the epilimnic waters even dur-ing the CD season when the limited thermal stratification or its absence do not favour hypolimnic CO2accumulation. The
CD season is probably the most favourable season to pelagic respiration as this process is enhanced by the re-oxygenation of the water column (Bastviken et al., 2004). Since CO2
concentration in the CD season is 50 % lower than in the warm seasons, we suggest that CO2 is mostly produced in
the sediment and flooded soils and vegetation. Disregarding the station RES9 located at the water intake, significant spa-tial variation in CO2hypolimnic concentrations were found
between stations located in the area of dense forest (RES1–3) versus stations located in areas close to the three main trib-utaries (RES6–8). Stations RES1–3 which have the highest average bottom concentrations are located in areas where the carbon density is 50 % higher than the agricultural ecosys-tems that were flooded in the area of the stations RES6–8 (Descloux et al., 2011).
In the absence of significant vegetation regrowth in the drawdown area during the study period, the main source of carbon fuelling emissions from the drawdown area are not clearly identified. Immediately after flooding, the most la-bile part of the soil OM and the decomposing vegetation must have been the main sources of C fuelling the emis-sions. In the long run, the atmospheric carbon sink associ-ated with the pristine vegetation dynamics has been lost, but as a consequence the loss of this vegetation might reduce la-bile OM inputs. In addition, the water-level variations erode the soil and OM is transferred to the reservoir and ultimately to the sediments or downstream (Feìlix-Faure et al., 2017). Those carbon losses should have resulted in or should re-sult in the future in a decrease in CO2 emissions from the