International Journal of Innovative Technology and Exploring Engineering (IJITEE)
ISSN: 2278-3075, Volume-9 Issue-1S, November 2019
157
Published By: Blue Eyes Intelligence Engineering & Sciences Publication
Retrieval Number: A10331191S19/2019©BEIESP DOI: 10.35940/ijitee.A1033.1191S19
Performance Characteristics of Various Converters
for Non Linear System
N. Padmavathi, A. Chilambuchelvan, G. Nalinashini
Abstract: Power Extraction from renewable energy sources plays a vital role in this century due to the depletion of non renewable energy sources, socio economic factors and expensive cost .Few examples of renewable energy sources are Solar, wind, Fuel cell and hydraulic forces. Compared to other resources solar energy leads to the best option because of the availability and less design complexity. Different converters are available for extracting the maximum power from the panel. In this paper solar panel voltage is extracted with the use of MPPT algorithm along with Boost, Buck and SEPIC converters and their performance is analyzed. Based on the performance analysis boost converter with PV panel is implemented along with MPPT algorithm. Using MATLAB Simulink 2018 environment PV panel and different types of converter are modeled and its characteristics are evaluated.
Keywords: MPPT algorithm, PV panel, SEPIC converter and MATLAB Simulink.
I. INTRODUCTION
P
reserving Earth’s energy has become an potential concern in this century because energy shortage will occur after a few decades. The interest in solar power has been fast growing due to its advantages that include: i). Explicit electric power form, ii) Less maintenance, iii). Free from pollution. Compared to other Renewable Energy Sources, Solar panels are leading in a wide range of applications, from small building incorporated systems (Roof top units) to large scale utility systems (Solar Power generation Unit) [4].The structure of this paper is prepared as follows, in section 2, Characteristics of PV Panel, section 3 will present a summary of the used MPPT techniques. Section 4, will present the performance characteristics of the different types of converters, Maximum Power Point Tracking from Boost converter based solar panel and section 5 will combine the conclusions.
Revised Manuscript Received on November 22, 2019.
* Correspondence Author
N.Padmavathi, EIE, RMD Engineering College,Chennai,. Email:[email protected]
G.Nalinashini, EIE, RMD Engineering College,Chennai,. Email:[email protected]
Dr. A. Chilambuchelvan, Professor & Head Department of EIE, RMD Engineering College, Chennai. Email:[email protected]
II. MODELING OF SOLAR PANEL AND MAXIMUM POWER POINT
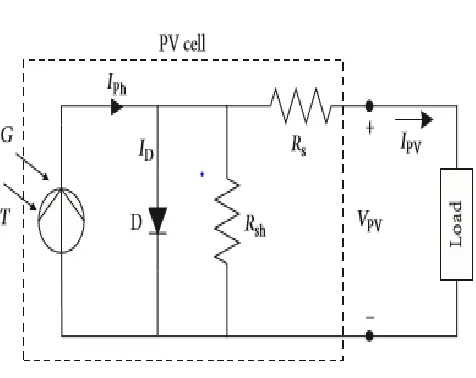
Solar panel consists of number of photo voltaic (PV) panels which are connected in series or parallel to extract the maximum power from sun. It is based on the photovoltaic effect through which the radiation from the Sun (photon) converted into electricity. The basic unit in the PV module is the reverse biased PN diode. One diode and two diode models are available. In order to extract the maximum power number of solar cells are connected to form a module. To produce the power in terms of MW / GW n number of PV modules is connected in parallel configuration. The output from the pv cell is directly proportional to the irradiation and temperature of the panel.
𝑰𝒑𝒉= 𝑰𝒔𝒄,𝒏+ 𝜶 𝑻 − 𝑻𝒏 𝑮 𝑮𝒏
… … … (𝒆𝒒𝒏 𝟏)
Where,
Iph – Current from photovoltaic cell
I sc,n– Short circuit current at the apparent condition G – solar irradiance
[image:1.612.327.565.447.636.2]T – Temperature
Fig 1. Single diode model of a PV cell
The single diode model of a PV cell represents the cell current given equation 2
𝑰𝑷𝑽=
𝑰𝒑𝒉− 𝑰𝟎 𝒆 𝒒 𝑽+𝑰.𝑹𝒔 𝒏.𝑲𝑩.𝑻 − 𝟏 − 𝑽+𝑰.𝑹𝒔
158
Published By: Blue Eyes Intelligence Engineering & Sciences Publication
Retrieval Number: A10331191S19/2019©BEIESP DOI: 10.35940/ijitee.A1033.1191S19
Ipv – cell output current (A) Iph – Current from photovoltaic cell Io– dark current
[image:2.612.94.207.151.223.2]V – Cell output voltage q – electronic charge KB– Boltzmann’s constant n- Ideality factor
Fig. 2 Simulation model of PV Panel
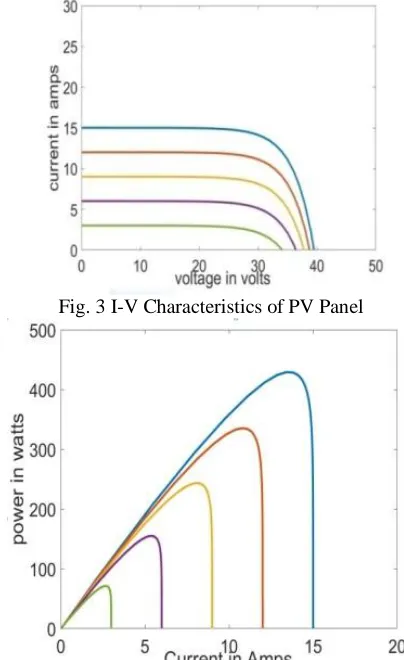
[image:2.612.67.269.382.712.2]Figure 3 and 4 represents the characteristics of the PV panel with different temperature and radiation. From the figure 3 and 4 we inferred that the Voltage and power is zero at the maximum short circuit current. On the other hand the solar cell can distribute the maximum power for a particular radiation and temperature and it is known as the maximum power point (MPP). From the eqns.1 and 2, output current is to be non linear and susceptible on the emission and temperature. These equations are also used to calculate the current and voltage values of the panel in MPPT algorithm
.
Fig. 3 I-V Characteristics of PV Panel
Fig. 3 P-V Characteristics of Solar Panel
Constant voltage method, short circuit current method, and as well, intelligent computing method. The above mentioned MPPT methods can dominance the PV panel’s voltage or current to trail and maintain the MPP of the PV panel to increase the PV panel efficiency. Recently more converters are utilized for that purpose along with different types of MPPT algorithm.
III. MPPT ALGORITHM A. Perturb & observe algorithm
The most commonly used MPPT algorithm is P&O method in which it uses simple feedback arrangement and little measured parameters. In this algorithm, the panel voltage is regularly given a perturbation and the corresponding. Solar energy is the most potential candidate of green energy. Due to non linearity in PV panel characteristics is maximum power varies with partial shading effect, temperature and irradiation. The efficiency of the PV Panel is mainly based on the determination of maximum power point (MPP) irrespective of the size and type of the panel [4]. To eliminate this drawback Maximum Power Point Tracking (MPPT) techniques were used. The following methods are proposed such as hill climbing method, perturb and observe (P&O) method, incremental conduction method. Output power is compared with that at the previous perturbing cycle. A small perturbation is introduced into the Incremental conductance system. The power of the solar module varies with respect to the perturbation [5]. The amount of perturbation is linearly proportional to the power till the MPP. Once the MPP is reached perturbation reverses as shown in Figure 4.
IV. CHARACTERISTICS OF DIFFERENT CONVERTERS
In order to enhance the ratio between output power and installation cost, dc/dc converters are used to draw maximum power from the PV panel array [9], [10].
Types of DC – DC converters used in PV panel i). Boost converter
ii). Buck converter
iii). Buck – Boost Converter iv). SEPIC Converter
B. Characteristics of Boost converter
Boost converter is used to increase the input voltage to the necessary level.
International Journal of Innovative Technology and Exploring Engineering (IJITEE)
ISSN: 2278-3075, Volume-9 Issue-1S, November 2019
159
Published By: Blue Eyes Intelligence Engineering & Sciences Publication
Retrieval Number: A10331191S19/2019©BEIESP DOI: 10.35940/ijitee.A1033.1191S19
Fig 4. P&O algorithm flow chart
Fig 5. Boost Converter
𝑓𝑠 = 1 / 𝑇
T = Ton + Toff Where,
fs – Switching frequency T – Time period
When the switch is closed,
The Inductor current is continuous by the proper selection of value of L. Inductor current varies from the positive value to peak during the ON state and drops down to zero during the off condition. So the net change of inductor current over the complete cycle is zero.
[image:3.612.54.281.46.502.2]C. Buck – Boost Converter
Fig 5. Buck - Boost Converter
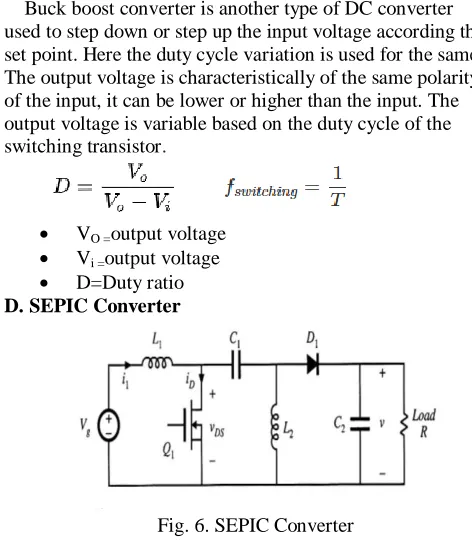
Buck boost converter is another type of DC converter used to step down or step up the input voltage according the set point. Here the duty cycle variation is used for the same. The output voltage is characteristically of the same polarity of the input, it can be lower or higher than the input.The output voltage is variable based on the duty cycle of the switching transistor.
VO =output voltage
Vi =output voltage
[image:3.612.322.558.52.322.2] D=Duty ratio D. SEPIC Converter
Fig. 6. SEPIC Converter
It is similar to boost converter but it provides the output voltage same as in the polarity of the input voltage. This feature is not present in the Buck - Boost converter. SEPICs are appropriate in requests in which a battery voltage can be above and below that of the regulator's planned output.
IV. RESULTS AND DISCUSSION
[image:3.612.49.295.563.712.2]160
Published By: Blue Eyes Intelligence Engineering & Sciences Publication
Retrieval Number: A10331191S19/2019©BEIESP DOI: 10.35940/ijitee.A1033.1191S19
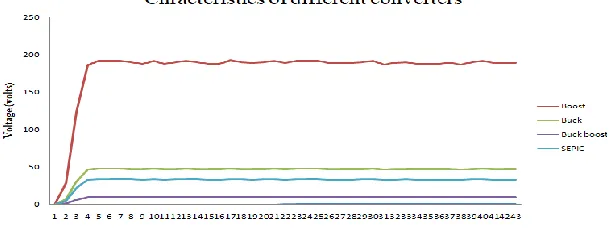
Fig 7. Output characteristics of the Boost, Buck, Buck – boost and SEPIC converter
Based on the discussion from the fig. 7 and Table 1 the next section proposed the PV Panel along with Boost converter and the maximum power point is extracted using P&O algorithm.
Time secs
Voltage in volts
Boost Buck Buck Boost SEPIC
0 0 0 0 0
0 28.385 7.09625 1.29022727 4.979824561
0.005 123.872 30.968 5.63054546 21.73192982
0.008 185.72 46.43 8.44181818 32.58245614
0.012 191.146 47.7865 8.68845455 33.53438596
0.015 191.146 47.7865 8.68845455 33.53438596
0.018 191.146 47.7865 8.68845455 33.53438596
0.021 190.061 47.51525 8.63913636 33.34403509
0.024 187.891 46.97275 8.5405 32.96333333
0.026 191.146 47.7865 8.68845455 33.53438596
0.03 187.891 46.97275 8.5405 32.96333333
0.032 190.061 47.51525 8.63913636 33.34403509
0.036 191.146 47.7865 8.68845455 33.53438596
0.039 190.061 47.51525 8.63913636 33.34403509
0.042 187.891 46.97275 8.5405 32.96333333
0.044 187.891 46.97275 8.5405 32.96333333
0.047 192.231 48.05775 8.73777273 33.72473684
0.05 190.061 47.51525 8.63913636 33.34403509
0.053 188.976 47.7865 8.58981818 33.15368421
0.056 190.061 47.7865 8.63913636 33.34403509
0.059 191.146 47.244 8.68845455 33.53438596
0.061 188.976 47.244 8.58981818 33.15368421
0.065 191.146 47.244 8.68845455 33.53438596
0.067 191.146 47.7865 8.68845455 33.53438596
0.07 191.146 47.7865 8.68845455 33.53438596
0.073 188.976 47.244 8.58981818 33.15368421
0.076 188.976 47.244 8.58981818 33.15368421
0.079 188.976 47.244 8.58981818 33.15368421
[image:4.612.157.464.58.173.2]0.082 190.061 47.244 8.58981818 33.34403509
Table .1 Quantitative Analysis of Boost, Buck, Buck – Boost and SEPIC Converters
International Journal of Innovative Technology and Exploring Engineering (IJITEE)
ISSN: 2278-3075, Volume-9 Issue-1S, November 2019
161
Published By: Blue Eyes Intelligence Engineering & Sciences Publication
Retrieval Number: A10331191S19/2019©BEIESP DOI: 10.35940/ijitee.A1033.1191S19
The PV Panel with the following specification
simulated in MATLAB environment in Intel i7 processor
Parameters Values
Voc – Open circuit 23.5
Isc - short circuit 5.6
V - Voltage 16.7
Current - I 3.45
Power max(maximum) – Pm 68.9
Quality factor - A 1.2
[image:5.612.61.240.52.162.2]Table 1 Data inputs for simulation - PV module ISOFOTON I-75The boost converter is connected along with solar panel and the duty cycle of the boost converter is varied based on P&O algorithm through the PWM controller. Fig.8 represents the simulation diagram of the PV panel.
Fig 9. PV Voltage, Current and Boost converter output waveforms
From the Fig 9 PV panel output voltage is increased from 50 volts to 180 volts by the implementation of Boost converter along with MPPT algorithm. Implementation of Boost converter is very simple compared to other types. It is very useful to extract the power from the panel under the Partial shaded condition also.
REFERENCES
[1] E. Koutroulis, K. Kalaitzakis, and N. C. Voulgaris, “Development of a microcontroller-based, photovoltaic maximum power point tracking control system,” IEEE Trans. Power Electron., vol. 16, no. 21, pp. 46–54, Jan. 2001.
[2] M.Veerachary,T.Senjyu,andK.Uezato,“Maximum power point tracking control of IDB converter supplied PVsystem,”inProc.IEEE Proc.Elect. Power Appl., 2001, pp. 494–502.
[3] A. Pandey, N. Dasgupta, and A. K. Mukerjee, “High-performance algorithms for drift avoidanc eandfasttrackinginsolarMPPTsystem,” IEEE Trans. Energy Convers., vol. 23, no. 2, pp. 681–689, Jun. 2008. [4]. Random Forest-Based Approach for Maximum Power Point Tracking of Photovoltaic Systems Operating under Actual Environmental Conditions, HussainShareef,1 AmmarHusseinMutlag,2 andAzahMohamed3, Hindawi Computational Intelligence and Neuroscience, June 2017.
[5] N. Femia, G. Petrone, G. Spagnuolo, and M. Vitelli, “Optimization of perturb band observe maximum power point tracking method,” IEEETrans. Power Electron., vol. 20, no. 4, pp. 963–973, Jul. 2005. [6] J. Sachin and V. Agarwal, “An integrated hybrid power supply for
distributed generation applications fed by nonconventional energy sources,” IEEE Trans. Energy Convers., vol. 23, no. 2, pp. 622–631, Jun. 2008.
[7]. Ahmed M. Atallah, Almoataz Y. Abdelaziz, and Raihan S. Jumaah “Implementation Ofperturband Observe MPPT of PVSystem With Direct Control Method Using Buck And Buck Boost Converters”, Emerging Trends in Electrical, Electronics & Instrumentation Engineering: An international Journal (EEIEJ), Vol. 1, No. 1, February 2014.
[8] A. F. Boehringer, “Self-adapting dc converter for solar spacecraft power supply,” IEEE Trans. Aerosp. Electron. Syst.,vol.AES-4,no.1,pp.102– 111, Jan. 1968.
[9] B. Subudhi and R. Pradhan, "A Comparative Study on Maximum Power Point Tracking Techniques for Photovoltaic Power Systems", IEEE Trans. Sustain. Energy, vol. 4, no. 1, pp. 89-98, 2013. [10] M. A. Elgendy, B. Zahawi, and D. J. Atkinson, Assessment of the
incremental conductance maximum power point tracking algorithm,” IEEE Trans. Sustain. Energy, vol. 4, no. 1, pp. 108–117, Jan. 2013.
AUTHORS PROFILE
Mrs. N. PADMAVATHI is working as assistant professor in the department of EIE at R.M.D Engineering College. Her areas of interest are Renewable Energy Systems, Converters in Solar Panels, soft computing. She has presented 05 papers in International Conferences and published Two papers in International journals.
Dr. A. CHILAMBUCHELVAN is working as Professor & Head in the department of EIE at R.M.D Engineering College. His reas of interest are embedded system, VLSI design, soft computing. He has published 46 papers in International journals.
[image:5.612.59.290.415.521.2]Dr. G. Nalinashini working as associate professor in the department of EIE at RMD Engineering College obtained her PhD (Electrical Engineering) from Anna University, Chennai in the year 2014. Her areas of interest include Electrical Engineering, Special Electrical machines, Artificial Intelligence, Biomedical Instrumentation, Programmable Logic Controllers. She has published 12 papers in various International Journals and Conferences.