Abstract: In Present generation there is drastic increase in the production of Milk which eventually made increment of Milk Centres in different areas. Since most of the milk come from farmers ,the probability of misrepresenting the information is very high where farmers do not understand ,In order to make the system very transparent to all the people who deposit the milk, The paper is designed to automate the measuring of the fat content present in the milk with the help of Embedded Technology. This System is designed in such a way to work without any human interaction. The system used the concept of diffraction of light to calculate the fat percentage of the milk using LDR and LASER (Spectroscopy Concept). The System also used the Unique identification technique using RFID. The System will also store the information of the depositors for future references of data. This being a completely automated system, this will decrease the amount of any illegal activities performed by the vendors at the Milk Station
Keywords: RFID, LDR, LASER
1. INTRODUCTION
The Dairy industry in India is generally a co-operative sector. The primary milk provider to the dairy are farmers who do not process their milk and give it in the raw form to the cooperative dairy [1]. Since a greater number of farmers is depositing their milk in the dairy, it is a daily task of the dairy to assess the quality of milk from each farmer, verify the quality norms specified by government and based on quality and quantity of milk they the make payments [2-3]. The process followed in dairy form is manual, the vendor will take the sample of the milk into a test tube then with the help of lactometer the vendor will find out the fat content of the sample that is for 5ml after that the vendor will allow the depositor to deposit the entire milk ,then all the details will be noted manually ,at the end of the month the farmer will get the payment for the whole month , In between this process there are more chances of illegal activities that can be made at the side of Milk collection centres, which may cause unfair to the depositor [4-5]. This
Revised Manuscript Received on April 12, 2019.
Dr.M Sujatha, Department of Electronics and Communication Engineering, Koneru Lakshmaiah Education Foundation, Guntur-522502, India.
P. Nagarjuna, Department of Electronics and Communication Engineering, Koneru Lakshmaiah Education Foundation, Guntur-522502, India. ([email protected])
A. Bala Sai Ram, Department of Electronics and Communication Engineering, Koneru Lakshmaiah Education Foundation, Guntur-522502, India.
A. Hemanth Venkata Sai, Department of Electronics and Communication Engineering, Koneru Lakshmaiah Education Foundation, Guntur-522502, India.
K. Tarun, Department of Electronics and Communication Engineering, Koneru Lakshmaiah Education Foundation, Guntur-522502, India.
Sk Hasane Ahammad, Department of Electronics and Communication Engineering, Koneru Lakshmaiah Education Foundation, Guntur-522502, India.
illegal activity may happen knowingly or Unknowingly due to human error etc.., All these will create losses to the Country man.
2. RELATED WORK
Many analytical techniques have been developed to measure the adulterations quantitatively and qualitatively. The review of milk adulteration, its effects on human health and the techniques of detection of adulteration has been done. India is world ‘s largest milk producer country. The farmers took more interest in dairy industry and a greater number of co-operative dairies are formed in villages. Dairies collect, test and rate the milk [6]. The two general methods that are followed are: 1) Using Lactometer 2) Gerber Method. A lactometer is a tool used to determine the lavishness of milk so that we can measure the milk purity in the sample, it consists of two parts test tube and a meter bulb. The Gerber approach is a number one and ancient chemical test to determine the fat content of the materials most normally milk and cream[10-15]. There is no low-cost alternative available to check the adulteration at primary level [7]. Hence it was intended to develop the simple, low cost, battery operated and handy tool to test the quality and quantity of the milk. The project development is based on the principle of detection of milk adulteration using electronic sensors. The advantages such as size, weight, power consumption, speed etc. can only be offered by embedded systems, so it was decided to use embedded system in the development. This system addresses all the above-mentioned problems [8]. It also reduces human interaction and the man force required to execute the entire process. Our system is like a money deposit system that is found at an ATM or a bank. We have removed the person at the milk collection centre thereby removing the factors or human cheating and human error. The farmer can go to the deposit machine and deposit his milk without any agitation. The system will calculate the fat percentage the weight that he deposited and the amount that he will receive for it. He will also receive a text message with the same details for proof, if any discrepancies occur and he can take it up with the concerned authority. This system is also helpful for the government as it reduces the man power required and thereby saving the money in form of man power [9]. The cost of production of this system is also cheaper than setting up a separate collection centre. Instead of using the conventional machines for testing the fat percent of milk, which are very expensive, we have designed our own mechanism to achieve the same at a really lower cost and high accuracy.
Visible Spectroscopy Analysis of fat Content
in Milk using LabVIEW
3. PROPOSED WORK
[image:2.595.66.270.51.163.2]Figure 1. Block Diagram of the Proposed System
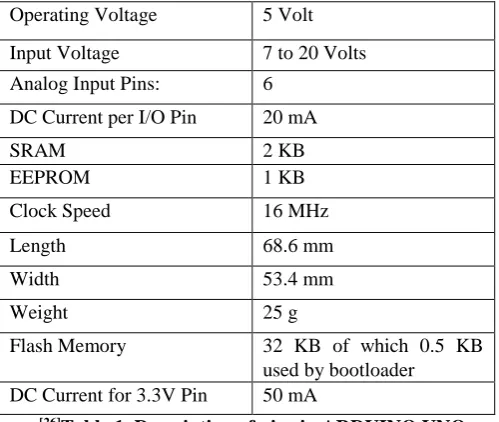
Figure 1 clearly describes the block diagram of the whole proposed system. This project uses Arduino Uno which is a microcontroller and interfaced with other components as mentioned in the Figure 1, It is based on the Microchip ATmega328P microcontroller and it is developed by Arduino.cc. it is an open source microcontroller making it very useful for low cost projects.
Operating Voltage 5 Volt
Input Voltage 7 to 20 Volts
Analog Input Pins: 6
DC Current per I/O Pin 20 mA
SRAM 2 KB
EEPROM 1 KB
Clock Speed 16 MHz
Length 68.6 mm
Width 53.4 mm
Weight 25 g
Flash Memory 32 KB of which 0.5 KB
used by bootloader DC Current for 3.3V Pin 50 mA
[26]Table 1. Description of pins in ARDUINO UNO
Table 1 describes the complete details and description of various pins and their specifications of the board.The Uno board has sets of digital and analog input/output pins that can be interfaced with various expansion boards, shields, sensorsand other circuits [26].
3.1. LCD (Liquid Crystal Display)
Liquid Crystal display is the combination of matter of two states one is liquid and the other is solid. Images or the text will be produced by liquid crystal in Liquid crystal display. The technology used in Liquid crystals are super thin technology which is famously known to be used in Tv’s, Cell phones [22].
Pin Number/Symbol Description
Vss 0v Ground
Vdd 5v
VO Variable Operating
Voltage
RS (H/L) H: Data; L: Instruction
RW(H/L) H: Read; L: Write
A 5V LED+
A 0V LED-
E H to L (chip enable
signal)
DB0 to DB 7 Data bus lines
[22]Table 2. Description of pins in LCD
Table 2 describes the specifications of various pins present in the LCD and their desvcription ,From Table 2 RS and RW will be operated in High/Low voltages which performs different actions for this volatges.
3.2. I2C Protocol
It is one of the Protocols of Serial Communication. It is also called as two wire protocols or Inter Integrate protocol which will be used for serial communication. It was introduced by Phillips Semiconductors. It has 2 wires called as SCL and SCD. It has a data transfer mode of 100 kilo bites and the addressing of 7 bits. These 7-bit addressing allows total of 128 devices to communicate with I2C bus. The devices are capable of interfacing with I2c are Real time clocks, PROMS etc.., Here microcontroller will behave as master and the rest of the devices will behave as slaves.
3.2.1. Interfacing Arduino With I2C Protocol
I2C Arduino
SCL A5
SDK A4
VCC 5V
GND GND
[23]Table 3. Interfacing pins with ARDUINO and I2C
Table 3 describes the interfacing of pins of I2C module with Arduino.It has 2 pins clock(SCL) and data(SDK) which will read and write the data from the instruction specified in the board,This I2C protocol will reduce the number of pins for interconnection with LCD and Arduino,so that Arduino can perform more actions instead of wasting many pins for single action
3.3 Arduino Interfacing with RFID
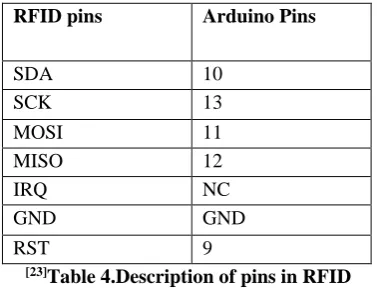
[image:2.595.42.292.282.493.2] [image:2.595.307.550.332.408.2]RFID pins Arduino Pins
SDA 10
SCK 13
MOSI 11
MISO 12
IRQ NC
GND GND
RST 9
[23]Table 4.Description of pins in RFID
Table 4 has different pins present in RFID reader and also interfacing those pins with the Arduino,The interfacing can be done in two ways one is using Tx and Rx and another way is as mentioned in Table 4,RFID will have pins starting from Serial data(SDK),Serial clock(SCK),Master Ouput
Slave Input(MOSI),Master Input Slave
Output(MISO),Interrupt Request(IRQ),RST(Reset),VCC and GND[23].
3.4 LASER (Light Amplification by Stimulated Emission of Radiation)
The LASER works on the Principle of Stimulated Emission in the visible region the range of the Laser is 400nm to 700nm. This Laser will be used in our module in order to find the fat content of the milk whenever a LASER light falls on the liquids it spreads or the light intensity of LASER reaching the other side decreasing. There are different intensities of light for different solids. The milk with more fat will be thicker compared to the milk with less fat content so the intensity of the light varies accordingly.Here LDR pin A2 will read the input and serial monitor is used to test the LDR pin.
3.5. Interfacing Arduino with Servo
Servo Motors are used where there is need of movement. This will not be applicable for high speed positions these will be applicable for low speed and accurate movement. This Motors have wide applications in various control systems. In the project Servo motors are used to control the movement of test tube where the fat content will be tested by attaching LASER and LDR to it and also to dispose the tested milk. The other purpose is to open and close the door automatically whenever user scans the Card.
3.6. Interfacing Arduino With Load Cell
Load Cell is used to determine the weight of the object whenever a weight is applied on the Load cell the strain of the load cell varies which will result in change in the voltage since the changes are very minimum we have to use an amplifier called HX711 which is a load cell amplifier a precision of 24 bit analog to digital convertor. Load cell has many applications in the field of industry.
HX711 LOAD CELL
E+ RED
E- BLACK
A- GREEN
[image:3.595.75.264.49.193.2]A+ WHITE
Table 5. Interfacing HX711 and LOAD CELL
Arduino HX711
D3 SCK
[image:3.595.392.537.61.115.2]D4 DT
Table 6. Interfacing ARDUINO and HX711
Table 5 and Table 6 describes the various pins and interfacing details of Load Cell , HX711 will be connected to D3 and D4 pins of Arduino,Hx711 also has Serial clock(SCK) and Data(DT) pins.
The code will give the weight of the object. In order to get the correct output, the calibration of the system should be perfect and after calibrating the system should not be disturbed.
3.7. Interfacing GSM module with Arduino
GSM is the Global System for Mobile Connection, there are different types of GSM modules in this system uses SIM 900 GSM module. GSM will help to communicate automatically without the need of human interaction. The module will automatically send the message, make calls and even receive message and start the action according to the message. But in this project, we are using only the send message option without need of human interaction.
GSM SIM 900 Arduino
Tx Rx
Rx Tx
[image:3.595.317.538.357.408.2]Table 7. Interfacing GSM and ARDUINO
Table 7 describes the details of interfacing the GSM SIM 900 and Arduino with Transmitter and Receivier pins and This project Used GSM module in order to notify the customer about the amount of milk deposited, fat content and Weight of milk.
[image:3.595.321.532.493.601.2]4. WORKING OF PROPOSED METHOD:
Figure 2. Simulation Diagram in Circuit.IO Software
[image:3.595.48.291.712.779.2]Figure 3. Interfacing all the required Components into single Arduino of Proposed model
Figure 3 describes the final model of the proposed system and components to interface them with Arduino.Firstly the Depositor will scan the RFID tag , If there is a match then the rest of the process will begin ,the depositor will have to pour the sample milk in the one of the opening of the machine for the measurement of fat analysis ,here the LDR and LASER will be fitted where the process of calculating the fat content will be done. Then the main opening for pouring the entire milk will get opened ,the depositor has to pour the entire milk ,this opening will be connected to a container where the wait of the milk will be calculated the respective calculation will be made in the system itself ,All this process will be displayed very clearly in the LCD provided ,Finally all the details will be sent to the mobile of the respective person by using GSM module.
4.1. Working of fat Content Measurement:
The Concept used here is Measuring of the intensity of the light ,The light source used in this project is LASER ,One of the property of the light is whenever light passes through the substance it will get scattered or diffracted which will result in changing the intensity of the light on the other end, The LDR will be placed on the other side of test tube in order to measure the changes of the intensity of the light. With this changes the amount of fat content will be analyzations Entire system should be kept in a closed environment as to get the precise readings
5. RESULTS AND ANALYSIS
A sample of 5ml is separated from the milk and is taken into a test tube. The test tube is placed in between the laser on one side and the LDR on the other side. The laser is turned on and the reading of the LDR is noted down. The change in resistance of the LDR corresponds to the fat percentage in the milk to get maximum accuracy 20 values of LDR are taken and their cumulative average is used for the calculations.
SAMPLE LDR VALUES
No sample 1023
Water 980-1000
Milk 730-740
20%(water),70%(milk) 760-780
[image:4.595.60.272.62.178.2]20%(milk),70%(water) 900-910
Table 8. Values for different fat contained milk obtained from the system
[image:4.595.307.548.259.346.2]Table 8 describes the Various fat contained milk and their corresponding values of the LDR which is tested with an average of 20 values ,if there is no sample the LDR will have one value ,for different samples there are different values.The more the fat content in the milk the more will be the diffraction of laser and the less will be the LDR reading. The corresponding LDR values are calibrated to get the corresponding fat percentage. Initial calibration was done using preprocessed milk whose fat percentage was predefined. Then these sample milks with known fat percentage were diluted using water to get different fat percentages and their readings were calibrated to corresponding fat percentage.
Figure 4. List of data stored in database using LabVIEW
[image:4.595.307.549.449.690.2]Figure 4 shows the List of different data that is obtained using LabVIEW software for the analysis of the data by the Milk Center or for the future references,Each row is reserved for a single user,so that when the user cpmpletes the process the data will be stored in respective row.
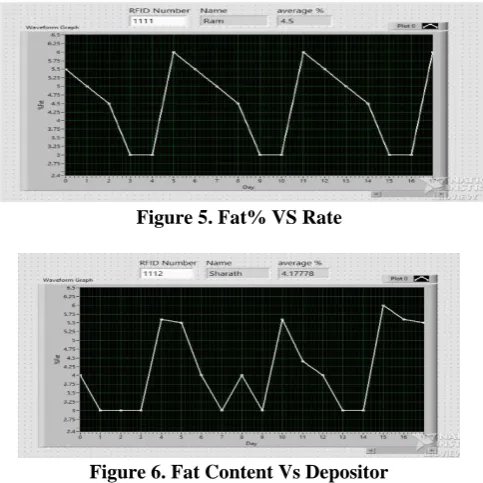
[image:4.595.40.295.690.769.2]Figure 5. Fat% VS Rate
Figure 6. Fat Content Vs Depositor
desposited and status of each despositor and the amount getting paid to the despositers.
The amount of milk deposited is measured using load cell. The weight is calculated and to avoid errors 50 readings from the load cell are taken and the average of these values is found which are mentioned in Table8.
[image:5.595.48.290.182.287.2]The amount of milk deposited with the fat percent determines the money to be deposited to the farmers account. All the details of the user are stored as shown in Figure 4 and their analysis is as shown in figure 5 and 6.
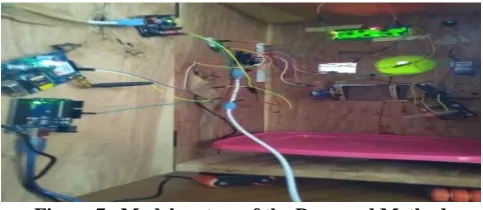
Figure 7. Model system of the Proposed Method
Figure 7 is the hardware model which is developed to test the working of the proposed methodology and achieved the presicion around 80% to 90% as compared with the original system in market.
FUTURE SCOPE AND CONCLUSION
This method is also accurate and precise with respective to other traditional methods, but the entire system must be closed space. This must be calibrated before putting it into practice by considering the fat content with other traditional methods. If the depositor cheats the machine by pouring other than milk the products like honey the system will not work properly until it is serviced. The system can be further developed to separate the different fat content milks into different containers and to identify the user who tries to spoil the machine.
REFERENCES
1. El-abassy, Rasha & Eravuchira, Pinkie & Donfack, Patrice & von der Kammer, B & Materny, Arnulf. (2011). Fast determination of milk fat content using Raman spectroscopy. Vibrational Spectroscopy - VIB SPECTROSC. 56. 3-8. 10.1016/j.vibspec.2010.07.001.Kessler, H. G.: Food and Bio Process Engineering - Dairy Technology, Verlag A. Kessler, München, 2002.
2. Harold Macy, W.B. Combs & C.H. Eckles,‖Milk & Milk Products‖, TMH, Fourth edition 1990.
3. JurjenDraaijer, ―Milk Producer group Resource Book a practical guide to assist milk producer groups‖, Pp.37-40. 4. Kessler, H. G.: Food and Bio Process Engineering - Dairy
Technology, Verlag A. Kessler, München, 2002.
5. Laurence A. Nafie, Recent advances in linear and non‐linear Raman spectroscopy. Part XI, Journal of Raman Spectroscopy, 48, 12, (1692-1717), (2017).
6. RupakChakravarty, a paper on‖ IT at Milk collection centers in Cooperative Diaries: The National Dairy Development Board Experience‖, pp.37-47.
7. Stang, M.: Zerkleinern und Stabilisieren von Tropfen beim mechanischen Emulgieren, Universität Karlsruhe (TH), 1998. (PDF) Homogenisation in the dairy process - conventional
processes and novel techniques.
8. SubhashBhatnagar, ―Empowering Dairy Farmers: A Portal and Dairy Information and Services Kiosk‖.
9. Wolf, W.H., ―Hardware-software co-design of embedded systems‖, IEEE Jul 1994, Page(s): 967 – 989.
10. [10]Kejal Shah, Rajeshri Kelkar,Amruta Sarda,M.S.Chavan2-“Photometric Based Sensor for Fat Detection in Fresh Milk”,International Journal of Innovative Research in Computer and Communication Engineering 2015, 2320-9801 11. [11]AK AUSTRALIANO, The lactometer and Analysis of
Milk, TOWN AND COUNTRY JOURNAL.
12. [12]Mahesh C,Waghmare,Yashpal Gogia, Design and
Analysis of a Sensor for Measurement of Fat Content in Milk using IoT Technique, IJSRD 2017 ,Vol. 5,Issue 05
13. Savaroglu G, Aral E (2007) Acoustic parameters of cow’s milk added hydrogen peroxide and sodium bicarbonate different temperatures. J Food Eng 79:287–292
14. Mohanan S, Thomas Panicker PG, Iype L, Laila M, Domini I, Bindu RG (2002) New ultrasonic method to detect chemical additives in branded milk. Pramana J Phys 59(3):525–529 15. Elvira L, Durán C, Sierra C, Resa P, Montero de Espinosa F
(2007) Ultrasonic measurement device for the characterization of microbiological and biochemical processes in liquid media. Meas Sci Technol 18:2189–2196
16. Marco Santonico,Giorgio Pennazza,Sergio Iarossi Ultrasound Based Sensor for Fat Detection in Fresh Milk, LNEE, volume 162 2013
17. Pallavi Gupta , Anwar Sadat , Mohd Jamilur, Rahman Khan, An Optoelectromechanical Sensor for Detecting Adulteration in Anhydrous Milk Fat IEEE Sensors Journal Volume:14 ,Issue: 9
18. Moupali Chakraborty Karabi Biswas Hardware Platform to Detect Fat Percent in Milk Using a Lipase Immobilized
PMMA-Coated Sensor IEEE Transactions on
Instrumentation and Measurement
19. Devesh Bhonge, Yashpal Gogia Design and Analysis of a Sensor for Measurement of Fat content in Milk using optical technique IJETR 2016 Volume-4, Issue-4
20. V. Gantner, P. Miji´c, M. Baban, Z. Škrti´c, and A. Turalija,
“The overall and fat composition of milk of various species,” Mljekarstvo, vol. 65, no. 4, pp. 223–231, 2015.
21. J. A. Lucey, D. Otter, and D. S. Horne, “A 100-year review:
Progress on the chemistry of milk and its components,” J. Dairy Sci., vol. 100,pp. 9916–9932, Dec. 2017
22. https://www.instructables.com/id/Interface-Lcd-With-Arduino-Beginner-Guide/
23. https://circuitdigest.com/microcontroller-projects/arduino-labview-interfacing-tutorial