International Journal of Innovative Technology and Exploring Engineering (IJITEE) ISSN: 2278-3075, Volume-8 Issue-6S, April 2019
Abstract: Electroencephalogram (EEG) is a popular method for diagnosing various neurological diseases. Major Depressive Disorder (MDD) is a mental health disorder that can be diagnosed and treated by making use of EEG. One of the main challenges in using EEG to accurately identify depression is complexity and variation that exist in the EEG of a depressed person. Manually reading EEG and diagnosing depression is very challenging. An efficient computer aided method can be used for this task. Of the many methods that exists, a deep neural network method called Convolutional Neural Networks (CNN) proved to be the most efficient. In this paper a multi-layer deep CNN algorithm is implemented to diagnose depression from EEG of patients. Depression is classified based on a severity index into mild, moderate and major classes. The accuracy, sensitivity and specificity were measured by varying various parameters of the proposed algorithm.
Index Terms: Convolutional Neural Network, Deep learning, EEG, MDD.
I. INTRODUCTION
Clinical depression or MDD is one of the most noteworthy mental conditions that can have a huge impact on many peoples’ lives [1]. It can affect a person’s attitude and conduct on top of varying their day to day activities such as sleeping and eating. People who are found to be severely affected with depression are found to get disinterested easily in social activities and in things that were once pleasurable. In worst cases they may find it troublesome to find a reason to live.
Depression is linked with inter-hemispheric imbalance; a hyperactive right-hemisphere (RH) and a relatively hypoactive left-hemisphere (LH) [3]. RH has more control in handing out negative feelings, gloomy views and undesirable thinking styles. These factors constitute the physiological nature of depression and consecutively lead to the eminent nervousness, pressure and agony associated with it. The RH is also found to be involved in shifting a person’s interest to themselves, leading the depressed person to refrain from their surroundings and people close to them. On the other hand, the LH is especially involved in the handling of enjoyable involvements. The LH is also found to be pretty well involved in decision-making activities, leading to the inconclusiveness that often comes up along with depression.
The electroencephalogram (EEG) is a recording of the
Revised Manuscript Received on April 11, 2019.
Anna Dominic, Department of Computer Science and Engineering, Mar Athanasius College of Engineering, Kothamangalam, India.
Dr. Surekha Mariam Varghese, Department of Computer Science and Engineering, Mar Athanasius College of Engineering, Kothamangalam.
Aswathy K J, Department of Computer Science and Engineering, Mar Athanasius College of Engineering, Kothamangalam, India.
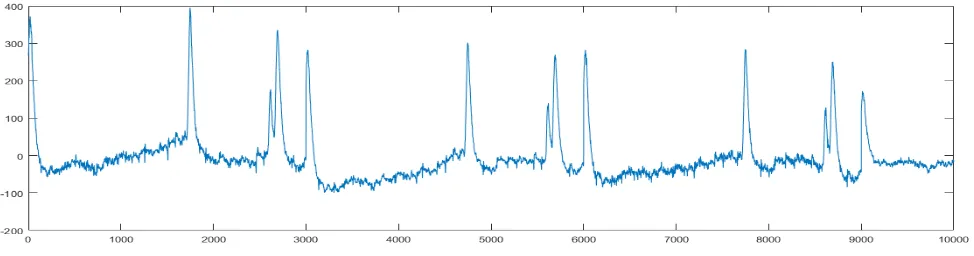
electrical activity of the brain from the scalp [4]. A sample EEG data obtained from one electrode is depicted in Fig. 1. The cortical electrical activity of the recorded waveforms is obtained in it. This mode of monitoring of brain activity is typically noninvasive, as it is done by placing the electrodes on the scalp of the brain. EEG estimates voltage fluctuations brought about by ionic charge discharged within the neurons of the brain. In medical settings, EEG denotes to the recording of the brain's natural electrical activity over some undefined time frame, as recorded by the several electrodes positioned on the scalp. An EEG can be utilized to help analyze and screen various conditions influencing the brain. EEG can be used to effectively diagnose depression from EEG of patients. It can be done by comparing EEG of the left and right hemisphere of brain. Depression can be diagnosed by identifying the hyperactive right hemisphere.
Most prevalent way of detection and diagnosis is based on visual examinations of EEGs by highly trained neurologists. Nonetheless, reading of EEG signals by manual evaluation is tedious especially with the bigger magnitude of EEG data which has to be studied manually. Most of the EEG software was found to incorporate some form of abnormality detection algorithm. As a result of low sensitivity and specificity of the pre-determined abnormality identification algorithms, the existing procedures of computerized abnormality identification are seldom utilized in medical practice.
Moreover, the intrinsic idea of manual evaluation can bring about changing medical explanations depending on the
EEG interpreter’s level of expertise in
electroencephalography. Confusing matters, the quality of the results may be meddled by artifactual signal which can restrain the interpreter’s skill to precisely recognize anomalies.
Deep learning is a machine learning method that enables computers to learn by example just like how humans teach themselves. Learning in deep learning classification methods is done by computerized model directly from pictures, manuscripts or sound. Deep learning models are found to achieve high accuracy, and often surpassing manual performance. Large data sets of labeled or unlabeled data are used for the training of the model and the deep learning network architectures are designed to comprise of multiple layers. The accuracy obtained in classification and accuracy is better than all previous methods.
A convolutional neural network (CNN or ConvNet) is one of the most widely used deep neural networks. They are found to be appropriate for
working with 2D data, which
Deep Learning in Computer Aided Diagnosis of
MDD
Fig. 1. Sample EEG data
include images, since it performs convolution operation with input data and the features learned using 2D convolutional layers. Manual extraction of features is not required in CNN thus eliminating the need for it in classification operations. The ex-traction of features by CNN is done directly from images. Thus pre-training is not needed on the significant features; they are extracted during training of the network on an image set. This type of computerized extraction of relevant features helps deep learning models to be extremely efficient in computer vision processes like object classification.
In this study, we are employing a deep learning method to automatically recognize severity of depression with the help of EEG signals automatically. A multi-layer deep convolutional neural network (CNN) is designed and developed to classify depression based on severity into three classes: mild, moderate and major.
II. RELATEDWORKS
Sudarshan et al. [4] explored several nonlinear approaches for EEG centered detection of depression: Detrended Fluctuation Analysis (DFA), Fractal Dimension (FD), Higher Order Spectra (HOS), Largest Lyapunov Exponent (LLE), Recurrence Quantification Analysis (RQA), Hurst’s Exponent (H) and Sample Entropy (SampEnt). The obtained features are graded and organized in accordance with their importance by means of its t-value and was put into 5 distinct classifiers. It is reported that Support Vector Machine (SVM) provides top diagnostic assessment with a normal accuracy of around 98%. Furthermore, it was suggested to use Depression Diagnosis Index (DDI) which utilizes a mixture of the obtained non-linear features.
Yassin et al. [5] likewise made use of SVM classifier for distinguishing normal and depression EEG signals having particular medical features obtained from EEG data. The attained EEG data were exposed to noise elimination in addition to feature ex-traction. Only the utmost important features were utilized for the testing and training of classifier structures: Support vector machine (SVM), Naïve Bayesian (NB) and Logistic regression (LR). 10-fold cross validation was used to check validation of the classifier which delivered performance metrics like test specificity, accuracy and sensitivity. Utmost important features like EEG alpha inter-hemispheric asymmetry obtained from the regions of brain for instance frontal, temporal, parietal and occipital and EEG signal power were found major.
Liao et al. [6] made use of the common spatial pattern of kernel Eigen filter bank as well as Principal Component Analysis (PCA) [7] to attain features relating to depression from EEG data and SVM [8] for the purpose of classification. A different method was proposed by them, grounded on electroencephalography (EEG) signals from scalp of the brain and a EEG feature extractor called kernel Eigen filter bank common spatial pattern (KEFB-CSP) having robust spectral-spatial properties. At first, the KEFB-CSP feature extractor filters the recorded multi-channel EEG data to get a collection of frequency sub bands which belong within the range between theta and gamma bands, following which the EEG signals belonging to each sub band is spatially transformed by it to convert it from the actual sensor space and get a new space in which the new signals such as Common Spatial Pattern (CSP) are found to be ideal for the purpose of classification of depression and healthy controls. Finally, the kernel principal component analysis (kernel PCA) is applied for the transformation of vector holding CSPs which spans all frequency sub bands to get a feature vector with-in a lower dimension, commonly known as KEFB-CSP.
Lately, Hagiwara et al. [9] proposed a system for detection of depression using an EEG centered CAD using Linear Predictive Coding (LPC) methodology which utilizes HOS parameters for extracting significant features for the classification processes. To detect and interpret the minute signal changes a computer-aided diagnosis (CAD) system is developed. Higher order statistic based parameters, such as variance, kurtosis, normalized kurtosis, skewness, normalized skewness is extracted from the linear predictive coding (LPC) residuals.
III. METHODOLOGY
International Journal of Innovative Technology and Exploring Engineering (IJITEE) ISSN: 2278-3075, Volume-8 Issue-6S, April 2019
Fig. 2. Proposed System Modules
A. Data
EEG was recorded from 60 depression patients [10]. Voltage from the scalp of the brain was measured using 64Ag/AgCl electrodes with the help of Synamps2 system (500Hz sampling rate, band pass filter 0.5–100, impedances <10 kΩ). The collected EEG dataset belongs to two classes: Depressed and control patients. EEG was measured for 37 symptomatic, drug-free patients with present or historical MDD and 23 control candidates performing a probabilistic reinforcement learning task. Control candidates (N = 23, 14 female) had steady low BDI (<7) amongst mass assessment and introductory studies, no self-reported account of depression, as well as no self-reported indications demonstrating the probability of an Axis1 disorder. For belonging to depressed category, patients were required to show a steady high BDI (>13), and had to meet conditions for present or historical MDD during a Structured Clinical Interview for the DSM-IV. A total of N = 37 (14 female) symptomatic participants met these criteria.
B. Preprocessing
Since we are handling EEG data, preprocessing the input dataset will involve elimination of noise that is present in it, so that the available data is closer to the real values measured. Preprocessing on EEG data can become necessary for many reasons. To begin with, the signals chosen from the scalp of a person are not essentially an exact depiction of the signals originating from the brain, as the spatial information is not retrieved. In addition, EEG data have a tendency to comprise frequent noise which can make EEG signals slightly ambiguous. Actions such as blinking or muscle movement may lead to contamination of data and thus result in distortion of the picture. Finally, the relevant neutral signals need to be separated from randomly occur-ring neural activity in EEG recordings.
At times EEG data (particularly high-density EEG records) will comprise ‘bad’ channels which can tamper the accuracy of data. Removing these bad channels in the early stages is important since it can have undesirable effects on later analysis. A channel can be considered bad in the following cases: the channel is faulty for various reasons, the electrode was inappropriately positioned or lost connection with the scalp (if using wet electrodes), multiple channels were bridged (if using wet electrodes) and the electrode became saturated.
Z-score normalization can be used to counter the problem of amplitude scaling and removal of offset effect in the EEG data before passing it as input to the CNN model.
C. Artificial Neural Network
Artificial neural networks (ANNs) are computing models
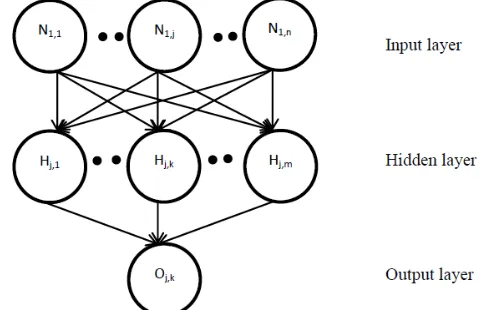
Fig. 3. A sketch of a characteristic structure of ANN
that can learn in a way similar to the working of biological neurons. ANNs are also made up of neurons (known as nodes or processing elements) that are connected by means of synapses (also known as links).
From a practical viewpoint, ANNs imitate the learning method carried out by the brain and may, preferably, be trained for recognizing whichever given set of input data by regulating the synaptic weights. An accurately trained network, theoretically, should be capable of applying this learned knowledge and return results properly to entirely new input values. Normally, an ANN comprises of three types of layers: in-put, hidden, and output layers (refer Fig. 3) [11].
The most frequent use of ANNs comes in supervised classification and hence has need of distinct training and testing data. The mathematical formalizations used in the system is dependent on training dataset as the learning part of the model is generally accomplished using the training dataset.
D. Convolutional Neural Network
CNNs, or ConvNets, are quite comparable to usual neural networks. They are also comprised of neurons with weights that can be learned from data. Every neuron takes some data as input and performs a dot product. They have a loss function on the last fully connected layer and use a nonlinearity function. Generally, there are three main layers in a simple ConvNet. They are the convolution layer, the pooling layer, and the fully connected layer [12].
The input layer holds the input data. In a fully connected layer, the neurons be-tween two adjacent layers are fully connected pairwise but do not share any connection within a layer. In other words, the neurons in a current layer have full connections to all activations in the preceding layer. Therefore, their activations can be calculated using simple matrix multiplication, optionally adding a bias term. A fully connected layer and convolutional layer are different in the fact that neurons in a convolutional layer are linked to a specific region in the input, and that the parameters are also shared among them.
The main objective of convolution in relation to ConvNet is to identify features from the input data. This layer does most of the computation in a
ConvNet. Convolution
[image:3.595.305.545.54.209.2]input and a filter with an appropriate stride value. A convolutional layer is a stack of feature maps, with one feature map for each filter. More filters increase the dimensionality of convolution. Higher dimensionality indicates more parameters.
The pooling layer controls overfitting by progressively reducing the spatial size of the feature map generated to lessen the number of parameters and computation. The pooling layer often takes the convolutional layer as input. The most commonly used pooling approach is max pooling. Besides max pooling, average pooling function can also be performed by pooling units. In a CNN, we can control the behavior of the convolutional layer by specifying the size of each filter and the number of filters. To increase the number of nodes in a convolutional layer, we can increase the number of filters, and to increase the size of the pattern, we can increase the size of the filter.
There are also a few other hyperparameters that can be tuned. One of them is the stride of the convolution. Stride is the amount by which the filter slides over the image. A stride of 1 moves the filter by 1 pixel horizontally and vertically. Here, the convolution becomes the same as the width and depth of the input image. A stride of 2 makes a convolutional layer of half of the width and height of the image. If the filter extends outside of the image, then we can either ignore these unknown values or replace them with zeros. This is known as padding.
IV. PROPOSEDSYSTEM
To develop the computational module several deep neural network models were at-tempted: Deep neural network, deep CNN and block based neural network. Out of these, CNN was found to be the most efficient one. This observation could be related to the nature the depression patients’ EEG signals. The distinct features of depression EEG does not depend uniformly on signals collected from all the electrodes. It is heavily influenced by electrodes placed in the regions of the brain belonging to the right hemisphere. The property of CNN is that it can extract features from regions of data rather than extracting features from the whole dataset. So the architecture de-scribed here is inspired from CNN.
A. Architecture
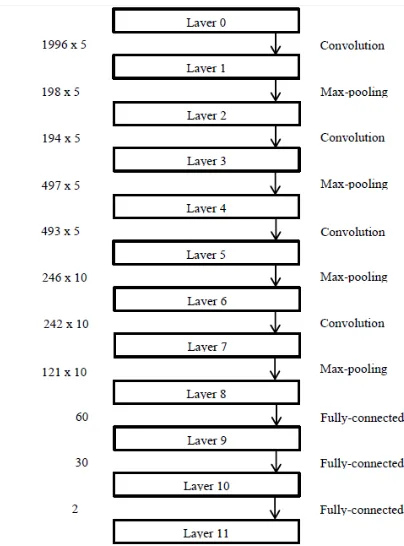
Fig. 4 depicts the CNN model used in this study. It is an 11-layer network structure. It has 4 convolution layers, 4 max-pooling layers and 3 fully-connected layers. Convolution layer uses stride of value 1 and max-pooling layer uses stride value 2.
B. Training
[image:4.595.321.523.48.321.2]Backpropagation algorithm [13] was used for training of this network along adaptive moment estimation (Adam) [14] which is an algorithm used for optimization purposes to update parameter values of the proposed network model. The Adam optimization algorithm works as an add-on to stochastic gradient descent method and is now frequently used in deep learning studies. In case of stochastic gradient descent method, a constant learning rate (α) is maintained throughout the model for updating weights; it never varies. In the case of Adam, every network weight (parameter) will
Fig. 4. The proposed model of CNN used in this study
have a corresponding learning rate which is determined based on how the training progresses. In this study, the Adam configuration parameters are taken as given in Table 1.
The dropout [15] method is used in fully-connected layers for avoiding the problem of overfitting and improving generalization. The dropout technique randomly turns nodes off while forward-propagating and thus helps ward off weights from con-verging to identical positions. After this is done, it turns on all the nodes and back-propagates. Similarly, we can set some of the layer's values to zero at random during forward propagation in order to perform dropout on a layer. The rate is set at 0.9 in this study.
C. Testing
The network is strengthened against overfitting by performing K-fold cross-validation [16]. This method
encompasses carrying out K sequences of
training-validation-testing on, dissimilar, non-intersecting, equally-partitioned training, validation and testing sets. Using K = 10, for each value of K, the whole data is divided into training + validation = 90% and testing = 10%.
Table 1. Adam Configuration parameters during Testing
V. RESULTS
The proposed deep network model was trained and tested and high performance was
International Journal of Innovative Technology and Exploring Engineering (IJITEE) ISSN: 2278-3075, Volume-8 Issue-6S, April 2019
Table 2. Performance across 10 folds
Accuracy Specificity Sensitivity
93.33 95.0 90.0
cross validation method was utilized to compute performance. The result was calculated by making use of the suggested deep learning model and by considering the amount of correctly and incorrectly recognized normal and depression patients from their recorded EEG signals. The classification performances were found to be high (> 90%). It was achieved for all the sensitivity, specificity, and accuracy parameters.
The proposed CNN model does not necessitate the additional modules of feature extraction, reduction and selection. The prototype has the capability to self-learn and pick up characteristic features at the time of training without using a distinct feature extraction or feature selection stage. This can be considered as an added advantage of this model.
VI. CONCLUSION
Electroencephalogram (EEG) can be utilized effectively diagnose depression in patients. In this study, a deep neural network approach called Convolutional Neural Networks (CNN) was used to classify EEG of depressed patients based on severity into three classes: mild, moderate and major, which proved to be the most efficient.
The model was trained using backpropagation algorithm and Adam The accuracy, sensitivity and specificity were measured by varying various parameters of the pro-posed algorithm and were obtained to be 93.33,95 and 90 respectively; thus asserting that this computer aided model can be reliably used. This model can be applied in a clinical site provided necessary data is available for training.
REFERENCES
1.World Federation for Mental Health, “Depression: a global crisis,” Occoquan, VA, USA, (2012).
2.National Institute of Mental Health Brain basics, “https://www.nimh.nih.gov/health/index.shtml#GrowingBrain,” last accessed 2019/01/20.
3.M. Ahmadlou, H. Adeli, A. Adeli, “Fractality analysis of frontal brain in major depressive disorder,” International Journal of Psychophysiology 85 (2012) 206-211.
4.V. K. Sudarshan, U. R. Acharya, H. Adeli, J. Santhosh, J. E. W. Koh, S. D. Puthankattil, and A. Adeli, “A novel depression diagnosis index using nonlinear features in EEG signals,” European Neurology 74 (2015) 79-83.
5.M. Hussain, W. Mumtaz, L. Xia, S. S. A. Ali, M. A. M. Yasin, A. S. Malik, “Electroencephalogram (EEG)-based computer-aided technique to diagnose major depressive disorder (MDD),” Biomedical Signal Processing and Control 31 (2017) 108-115. 6.S. C. Liao, C. T. Wu, H. C. Huang, W. T. Cheng, “Major
depression detection from EEG signals using kernel eigen-filter-bank common spatial patterns,” Sensors 17 (6) (2017) 1385.
7.S. Ghosh-Dastidar, H. Adeli, N. Dadmehr, “Principal component analysis – enhanced cosine radial basis function neural network for robust epilepsy and seizure detection,” IEEE Transactions on Biomedical Engineering 55 (2) (2008) 512-518.
8.L. Khedher, L. A. Illan, J. M. Gorriz, J. Ramirez, A. Brahim, A. Meyer-Baese, “Independent component analysis – support
vector machine-based computer aided diagnosis system for Alzheimer’s with visual support,” International Journal of Neural Systems 27 (3) (2017) 1650050 (8 pages).
9. S. L. Oh, Y. Hagiwara, G. M. Bairy, S. D. Puthankattil, O. Faust, U. C.
Niranjan, U. R. Acharya, “Automated diagnosis of depression electroencephalograph signals using linear prediction coding and higher order spectra features,” Journal of Medical Imaging and Health Informatics 7 (8) (2017) 1857-1862.
10.Patient Repository for EEG data,
“http://predict.cs.unm.edu/downloads.php,” last accessed on
2019/01/20.
11.Siddique, N., Adeli, H., “Computational intelligence - synergies of fuzzy logic, neural networks and evolutionary computing,” Wiley, West Sussex, United Kingdom, (512 pages).
12.J. G. Lee, S. Jun, Y. W. Cho, H. Lee, G. B. Kim, J. B. Seo, N. Kim, “Deep learning in medical imaging: general overview,” Korean Journal of Radiology 18 (4) (2017) 570-584.
13.S. L. Hung, H. Adeli, “Parallel backpropagation learning algorithms on
cray,” Y-MP8/864 supercomputer. In: Neurocomputing 5 (6) (1993) 287-302.
14.D. P. Kingma, J. L. Ba, “ADAM: A method for stochastic
optimization,” 3rd International Conference on Learning
Representations, San Diego, (2015).
15.N. Srivastava, G. Hinton, A. Krizhevsky, I. Sutskever, R.
Salakhutdinov, “Dropout: A simple way to prevent neural networks from overfitting,” Journal of Machine Learning Research 15 (2014) 1929-1958.
16.R. O. Duda, P. E. Hart, D. G. Stork, “Pattern classification,” 2nd edition, New York, John Wiley and Sons, (2001).
AUTHORSPROFILE
Anna Dominic completed Bachelor of Technology in Computer Science and Engineering from Mahatma Gandhi University and currently pursuing Master of Technology in Computer Science and Engineering from Mar Athanasius College of Engineering Kothamangalam affiliated to APJ Abdul Kalam Technological University. Her research interest is in Machine Learning and Artificial Intelligence.
Surekha Mariam Varghese is currently heading the Department of Computer Science and Engineering, M.ar Athanasius College of Engineering, Kothamangalam, Kerala, India. She received her B-Tech Degree in Computer Science and Engineering in 1990 from College of Engineering, Trivandrum affiliated to Kerala University and M-Tech in Computer and Information Sciences from Cochin University of Science and Technology, Kochi in 1996. She obtained Ph.D in Computer Security from Cochin University of Science and Technology.Kochi in 2009. She has around 27 years of teaching and research experience in various institutions in India. Her research interests include Machine learning, Network Security, Database Management, Data Structures and Algorithms, Operating Systems and Distributed Computing.