Supporting Information for:
A Designer Peptide as a Template for Growing Au Nanoclusters
Roberto de la Rica*, Lesley W. Chow, Christine-Maria Horejs, Manuel Mazo, Ciro Chiappini, E.
Thomas Pashuck, Ronit Bitton, Molly M. Stevens*
Contents:
- Figure S1: High-resolution TEM images of Au nanoclusters
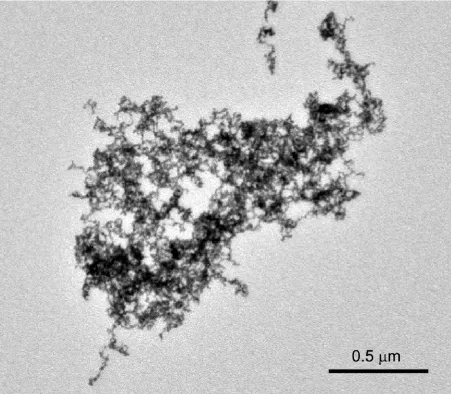
- Figure S2: TEM images of Au nanoparticles grown without peptide
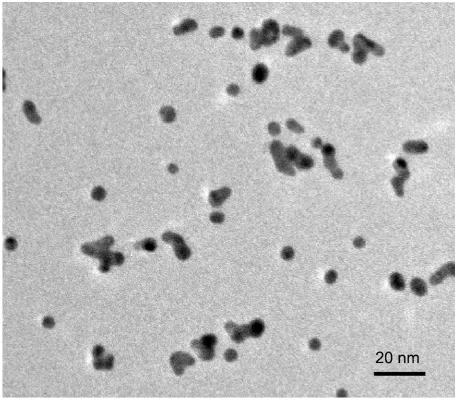
- Figure S3: TEM images of Au nanoparticles grown with (GRP)3
- Figure S4: Internalization of Au nanoclusters by cells
- Materials and methods
Figure S1. HRTEM image of Au nanoclusters grown with C(GRP)3.
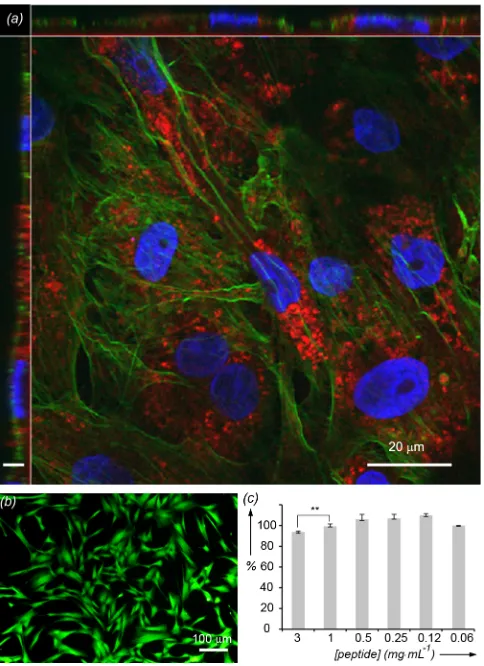
[image:2.595.183.411.410.610.2]Figure S4. Internalization of Au nanoclusters by human fibroblasts; (a) confocal microscopy images showing cell membrane (green), nucleus (blue) and Au nanoclusters (red); nanoclusters are located both in vesicles and free in the cytosol; Z axis scale bar: 2 mm; (b) cytotoxicity assay after 24 h in the presence of nanoclusters (green color shows live cells and red color shows dead cells); (c) Metabolic activity (Alamar blue assay) of human fibroblasts after incubation with peptide-templated nanoclusters at different concentrations calculated with respect to a sample with no nanoclusters added. Analysis with a Mann-Whitney U test reveals statistical differences in metabolic activity only when the peptide concentration is higher than 1 mg·mL-1. Error bars are the standard deviation (n=3).
Materials and methods
[image:4.595.177.419.58.391.2]equivalents of the Fmoc protected amino acids to 3.95 molar equivalents of HBTU and dissolved in DMF. Six molar equivalents of DIEA were added to the amino acid solution, and the coupling solution was added to the resin. The coupling reaction was allowed to proceed for two to three hours then the resin was washed in DCM and DMF. Ninhydrin tests were performed after each Fmoc deprotection and coupling step to monitor the presence of free amines. Peptides were cleaved in 95% trifluoroacetic acid (TFA), 2.5% triisopropyl silane (TIS) and 2.5% H2O for four hours. TFA was removed using rotary evaporation, and the peptide residue was precipitated and washed with cold diethyl ether by centrifugation. The peptide precipitate was allowed to dry under vacuum to remove residual ether. The peptide was purified using reversed phase preparative high performance liquid chromatography (HPLC; Shimadzu) in an acetonitrile/water gradient under acidic conditions on a Phenomenex C18 Gemini NX column (5 micron pore size, a 110Å particle size,150 x 21.2 mm). Following purification, the peptide was lyophilized on a freeze dryer (Labconco) for storage prior to use. The purified peptide mass was verified by matrix assisted laser desorption spectroscopy (MALDI; Waters).
To grow Au nanoparticles and Au nanoclusters, 5 mL of gold (III) chloride trihydrate (100 mM, Sigma) and 1.5 mL of the peptide (1 mg·mL-1 in water) were added to 3 mL of deionized water under agitation (900 rpm). Subsequently, 500 mL of freshly prepared NaBH4 (10 mM) was added to the stirred solution. The color of the solution changed instantaneously. Au nanocluster solutions were lyophilized and stored at room temperature until used.
Molecular dynamic simulations were performed using the software NAMD. NAMD was developed by the Theoretical and Computational Biophysics Group in the Beckman Institute for Advanced Science and Technology at the University of Illinois at Urbana-Champaign [1] and is free to download and use at www.ks.uiuc.edu/Research/namd/. All visualizations of the simulation results were made with the molecular graphics program VMD [2] which can be downloaded at www.ks.uiuc.edu/Research/vmd/ and PyMOL Molecular Graphics System, Schrödinger, LLC. NAMD simulation software generates structure files from the CHARMM force field, uses periodic boundary conditions, and the particle-mesh Ewald method [3] PME for long-range interactions. The equations of motion, that is, the time evolution of the Hamiltonian system, are integrated by the Verlet method.[4] All simulations were computed at the SUN cluster Phoenix at phoenix.zserv.tuwien.ac.at. Simulations were done in water using the TIP3P water model at ambient conditions.
in acidic native conditions. Bands were visualized by detecting the intrinsic NIR fluorescence of the nanoclusters with a LI-COR infrared imaging system (Odyssey).
Small angle scattering measurements were performed using the SAXSLAB GANESHA 300-XL system with Cu Κα radiation generated by a sealed microfocused tube (Genix 3D Cu-source with integrated Monochromator) powered at 50kV and 0.6mA, and three pinholes collimation. The scattering patterns were recorded by a Pilatus 300K detector. The scattering
intensity I(q) was recorded in the interval 0.012 < q < 0.7 A-1 , where q is defined as q 4π sin θ λ =
where 2θ is the scattering angle, and λ is the radiation wavelength (1.542A). The solution under study was sealed in a thin-walled capillary (glass) of about 1.5 mm diameter and 0.01 mm wall thickness; measurements were performed at ambient conditions. The 2D SAXS images were azimuthally averaged to produce one-dimensional profiles of intensity, I vs. q, using the two-dimensional data reduction program SAXSGUI. The scattering spectra of the capillary and solvent were also collected and subtracted from the corresponding solution data. No attempt was made to convert the data to an absolute scale. Data analysis was based on fitting the scattering curve to an appropriate model using a least-squares method using software provided by NIST (NIST SANS analysis version 7.0 on IGOR).
SAXS analysis proceeded as follows. The scattering intensity of a monodisperse system of particles of identical shape can be described as [5]:
I(q) NP(q)S(q)=
where N is the number of particles per unit volume, S(q) is the structure factor that accounts for the interparticle interactions and P(q) is the form factor characteristic of the specific size and shape of the scatterers. In dilute solutions, where the interactions between the objects can be neglected, S(q) equals one.
The total intensity scattered from a polydisperse system with particles having an identical shape can be described by:
0
( ) n( ) ( , ) I q N D r P q r dr
∞
=
∫
2 3
3
4 3(sin( ) cos( )
3 ( )
r qr qr qr
qr
π ρ
⎡ Δ − ⎤
⋅
⎢ ⎥
⎣ ⎦
Where Δρ is the difference between the electron densities of the spheres and the solution.
A lognormal distribution is given by:
0 2
1
( ) exp (ln( ) ln( )) 2
2 dr
N r r r
r σ
σ π
⎡ ⎤
= ⎢− − ⎥
⎣ ⎦
Where r0 is the median radius and the polydispersity is given by σ. The mean radius is given by:
2 0
exp(ln( ) 2)
avg
r = r +σ
Human primary fibroblasts were kindly provided by Dr Felipe Prosper (Clinica Universidad de Navarra, Pamplona, Spain). Briefly, cells were cultured in DMEM 4500 mg·L-1 glucose supplemented with 10% fetal bovine serum, 1% (v/v) L-glutamine and 1% (v/v) antibiotics (all from Invitrogen). Upon confluence, cells were detached with Trypsin/EDTA (Gibco) and plated at 10000 cells per well in 96 well plates. 24 hours later, growth medium was changed for nanoclusters in serum-supplemented phenol-free DMEM (Invitrogen). After 24 hours, viable cells were determined with a LIVE/DEAD assay (Invitrogen). Metabolic activity was determined with the Alamar Blue assay (Invitrogen, see Supporting Information online). For confocal imaging, cells were fixed in 4% (w/v) paraformaldehyde (Sigma-Aldrich), stained with Phalloidin-Alexafluor 488 (Invitrogen) and DAPI (Sigma-Aldrich) and mounted on a coverslip with prolong gold antifade agent (Invitrogen). Micrographs were generated using an inverted confocal microscope (Leica SP5) equipped with a 63x oil immersion objective with 1.4 NA. Images were processed using the Volocity imaging software (Perkin Elmer).
References:
[1] J. C. Phillips, R. Braun, W. Wang, J. Gumbart, E. Tajkhorshid, E. Villa, C. Chipot, R. D. Skeel, L. Kalé, and K. Schulten, J. Comput.Chem. 2005, 26, 1782.
[2] W. Humphrey, A. Dalke, and K. Schulten, J. Mol. Graphics 1996, 14, 33.
[3] U. Essmann, L. Perera, M. L. Berkowitz, T. Darden, H. Lee, and L. G. Pedersen, J. Chem. Phys. 1995, 103, 8577.
[4] J. Verlet, Phys. Rev. 1967, 159, 98.