Design of experiments for non-manufacturing
processes: benefits, challenges and some examples
J Antony1*, S Coleman2, D C Montgomery3, M J Anderson4,andR T Silvestrini5
1Centre for Research in Six Sigma and Process Excellence (CRISSPE), Strathclyde Institute for Operations Management, Department of DMEM, University of Strathclyde, Glasgow, UK
2
Industrial Statistics Research Unit, Newcastle University, UK
3School of Computing, Informatics and Decision Systems Engineering, Ira A. Fulton School of Engineering, Arizona State University, Tempe, Arizona, USA
4
Stat-Ease, Inc., Minneapolis, Minnesota, USA
5Department of Operations Research, Naval Postgraduate School, Monterey, California, USA
The manuscript was received on 16 July 2010 and was accepted after revision for publication on 7 December 2010.
DOI: 10.1177/0954405411395857
Abstract: Design of Experiments (DoE) is a powerful technique for process optimization that has been widely deployed in almost all types of manufacturing processes and is used extensively in product and process design and development. There have not been as many efforts to apply powerful quality improvement techniques such as DoE to improve non-manufacturing pro-cesses. Factor levels often involve changing the way people work and so have to be handled carefully. It is even more important to get everyone working as a team. This paper explores the benefits and challenges in the application of DoE in non-manufacturing contexts. The viewpoints regarding the benefits and challenges of DoE in the non-manufacturing arena are gathered from a number of leading academics and practitioners in the field. The paper also makes an attempt to demystify the fact that DoE is not just applicable to manufacturing industries; rather it is equally applicable to non-manufacturing processes within manufacturing companies. The last part of the paper illustrates some case examples showing the power of the technique in non-manufac-turing environments.
Keywords: Design of Experiments (DoE), process optimization, non-manufacturing processes, product and process design and development
1 INTRODUCTION
Design of Experiments (DoE), sometimes called mul-tifactor testing (MFT), is fundamental and crucial to increase the understanding of a product or process.
It provides a powerful means to achieve breakthrough improvements in product quality and process effi-ciency. According to Montgomery [1], DoE is a pow-erful tool that enables the effects of several system or process variables to be investigated simultaneously and efficiently, leading to an increased understanding of the system. DoE is a direct replacement of the tra-ditional one-factor-at-a-time (OFAT) or ‘hit or miss’ approach to experimentation and the sequential test-ing approach of Shainin (see Antony [2] and Shainin and Shainin [3]).
*Corresponding author: Centre for Research in Six Sigma and Process Excellence (CRISSPE), Strathclyde Institute for Operations Management, Department of DMEM, University of Strathclyde, Glasgow G1 1XJ, Scotland, UK.
DoE has been widely applied to various problems in the manufacturing arena, but little attention has been paid to its applications in the context of non-manufacturing. Although it has been around for decades, few business leaders in service organiza-tions have a good grasp of its power in tackling prob-lems associated with service process efficiency and effectiveness (see Johnson and Bell [4]). This field remains fertile ground for greater education, experience, and application. Service-oriented indus-tries such as financial services, transportation ser-vices, hotel and restaurant serser-vices, healthcare industry, utility services, IT services, etc., are the fast-est growing sectors around the world (see Kapadia and Krishnamoorthy [5]). Customers are becoming more critical of the service they receive today and therefore most modern organizations are paying more attention to their transactional service processes.
The present research has clearly indicated that rel-atively few applications of DoE in a non-manufactur-ing environment have appeared in the academic literature (see Ledolter and Swersey [6], Blosch and Antony [7], and Kumaret al.[8]). This paper presents the benefits of DoE in non-manufacturing settings, the fundamental challenges encountered by practi-tioners in the application of DoE in non-manufactur-ing processes, and provides examples that demonstrate the power of DoE in non-manufacturing settings.
2 DESIGN OF EXPERIMENTS IN
NON-MANUFACTURING INDUSTRY: FUNDAMENTAL CHALLENGES
A product realization process initiated by the manu-facturer usually begins with product design and development, a set of product specifications, process development, then production and testing, and con-cludes with delivery to the customer. If at any point in the process products do not meet specifications, they can either be scrapped or reworked. Non-manufac-turing or service processes, on the other hand, gener-ate value as the customer interacts with the process and, ultimately, it is the customers’ experience with the process that is most important. The distinction between the process, the delivery of the process, and the customers’ responses is often difficult to define. The exact sequence of activities in a non-man-ufacturing or service process is often difficult to pre-dict in advance.
There are a number of reasons why DoE has not been commonly employed in non-manufacturing or service settings. Some of the most fundamental bar-riers and challenges in applying DoE in a service
environment are highlighted below. For more discus-sion, see Roes and Dorr [9], Raajpoot et al. [10], Holcomb [11], Kumar et al. [8], Johnson and Bell [4], and Blosch and Antony [7].
. Lack of awareness, knowledge and misconceptions discourage experimentation in many service organizations.
. The performance of a service process is very diffi-cult to measure accurately.
. Service process performance depends a great deal on the behaviour of the human beings involved in delivering it.
. Service processes have more ‘noise’ factors associ-ated with them (queuing, friendliness, location, politeness, etc.).
. As service is often simultaneously created and con-sumed and intangible dimensions are important indicators of quality on service context, experi-mental control of inputs and measurement of output requires careful consideration.
. In any service process, a clear description and dis-tinction of service processes is needed for quality control and improvement. A good understanding of front office, back office, and customer processes is required for quality and process improvements.
Table 1 was generated from a recent study carried out by the first author. A number of experts in the field of DoE (both academics and practitioners) were approached by the first author and the res-ponses were collected over a period of two weeks. Each respondent was approached with a question: ‘What are the fundamental challenges in the applica-tion of DoE in the non-manufacturing or service sector?’
3 BENEFITS OF DoE IN
NON-MANUFACTURING/SERVICE
INDUSTRY: A REVIEW OF THE LITERATURE AND SOME KEY FINDINGS
The purpose of this section is to illustrate the benefits of DoE in various non-manufacturing/service
[image:3.595.39.540.102.430.2]settings. Our search for service applications of DoE has found a few papers in the marketing and service/ retail industry literature. Holland and Cravens [13] presented the essential features of fractional factorial design and illustrated a very interesting example looking into the effect of advertising and other critical factors on the sales of candy bars. Ledolter and Swersey [6] described the power of a fractional Table 1 Challenges in the application of DoE in non-manufacturing or service settings
Respondents and their affiliations Challenges
Kai Yang, Wayne State University, USA Cannot do too many trials of controlled tests in a service environment Phil Rowe, Consultant and Six Sigma Master Black
Belt, Bourton Group, UK
People in the service sector are by and large not used to using/dealing with data-based decision-making
DoE is a ‘techy’ tool; managers in the service sector may be less likely to have a mathematical background and be perhaps more likely (than in engineering, say) to be driven by ‘experience’ and ‘gut feeling’ – wanting to be seen to be incisive and intuitive
Choosing the right response variables and dealing with subjectivity within the experimental regime
Mark Anderson, Principal and General Manager, Stat-Ease, USA
The involvement of people. Whereas a machine can be subjected to change with no trouble (provided its operating constraints are not exceeded), humans resist new approaches to doing things
Larry Smith, Independent consultant, USA The biggest challenge is in determining what to measure and in finding opera-tional control factors to conduct the DoE. It is also effective if a service process can be computer simulated so that the DoE may be done as a simulation Sung Park, Seoul University, South Korea The fundamental challenges are that it is not easy to obtain the necessary
observed data in the service sector, and also it is not easy to provide the same experimental condition for repeated measurement in the service sector Ronald Snee, Consultant, Tunnell Consulting,
USA
Lack of standardized work processes
Lack of improvement mindset
Greater amount of human intervention
Can be more difficult to administer the design properly and get quality data Alessandro Laureani, Master Black Belt, Hertz
Services, Ireland
As human factors are an important factor, randomization is necessary in the context of service
As there is an intangible component with the delivery of service, results may not be as reliable as manufacturing
Careful selection of factor levels is required due to involvement of people and the interaction between the customer and service provider
Roger Hoerl, General Electric, USA Personally, I think the cultural issues are greater. For one, there is rarely a culture of using the scientific method or applying continuous improvement in most service organizations
Persuade people to follow a systematic methodology for process improvement and to convince them to rely on the power of data to drive the decision-making process
Table 2 The influence of Six Sigma initiatives in the non-manufacturing or service sector on deployment of DoE (adapted from Goh [12])
Aspect Past Future
Impetus Operational level Top management
Training provision Stand-alone courses Structured company-wide programmes such
as Six Sigma
Motivation of experimentation Technical performance Improved sales and enhanced customer satisfaction
Success criterion Engineering objectives Impact on the bottom-line in hard cash savings Project ownership Isolated individuals (industry statisticians,
external consultants)
Multidisciplinary teams across the business
Focus of application Primarily manufacturing processes Service, transactional and now governance processes
Project selection Primarily projects are related to single functional problems
[image:3.595.37.540.515.648.2]factorial experiment to increase the subscriptions response rate of Mother Jones magazine. Kumar
et al. [8] used a Taguchi robust parameter design methodology in order to improve the response-time performance of an information group operation that was responsible for addressing customer complaints concerning a small software export company. Holcomb [11] illustrated the use of Taguchi parame-ter design methodology to deparame-termine the optimal set-tings of customer service delivery attributes that reduce cost without affecting quality. Blosch and Antony [7] demonstrated the use of computer simu-lation and DoE to identify the key risk variables within the manpower planning system at the UK’s Royal Navy. This combined approach has provided a greater understanding of the manpower planning system, especially in terms of reducing gapping (a gap occurs when a particular job or task is not being filled by a competent and qualified person) at sea. Starkey [14] used a Plackett–Burman design in designing an effective direct response TV advertise-ment. Raajpootet al.[10] presented the application of Taguchi approach of DoE to retail service. The study was performed by undergraduate students at a mid-size university in the USA to determine the key attrib-utes of shopping experience in a superstore setting such as Wal-Mart or Target. Anderson [15] has
compiled a number of excellent examples. The poten-tial applications of DoE in the non-manufacturing/ service environment include:
. identifying the key service process or system vari-ables that influence the process or system performance;
. identifying the service design parameters that influence the service quality characteristics or CTQs in the eyes of customers;
. minimizing the time to respond to customer complaints;
. minimizing errors on service orders;
. reducing the service delivery time to customers (e.g. banks, restaurants, etc.);
. reducing the turn-around time in producing reports to patients in a healthcare environment, and so on.
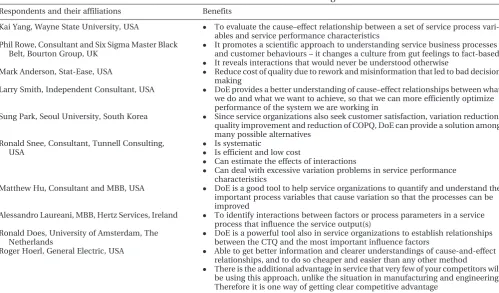
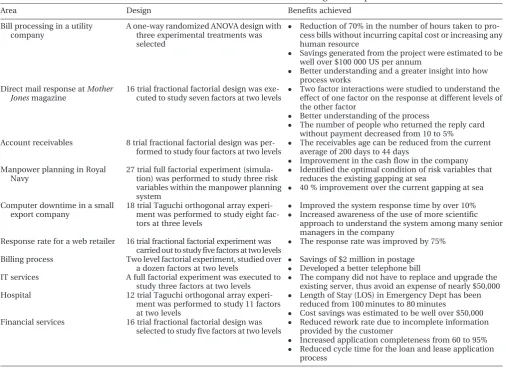
Table 3 presents the potential benefits obtained from the applications of DoE in a service setting. The table was generated from a questionnaire devel-oped by the first author and the responses from each respondent are incorporated in the table.
[image:4.595.58.558.477.770.2]Table 4 shows the real benefits of DoE in the con-text of non-manufacturing/service. The table is gen-erated from a review of various case studies and examples from periodicals, textbooks, websites,
Table 3 Potential benefits of DoE in non-manufacturing/service industries Respondents and their affiliations Benefits
Kai Yang, Wayne State University, USA To evaluate the cause–effect relationship between a set of service process vari-ables and service performance characteristics
Phil Rowe, Consultant and Six Sigma Master Black Belt, Bourton Group, UK
It promotes a scientific approach to understanding service business processes and customer behaviours – it changes a culture from gut feelings to fact-based
It reveals interactions that would never be understood otherwise
Mark Anderson, Stat-Ease, USA Reduce cost of quality due to rework and misinformation that led to bad decision making
Larry Smith, Independent Consultant, USA DoE provides a better understanding of cause–effect relationships between what we do and what we want to achieve, so that we can more efficiently optimize performance of the system we are working in
Sung Park, Seoul University, South Korea Since service organizations also seek customer satisfaction, variation reduction, quality improvement and reduction of COPQ, DoE can provide a solution among many possible alternatives
Ronald Snee, Consultant, Tunnell Consulting, USA
Is systematic
Is efficient and low cost
Can estimate the effects of interactions
Can deal with excessive variation problems in service performance characteristics
Matthew Hu, Consultant and MBB, USA DoE is a good tool to help service organizations to quantify and understand the important process variables that cause variation so that the processes can be improved
Alessandro Laureani, MBB, Hertz Services, Ireland To identify interactions between factors or process parameters in a service process that influence the service output(s)
Ronald Does, University of Amsterdam, The Netherlands
DoE is a powerful tool also in service organizations to establish relationships between the CTQ and the most important influence factors
Roger Hoerl, General Electric, USA Able to get better information and clearer understandings of cause-and-effect relationships, and to do so cheaper and easier than any other method
and white papers. The case studies represent a broader range of services from administration, cus-tomer service, financial services, and healthcare settings.
4 USE OF COMPUTER MODELS
One of the difficulties in applying designed experi-ments in service and transactional businesses is that it is often difficult or impossible to experiment phys-ically with the system under study. For example, sup-pose that there is a need to improve service operations in a hospital emergency department (ED). The response variable may be the patient wait-ing time and there may be several factors that could be considered as factors in a designed experiment, including varying the number of personnel on duty, the mix of skills in the on-duty personnel, the number of treatment rooms, the types of treatment and diag-nostic equipment available, the physical layout of the ED, and the sequencing procedure that determines the order in which arriving patients are processed.
Clearly some of these factors should have an effect on patient throughput and hence waiting times. However, varying these factors in a designed experi-ment would be impractical, and in most instances impossible. This situation is encountered in many improvement projects involving service and transac-tional operations. The Winter Simulation Conference held in December each year has a health care track that includes many instances of simulation models of hospitals and health care systems. For examples of ED simulations that involve experimental design see Garcia et al.[16], Miller et al. [17], and Simon and Armel [18]. Later in the paper, a case study is pre-sented. The remainder of this section details the approach of experiments on computer simulation and some unique experimental design challenges.
[image:5.595.35.542.409.778.2]The usual approach in these situations is to build a computer model of the process and then apply designed experiments to the model. If the model is built properly and validated, then results from the experiment conducted on the model can be trans-ferred to the actual process.
Table 4 Real benefits of DoE in non-manufacturing/service processes
Area Design Benefits achieved
Bill processing in a utility company
A one-way randomized ANOVA design with three experimental treatments was selected
Reduction of 70% in the number of hours taken to pro-cess bills without incurring capital cost or increasing any human resource
Savings generated from the project were estimated to be well over $100 000 US per annum
Better understanding and a greater insight into how process works
Direct mail response atMother Jonesmagazine
16 trial fractional factorial design was exe-cuted to study seven factors at two levels
Two factor interactions were studied to understand the effect of one factor on the response at different levels of the other factor
Better understanding of the process
The number of people who returned the reply card without payment decreased from 10 to 5% Account receivables 8 trial fractional factorial design was
per-formed to study four factors at two levels
The receivables age can be reduced from the current average of 200 days to 44 days
Improvement in the cash flow in the company Manpower planning in Royal
Navy
27 trial full factorial experiment (simula-tion) was performed to study three risk variables within the manpower planning system
Identified the optimal condition of risk variables that reduces the existing gapping at sea
40 % improvement over the current gapping at sea
Computer downtime in a small export company
18 trial Taguchi orthogonal array experi-ment was performed to study eight fac-tors at three levels
Improved the system response time by over 10%
Increased awareness of the use of more scientific approach to understand the system among many senior managers in the company
Response rate for a web retailer 16 trial fractional factorial experiment was carried out to study five factors at two levels
The response rate was improved by 75%
Billing process Two level factorial experiment, studied over a dozen factors at two levels
Savings of $2 million in postage
Developed a better telephone bill IT services A full factorial experiment was executed to
study three factors at two levels
The company did not have to replace and upgrade the existing server, thus avoid an expense of nearly $50,000 Hospital 12 trial Taguchi orthogonal array
experi-ment was performed to study 11 factors at two levels
Length of Stay (LOS) in Emergency Dept has been reduced from 100 minutes to 80 minutes
Cost savings was estimated to be well over $50,000 Financial services 16 trial fractional factorial design was
selected to study five factors at two levels
Reduced rework rate due to incomplete information provided by the customer
Increased application completeness from 60 to 95%
Broadly speaking, there are two types of computer models used in improvement activities, discrete-event simulation models and deterministic models. Discrete-event simulation models are usually trans-action-based and driven by random components that are modelled by probability distributions. For exam-ple, in the hospital emergency department applica-tion, the number of patients (or transactions) that arrive per hour may be modelled by a Poisson distri-bution whose mean is time-dependent, the type of complaint that the patient presents may be selected at random from a distribution that reflects the actual historical experience with patients, and the service time for each procedure that the patient undergoes could be modelled by an exponential or a gamma distribution (for example). Random numbers gener-ated from these distributions move transactions through the system until either they are discharged or admitted to the hospital’s general population. For an introduction to discrete-event simulation meth-ods see Bankset al.[19].
Because discrete event simulations are driven internally by random forces, they produce an output response that is a random variable. Consequently, the full range of standard experimental design methods, including factorial and fractional factorial designs and response surface designs, can be applied to these models. Hunter and Naylor [20] illustrate the uses of factorial, fractional factorial, and response surface designs in the context of two computer sim-ulation models and provide a brief discussion about the pitfalls associate with computer simulation experiments.
Some practical problems that arise when experi-menting on computer simulations include sample size determination, the issue of multiple responses, and the problem of non-linearity. Additional issues that are unique to computer simulation models include how to choose the simulation run length and the duration of the warm-up period (if any is required). See Law [21] for a discussion of these and other related issues. Also, if replication is used, it is usually standard practice to use a different stream of random numbers (or a different random number gen-erator seed) for each replicate, so that replicates can be taken as blocks to reduce some of the variability in the model output.
Many discrete-event simulations have a large number of input variables. Depending on the simu-lation run length in real time there can be situations where the number of factors renders the use of con-ventional fractional factorial designs problematic. Supersaturated designs, which have fewer runs than the number of factors, can prove useful in these situ-ations. Lin [22] is a useful reference on construction
of supersaturated designs. Forward stepwise regres-sion can be used to analyse the data from a supersat-urated design. See Holcombet al.[23] for a discussion of other design construction and analysis methods. In some simulations there can be input variables that can be treated as noise variables. For example, in the hospital emergency department, the analyst may want to treat the patient arrival rate as a noise factor because it cannot be controlled in practice by the management of the emergency department, and it may be desirable to try to find settings of the factors that can be controlled that work well across a wide range of arrival patterns. Designs that incorporate noise factors and methods for analysing these designs to minimize the variability transmitted from the noise factors are discussed in Myerset al.[24].
Simulation models can present other challenges for the experimental designer. Often the output response cannot be summarized by a single summary statistic or group of summary statistics. Common situations are time series output or functional output, in which one response is related to one or more other responses through a functional relationship. In many case the output response may be poorly mod-elled by a normal distribution. For example, in the hospital emergency room simulation the patient waiting times may follow a gamma distribution. Since the gamma distribution is a member of the exponential family, generalized linear models may be useful in the analysis of these types of response. For examples of using generalized linear models to analyse data from designed experiments see Lewis
et al.[25] and Myerset al.[26]. If the experimenter knows or suspects in advance that the response is an exponential family member, it is possible to design an experiment based on the D-optimality criterion, which is more appropriate than classical designs. This is discussed in Johnson and Montgomery [27] and Myerset al.[26].
5 DESIGN OF EXPERIMENTS: CASE EXAMPLES
FROM THE NON-MANUFACTURING SERVICE INDUSTRY
5.1 Data entry errors
thought that asking staff to work as quickly as possi-ble compromises accuracy levels; as input speeds become more rapid less care would be taken or fewer self-checks would be performed.
It was decided to run an experiment with two three-level factors:
. Staff factor: experienced, semi-experienced, and novice.
. Instructions factor: ‘go as fast as you can’, ‘be as accurate as possible’, and ‘go as fast as you canand
be as accurate as possible’.
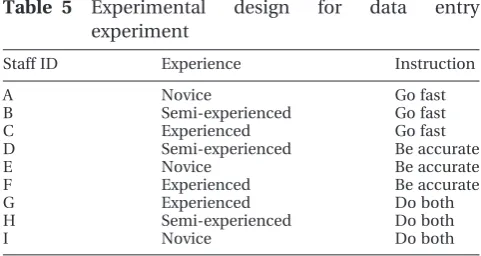
Thus, it would be discovered if particular instructions produced different effects in relation to different experience levels (Stewardsonet al.[28]). The exper-imental design is shown in Table 5.
Three staff were chosen in each of the categories, Experienced, Semi-experienced, and Novice. One person from each experience level was instructed to ‘go as fast as you can’, another was told to ‘be as accurate as possible’ and the third was told to do both. The trial lasted for five days, during which time staff input basic prescription details over a number of batches of prescriptions. There were two measurable outputs, speed (the number of inputs per hour averaged over a day) and accuracy (proportion of inputs with an error). Input speeds increased over the five days and the response variables were consid-ered as they changed over time, as well as just as an average. Accuracy rates tended to remain fairly con-stant over this short period of time. It was also clear that there is no obvious connection between speed and accuracy. Differences in the outcomes were attributed to the specific instructions and experience levels.
The trials proved a resounding success, with good cooperation being obtained from all staff. The exper-iment established that the speed of input was the crit-ical item that needed to be included in working instructions. Accuracy is affected by the experience level. If a person is asked to ‘go fast’, it will not tend to affect their accuracy level, but if they are asked to be
accurate, speed will reduce, without any noticeable effect on accuracy. It is thus favourable to insist on faster speeds and accuracy levels will, apparently, hold their ‘natural’ level. This is just one example of the use of a designed experiment involving human performance.
The key benefits of this designed experiment were that it showed the effect of issuing different types of commands on the speed and accuracy of data entry as well as evaluating the differences in performance between different types of staff. It also led to the establishment of a minimum expected performance standard for novices, which helped determine recruitment and training needs. The experiment also allowed an assessment of the level of variation in data entry speed and accuracy between people.
Managerial implications were that a scientific approach could be applied to the assessment of per-formance. Statistical process control using cusum charts was also implemented for the data entry pro-cess and proved to be a workable methodology for deciding when bonuses should be given and when re-training was needed.
Lessons learnt included that a range of statistical techniques could be used in the context of the PPA, which is effectively an enormous data processing plant. Many quality improvement initiatives were also carried out and random sampling and statistical modelling were widely employed in a cross-depart-mental acceptance of the importance of the quanti-tative approach. More recently extensive data mining has been undertaken to examine changes in the pat-tern of prescriptions over time as regards their value, content, source, and mix, with the aim of providing a foundation for process improvement.
5.2 Debt collection
Slow payment of invoices is a big problem and is par-ticularly difficult for smaller companies. A continu-ous improvement project at a local SME (small- or medium-sized enterprise) looked at the performance of the whole flow of the company from receipt of orders to receipt of payment (Colemanet al.[29]).
In common with many companies, the manu-facturing plant had been intensely modernized and was working very efficiently. Payment of invoices, however, was very slow and variable between cus-tomers. To help improve this situation, data were col-lected and analysed. It was found that the Pareto principle applied, with most customers paying within a reasonable time and some delaying unacceptably.
[image:7.595.34.275.92.220.2]The ideas of experimental design were discussed at a problem-solving team meeting. It was decided to Table 5 Experimental design for data entry
experiment
Staff ID Experience Instruction
A Novice Go fast
B Semi-experienced Go fast
C Experienced Go fast
D Semi-experienced Be accurate
E Novice Be accurate
F Experienced Be accurate
G Experienced Do both
H Semi-experienced Do both
see which factors would help speed up the payment of bills. It was noted from experience that it was better to phone after 2 pm and to avoid phoning on Fridays. The aim was to try to find the optimum strategy and improve the time to payment of bills.
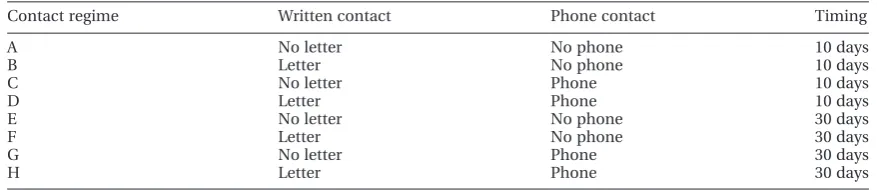
Three two-level factors were chosen for the designed experiment:
. Written contact: send or do not send a letter. . Phone contact: phone or do not phone.
. Timing of contact: 10 days after sending invoice or 30 days.
Eight trials were planned with different contact regimes. The experimental design is shown in Table 6. The debtor companies were randomly assigned to one of the eight trials. They were dealt with according to the experimental design and the time before pay-ment was recorded. The outcome variable was the time to payment. It was found that sending a letter and telephoning 10 days after sending the invoice was by far the best strategy.
Applying this new strategy over the next few months, the time to wait for payment of bills was sig-nificantly reduced. Overall, the time from enquiry to payment was reduced from a mean of 110 days to a mean of 85 days. This reduction of 25 days is a signif-icant improvement and could make the difference between staying in business and going out of business.
The key benefits of this exercise were introducing staff to the concept of logical problem solving. There were also major benefits from the team activity of setting up the experiment, which involved identifying late payment as a problem, gathering information to quantify the problem, encouraging input from all the staff team, taking some action, and showing a useful result. Even if the results are not particularly surpris-ing, the designed experiment has the advantage of making it possible to quantify the effect of the new strategy so that the cost of writing and phoning can be justified. There are several shortcomings in this experimental design, such as the skewed distribution of the measurable outcome, but, nevertheless, it shows that experiments can be useful in a service
context. In this SME, designed experiments were used in the manufacturing plant and it was good for staff from all departments to share the methodology. Managerial implications are that all staff can con-tribute to process improvement through quantitative analysis. The designed experiment provided more than just the measured outcome; an added bonus was that information was obtained as a result of the intervention and managers found out that many invoices were paid late because they were incorrect or had been lost in the post or had not been received for other reasons. The early intervention identified these problems so that they could be rectified.
Lessons learned are that it is possible to improve the payment of invoices. Recent contact with the company revealed that currently less than 1 per cent of invoices are being paid late, which is a marked improvement.
5.3 Emergency department performance
Kolker [30] describes a discrete-event simulation model of the patient flow in a hospital emergency department. Three metrics, percentage of ambulance diversion, number of patients in the waiting room, and upper limit length of stay (LOS), were used to characterize the performance of the studied ED. A baseline simulation model, which represented the historical performance of the ED, was validated through the three performance metrics.
[image:8.595.89.528.102.197.2]The author identified two main phases of the ED simulation study. The goal in the first phase was to utilize simulation and experimental design to create a response model that could be used to predict the metrics, such as percentage of ambulance diversion, as a function of the LOS for patients admitted as inpa-tients and LOS for painpa-tients admitted as outpainpa-tients (home patients). The goal in the second phase of the study was to determine an optimal ED closure crite-rion. ED closure would allow the ED to temporarily divert ED ambulance drivers to other hospitals in order to reduce the size of the queue in the waiting room. A factorial design, with six levels of each factor was used to carry out the study in phase one. Table 6 Experimental design for debt collection experiment
Contact regime Written contact Phone contact Timing
A No letter No phone 10 days
B Letter No phone 10 days
C No letter Phone 10 days
D Letter Phone 10 days
E No letter No phone 30 days
F Letter No phone 30 days
G No letter Phone 30 days
Both factors, LOS for patients admitted as inpatients and those admitted as outpatients, ranged from 5 to 24 hours. The specific levels for both factors tested in the factorial were 5, 6, 8, 10, 12, and 24 hours.
Results of the experimentation performed on the simulation provided quantitative measures of the performance characteristics of the ED. Response sur-face modelling illustrated that the percentage of ambulance diversions was negligible when LOS was less than 6 and 5 hours for inpatient and home patient visits respectively. The ED closure criterion was when the number of patients in the queue was 11. Through the modelling of the ED department and use of his-torical data to drive the inputs, Kolker demonstrated how experimental design was beneficial in the con-text of analysis of the current system and the how to use findings of the study to influence management decisions.
6 CONCLUSION
Design of Experiments has been widely applied to quality- and process-related problems in manufacturing organizations. However, research has indicated that very little attention has been given to the application of DoE in the context of non-manufacturing or service processes. This paper attempts to demonstrate the power of DoE in a non-manufacturing/service environment. The benefits and challenges in the application of DoE in the context of non-manufacturing/service processes are presented and viewpoints from a number of practi-tioners and academics on the benefits and challenges are also highlighted. The paper also describes three simple case examples to illustrate the application of this powerful technique in non-manufacturing/ser-vice settings. The authors believe that DoE has tre-mendous potential but is greatly underutilized in non-manufacturing/service organizations. We also expect to see more applications of DoE in non-man-ufacturing or service industries in the next 5 to 10 years or so because of the increased use of Six Sigma methodologies in the sector.
ÓAuthors 2011
REFERENCES
1 Montgomery, D. C. Design and analysis of experi-ments, 7th edition, 2009 (John Wiley & Sons, Inc., Hoboken, New Jersey).
2 Antony, J. Some key things industrial engineers should know about experimental design. Logistics Inf. Managmt., 1998,11(6), 386–392.
3 Shainin, D. and Shainin, P. Better than Taguchi orthogonal tables. Quality and Reliability Engng Int., 1988,4(2), 143–149.
4 Johnson, L.,andBell, G.Designed experiments in service quality applications. In World Congress on
Quality and improvement, ASQ Conference, May 2009, 18–20, Minneapolis, Minnesota, USA.
5 Kapadia, M.andKrishnamoorthy, S.A methodol-ogy of enhancing profitability through the utilization of experimental design: a catering business case study. Total Quality Managmt., 1999, 10(7), 1027–1036.
6 Ledolter, J. and Swersey, A. Using a fractional factorial design to increase direct mail response at
Mother Jones magazine Quality Engineering, 2006, 18, 469–475.
7 Blosch, M.andAntony, J.Managing service quality.
Managing Service Quality, 1999,9(5), 311–319. 8 Kumar, A., Motwani, J.,andOtero, L.An application
of Taguchi’s robust experimental design technique to improve service performance.Int. J. Quality and Reliability Managmt., 1996,13(4), 85–98.
9 Roes, K. C. B.andDorr, D.Implementing statistical process control in service processes. Int. J. Quality Sci., 1997,2(3), 149–166.
10 Raajpoot, N., Javed, R.,andKoh, K.Application of Taguchi design to retail service.Int. J. Commerce and Managmt., 2008,18(2), 184–199.
11 Holcomb, M. C.Customer service measurement: a methodology for increasing customer value through utilisation of the Taguchi strategy. J. Business Logistics, 1994,15(1), 29–52.
12 Goh, T. N.The role of statistical design of experi-ments in Six Sigma: perspectives of a practitioner.
Quality Engng., 2002,14(4), 659–671.
13 Holland, C. W.,andCravens, D. W.Fractional fac-torial designs in marketing research. J. Marketing Res., 1973, 11, 286-294; http://www.cmqr.rmit. edu.au/7icit.html.
14 Starkey, M. Extending process thinking: experi-ments in sales and marketing.The TQM Mag., 1997, 9(6), 434–439.
15 Anderson, M. J. Achieving breakthroughs in non-Manufacturing processes via DoE, Stat-Ease (accessed from Stat-Ease website in July 2009; www.statease.com).
16 Garcia, M., Centeno, M., Rivera, C.,andDeCario, N. Reducing time in an emergency room via a fast-track. In Proceedings of the 1995 Winter Simulation Conference, 1995, pp. 1048–1053.
17 Miller, M., Ferrin, D.,andSzymanski, J.Simulating Six Sigma improvement ideas for a hospital emergency department. In Proceedings of the 2003 Winter Simulation Conference, 2003, pp. 1926–1929.
18 Simon, S.,andArmel, W.The use of simulation to reduce the length of stay in an emergency depart-ment. In Proceedings of the 2003 Winter Simulation Conference, 2003, pp. 1907–1911. 19 Banks, J., Carson, J. S., Nelson, B. L.,andNicol, D.
20 Hunter, J. S.andNaylor, T. H.Experimental designs for computer simulation experiments.Management Science, 1970,16(7), 422–434.
21 Law, A. M.Statistical analysis of simulation output data: the practical state of the art. In Proceedings of the 39th Winter Simulation Conference, Washington, DC, 2007, pp. 77–83.
22 Lin, D. K. J.Recent developments in supersaturated designs. In Statistical process monitoring and opti-mization, chapter 18 (Eds S. H. Park, G. G. Vining), 2000, pp. 305–319 (Marcel Dekker, New York). 23 Holcomb, D. R., Montgomery, D. C.,andCarlyle, W.
M. Analysis of supersaturated designs. J. Quality Technol., 2003,35(1), 13–27.
24 Myers, R. H., Montgomery, D. C., and Anderson-Cook, C. M.Response surface methodology: process and product optimization using designed experi-ments, 3rd edition, 2009 (John Wiley & Sons, Inc., Hoboken, New Jersey).
25 Lewis, S. L., Montgomery, D. C.,andMyers, R. H. Examples of designed experiments with nonnormal responses.J. Quality Technol., 2001,33(3), 265–278.
26 Myers, R. H., Montgomery, D. C., Vining, G. G.,and Robinson, T. J.Generalized linear models with appli-cations in engineering and the sciences, 2nd edition, 2010 (John Wiley & Sons, Inc, Hoboken, New Jersey). 27 Johnson, R. T. andMontgomery, D. C. Choice of second-order response surface designs for logistic and Poisson regression models.Int. J. Expl Des. and Process Optimization, 2009,1(1), 2–23.
28 Stewardson, D. J., Linsley, M. J., Alexander, B.,and Hebron, D. Using designed experiments in HRM: determining achievable working standards in a re-designed data-input process. In 7th International Conference on ISO 9000 & TQM (ICIT), RMIT University, Melbourne, 2–4 April 2002.
29 Coleman, S. Y., Francis, J., Hodgson, C., and Stewardson, D. J. Helping smaller manufacturers implement performance measurement. Industry and Higher Education, 2001,15(6), 409–414.
![Table 2The influence of Six Sigma initiatives in the non-manufacturing or service sector on deployment of DoE(adapted from Goh [12])](https://thumb-us.123doks.com/thumbv2/123dok_us/1681063.121497/3.595.39.540.102.430/table-influence-sigma-initiatives-manufacturing-service-deployment-adapted.webp)