The Intrinsic Structure of the Interface of
Partially Miscible Fluids: an Application to Ionic
Liquids
Gy¨
orgy Hantal,
∗,†,‡Marcello Sega,
†Sofia Kantorovich,
†Christian Schr¨
oder,
¶and Miguel Jorge
§†University of Vienna, Department of Computational Physics, Sensengasse 8/9, 1090
Vienna, Austria
‡Department of Chemistry, Eszterh´azy K´aroly College, Eger, Hungary
¶University of Vienna, Department of Computational Biological Chemistry,
W¨ahringerstrasse 17, 1090 Vienna, Austria
§Department of Chemical Engineering, University of Strathclyde, Glasgow, United Kingdom
Abstract
We investigate by means of Molecular Dynamics simulations how the intrinsic
sur-face structure of liquid/liquid intersur-faces involving ionic liquids depends on the opposite
phase of varying polarity. We study 1-n-butyl-3-methylimidazolium
hexafluorophos-phate (BMIM PF6) and 1-n-butyl-3-methylimidazolium bis(trifluoromethylsulfonyl)imid
(BMIM NTf2). The opposite phase is either cyclohexane or water, but as a reference,
IL – vacuum interfaces are also studied. We combine a distance-based cluster search
algorithm with the ITIM intrinsic analyzing method to separate liquid phases showing
non-negligible mutual miscibility and to identify atoms residing at the instantaneous
surface. In contrast to the well structured surface of IL – vacuum systems, at
liq-uid/liquid interfaces of ILs density correlations, ionic associations and orientational
preferences are all weakened, this effect being much more pronounced when the other
species is water. In such systems we observe a drastic reduction in the presence of
the cation at the surface and an increase of appearance of polar moieties (of both the
cations and anions) leading to decreased apolar character of the interface. Furthermore,
cations are mostly found to turn with their butyl chains toward the bulk while having
their methyl groups sticking towards water. Anion-cation associations are reduced and
partially replaced by water-anion and rarely also water-cation associations.
Introduction
Ionic liquids (ILs) have been the subject of vast research activity in the past two decades.
Indeed, ILs were found to outperform many traditional organic solvents in a wide variety
of industrial processes while at the same time, their application seems to constitute minor
hazard for the environment.1,2 ILs are low temperature molten salts consisting entirely of
bulky organic cations and inorganic or organic anions. Besides their inherent ionic character,
these bulky ions also have an increased non-ionic nature manifesting itself through high
of rather ionic (polar) moieties from non-ionic (apolar) ones. The greatest potential in the
application of ILs emerges from the tunability of their physico-chemical properties through
accurate chemical functionalization.
A large number of studies have been dedicated so far to assess structure and dynamics
in bulk ionic liquids.3 However, many technologically important applications rely on
prop-erties of ionic liquids at interfaces with other solvents – examples being liquid extraction,
or heterogeneous synthesis and catalysis.2 Although non-negligible effort has been dedicated
to experimentally assess the structure of ionic liquid interfaces,4 our knowledge on such
systems is still very limited due mostly to the reduced dimensionality of interfaces. As an
alternative to experimental techniques, atomistic computer simulations have proven to be
important in complementing our understanding on ionic liquid properties. In addition to the
low dimensionality of interface systems, another difficulty in studying fluid interfaces occurs
from the thermally induced capillary waves, which result from the coupled collective thermal
motion of interface molecules: Capillary waves make the shape of the interface, as well as
the identity and orientation of its constituent molecules, constantly change.5
Conventional analyzing techniques in computer simulations are based on a global view,
which simply neglects the fluctuating nature of fluid interfaces and defines spatial correlations
(e.g. density) with respect to a molecularly flat macroscopic surface (e.g. the Gibbs dividing
surface). However, missing the actual location of the interface leads to faulty estimation
of atomic distances from the interface and consequently to smeared structural information.
Properties computed for surface molecules are also impaired in the global view by the
sys-tematic misidentification of molecules residing at the surface.
A large body of computational studies have been devoted to study liquid/vapor
inter-faces of neat ionic liquids as well as their mixtures. Examples can be found e.g. in Refs.6–15
Most of the computational effort has been focused on alkylimidazolium cations in
combi-nation with halides, BF−4, PF−6, and NTf−2 anions. All these studies found considerable
as well as reorientational and translational dynamics were found significantly affected by
the interface. In contrast, liquid/liquid interfaces involving ionic liquids, to the best of our
knowledge, have been studied with molecular simulations only in a few cases: Lynden-Bell
and coworkers studied interfaces between an ionic liquid and two kinds of Lennard-Jones
fluids,16 while Chaumont et al. as well as Iwahashi et al. and later Konieczny and Szefczyk
studied IL – water interfaces.17–19Recently Iwahashi and coworkers performed simulations of
a IL – butanol liquid/liquid interface.20All liquid/liquid and almost all liquid/vapor interface
studies used the global approach, hence suffered from an inherent interpretation ambiguity
bound to the misidentification of surface molecules.
The past 15-20 years have seen the development of advanced intrinsicexperimental (e.g.
sum frequency generation spectroscopy) and numerical techniques that have the necessary
temporal and spatial resolution characteristic of interface fluctuations and are thus able to
probe locally the instantaneous interface. The first, approximate, numerical technique
devel-oped in this spirit was proposed by Linse21and Benjamin22already two decades ago. Later,
more sophisticated methods were also developed such as those by Chac´on and Tarazona,23
Chowdhary and Ladanyi,24 Jorge and Cordeiro,25and P´artay et al.26As was shown by Jorge
et al., by fine tuning an appropriately chosen control parameter all above methods can yield
a consistent set of surface atoms.27,28 Among all of them, the method by P´artay et al.
(pre-sented in detail in Section ’Materials and methods’) has proven particularly versatile, useful
and computationally efficient, as has been demonstrated by a long list of studies on a large
variety of liquid/vapor as well as liquid/liquid interfaces of single and multi-component fluid
systems.26,29–36
In two previous papers we presented the first intrinsic studies on the structure of the
liquid/vapor interface of alkylimidazolium-based ionic liquids. In particular, we investigated
how the surface structure varies by systematically changing the alkyl chain length (ethyl,
butyl, hexyl), the anion (Cl−, BF−4, PF−6), the temperature (300-360 K), and the molecular
of the most typical cation orientations change when changing the above molecular
charac-teristics (the orientation of the studied anions was irrelevant due to their high symmetry).
We found the intrinsic analysis indispensable to correctly analyze the preferred orientations
of cations as it allowed us to observe an orientation that had not been identified before: this
orientation (termed as “orientation III”) implies the cation ring is perpendicular to the
inter-face with the alkyl chain pointing inward, toward the bulk. Later L´ısal and co-workers also
used intrinsic analysis to study the structure and dynamics of the liquid/vapor interface of
neat alkylmethylimidazolium (butyl, hexyl, octyl) NTf2as well as of butylmethylimidazolium
NTf2 with an adsorbed n-hexane layer of varying thickness on top of it.8,9
In this paper we report the first intrinsic study of liquid/liquid interfaces involving ionic
liquids. More importantly, this essay is also one of the few computational studies on
inter-faces of partially miscible liquids. Despite their high importance, such liquid/liquid interinter-faces
have received little attention. Biphasic systems of partially miscible liquids need typically
long simulation times (on the order of tens or hundreds of ns) to ensure solvation equilibrium
is established and the sampling of equilibrium configurations is performed efficiently. These
studies have become recently possible thanks to the availability of highly parallel
GPU-aided molecular dynamics softwares.37 For our study we chose two popular members of the
undoubtedly most studied imidazolium family: 1-n-butyl-3-methylimidazolium (BMIM)
hex-afluorophosphate (PF6) and 1-n-butyl-3-methylimidazolium bis(trifluoromethylsulfonyl)imid
(NTf2). While the former is known to show slight instability in water as it slowly undergoes
hydrolysis,38 the NTf−2 anion is totally water-stable hence recently favored over PF−6. Both
of these compounds are described as hygroscopic (i.e. they absorb humidity from air) but at
the same time also hydrophobic due to the relatively big apolar butyl chain of the cation and
the low basicity of the anions. Indeed, the excess electronic charge on these ions is highly
delocalized on many atoms leading to diffuse charge density and consequently rather low
ionic character. In order to have a comparison of the effect of an apolar as well as a polar
cy-clohexane or water. As a matter of fact, IL – water mixtures as well as interface systems are
[image:6.612.68.541.199.449.2]of tremendous technological importance and have thus garnered considerable attention.39–44
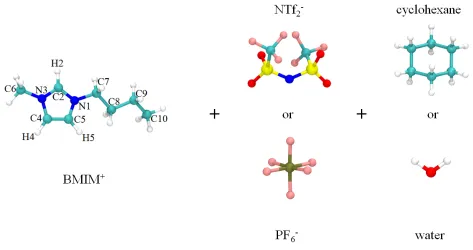
Figure 1 summarizes the studied liquid/liquid interfaces. As a reference, we also present
results obtained on the liquid/vapor interface (technically liquid-vacuum interface due to
the low vapor pressure of ILs) of both ionic liquids.
Figure 1: Components constituting the studied liquid – liquid interface systems. These sys-tems are: BMIM NTf2– cyclohexane, BMIM NTf2– water, BMIM PF6– cyclohexane, and
BMIM PF6– water. As a reference, the liquid/vapor interface of both IL species was also
simulated. In this figure the atomic labels of the cation are also displayed. Hydrogen, carbon, oxygen, phosphorus, sulfur, nitrogen, and fluor atoms are represented with white, turquoise, red, brown, yellow, blue, and pink spheres, respectively.
Theoretical Methods
Computational Details
Molecular dynamics simulations were carried out with the GROMACS 4.6.7 simulation
ensemble at ambient conditions (298.15 K and 1 bar) by keeping the cross-sectional area of
the simulation box fixed to 5.7 x 5.7 nm2 and letting only the box length perpendicular to
the interface (z direction) vary. Liquid/vapor interfaces were also simulated as a reference in
the canonical ensemble at constant temperature (298.15 K) and volume with box lengths in
the x and y directions equal to 5.7 nm, whereas the z length was set to high enough values
ensuring that the two liquid/vapor interfaces created in the box are at least 12 nm far from
each other. To keep the temperature constant in all simulations we used the Nos´e-Hoover
thermostat,46,47 while constant pressure was maintained with the Parrinello-Rahman
baro-stat.48 To ensure fast equilibration and an efficient sampling we kept all bond lengths fixed,
but the remaining degrees of freedom were free to move. This made it possible to safely use
a time step for the numerical integration of the equations of motion as large as 2 fs. All
non-bonded interactions were truncated beyond the spherical cut-off of 1.2 nm. To account
for the long range part of the electrostatic interactions we applied the PME implementation
of the Ewald summation scheme.49 Corrections of the truncated dispersion interaction were
used when calculating energy and pressure. We applied periodic boundary conditions in all
directions, which, due to the particular geometry of the simulated system, led effectively
to simulating a stack of liquid slabs. The electrostatic energy of periodic systems includes
a shape-dependent term, which, for the slab case, depends on the average dipole moment
of the simulation box,50 and can in principle be accounted for by using different correction
schemes.51,52 In the present case, however, since the average dipole moment of the system is
zero, the correction is not necessary.51
In the first step each neat liquid phase was separately equilibrated as bulk in the NpT
ensemble. For IL phases, simulations were started from previously equilibrated configurations
of 512 ion pairs. For the other liquids, initial configurations were created by randomly
placing 7500 water or 1000 cyclohexane molecules in a box by avoiding overlaps. To create
liquid/vapor interfaces we extended the box of the previously equilibrated bulk liquids in the
the two neat liquids were placed next to each other leaving some free space in between to
avoid overlaps, after which we performed a short simulation (500 ps) in the NpT ensemble
for the system to be able to close this gap and reach a near equilibrium volume. From the
resulting configuration further equilibration was launched aiming at reaching a system of two
liquids of equilibrium composition. The latter was monitored through the size of the largest
clusters of each species (see below). Due to the high viscosity of some systems, in certain
cases equilibration lasted as long as a few hundred ns. In the next step, production runs
were performed to sample equilibrium configurations. This lasted for 100 ns for liquid/liquid
interfaces yielding a sample of 10000 configurations, and 20 ns for liquid/vapor interfaces to
obtain a sample of 4000 configurations.
Molecular models
Choosing a reliable atomistic model for ionic liquids that gives accurate description of most
properties is a non-trivial task. Indeed, early ionic liquid force fields aimed for generality and
simplicity therefore net charges on ions were set to their integer nominal value. However,
it turned out that while these force fields are able to reproduce static properties with a
certain accuracy, their performance is poor in terms of dynamics: the predicted viscosities
are way too high and the computed diffusion coefficients are too low compared to the actual
experimental values. Later on, many studies have suggested that using integer charges leads
to a system much too cohesive probably due to the exaggerated ionic character that fixed
point charge models (lacking sufficient level of sophistication) can provide.53–56 In reality,
the bulky ions of ionic liquids have more molecular character due to their high polarizability
and the high degree of delocalization of their charge density. It has also been shown that the
reduced ionic character can be accounted for in an effective way by setting ionic net charges,
in absolute terms, to less than unity leading to the emergence of a series of new ”reduced
charge models”.17,53–56 Note that these models treat the effect of polarization in a simplified
changes of the electric field. As the degree of polarization varies significantly from one ionic
liquid to another these modified force fields are designed to accurately describe one single
ionic liquid species, thus precluding general transferability. In a notable study, K¨oddermann
and coworkers showed that the correct reproduction of both static and dynamic properties
is possible also by leaving overall charges on anions and cations set to unity but reducing
the LJ parameters of certain atoms (i.e. weakening dispersion interactions).19,57 This result
confirms that the main issue with the original integer charge models is that they are too
cohesive (i.e. the internal energy is too low). However, in spite of the success of this effective
model in reproducing physico-chemical properties, the physicality of leaving the provenly
exaggerated ionic character unchanged is debatable.
As the accurate description of molecular interactions between ILs and other liquids is
key to reproducing the right solubility, interfacial thermodynamics (e.g. interfacial tension),
and consequently the interface structure, we chose to use computationally efficient reduced
charge models to describe ionic liquid interactions. The importance of choosing such models
became obvious when, as a first trial, we set up the BMIM PF6– water interface using
the Canongia-Lopes–P´adua force field58 in combination with the TIP4P water model59 and
we obtained a totally miscible system as opposed to experimental observations. This is in
accordance with the findings of Chaumont et al. who scaled overall charges on BMIM PF6
to ±0.9e to obtain more realistic solvation properties with water.17 To describe the BMIM
PF6 ionic liquid we chose the force field developed by Bhargava and Balasubramanian which
sets the total charge on ions equal to ±0.8e.53 We found this model to describe density as
well as dynamic properties with a good accuracy. To model BMIM NTf2 we applied the
force field published by Logotheti et al. that sets net ionic charges to ±0.9e and which the
authors reported to reproduce experimental densities as well as self-diffusion coefficients at
acceptable precision.60 Both force fields are fully flexible and contain bond stretching, angle
bending as well as proper and improper torsional potentials. A series of the most typical
ionic liquids: Acetonitrile, dimethyl sulfoxide, hexanol, benzene, cyclohexane, and water.
However, the first two solvents proved to be totally miscible with both ionic liquids. The
IL-hexanol systems turned out to be very viscous making the equilibration extremely long
(more than 0.5 µs) at ambient conditions. In turn, while the solubility of both ionic liquids
was basically negligible in benzene, the solubility of benzene in ILs turned out to be so
high (in accordance with experimental observations)61 that the separation of the two phases
was not feasible by means of the simple cluster counting algorithm since benzene molecules
formed a fully percolating network in the whole system. For this reason, we also omit these
systems from the current study. We were eventually left with cyclohexane and water. For all
organic solvents we applied the OPLS force field, while for water we compared four popular
models (SPC, SPC/E, TIP4P, and TIP4P2005) and chose eventually SPC62 as it showed
the best overall performance regarding solubility and interfacial tension estimates with both
ionic liquids. Although not discussed here in the paper, we included snapshots of IL – hexanol
and IL – benzene systems in SI. Also, interfacial tension and solubility values are presented
in SI as calculated for IL – water systems, computed with the four popular water models.
Separation of phases of partially miscible liquids
The primary purpose of the ITIM analysis is to identify atoms residing at the surface of fluid
phases. If the ITIM analysis is to be performed on a liquid/liquid interface first one has
to unambiguously separate molecules belonging to one or the other phase. No complication
arises if the two species do not mix and hence each species constitutes one single phase. In
such a case, the terms “species” and “phase” can be used almost interchangeably. However,
if the two species exhibit non-negligible miscibility the phases are not neat and the separation
of molecules making up the different phases is needed. This, in general, is a non-trivial task.
In order to avoid confusion, in what follows, we will try to make a clear distinction between
phases and species, and when we refer to a phase of a given species we will mean the phase
the other species).
In this work, we tackle the problem of partial miscibility by performing a distance-based
cluster search that provides molecular connectivity and the corresponding molecular clusters.
The threshold distance beyond which two atoms are not considered belonging to the same
cluster was set separately for each species based on the location of the first minimum in the
corresponding radial distribution functions. In a biphasic system, we define the phase rich
in a given species as the union of the largest cluster of that species and all
smaller-than-largest clusters of the other species. Unfortunately, this basic cluster search based scheme
can be used only when the partial miscibility of the species is relatively low: the algorithm
works fine if the molecules of a given species assemble into one major cluster and a couple of
well separated molecular aggregates solvated in the other phase. However, this may not be
fulfilled if the minor clusters are of a size comparable to that of the largest cluster. Another
problematic situation is when the molecules form fingers deeply protruding into the opposite
phase. In an extreme case, the system might become fully percolating for one or both species
(i.e. it becomes bicontinuous), while still forming two distinct phases where densities are
markedly different. In such cases, more involved algorithms would be needed to accurately
distinguish the two phases
Intrinsic surface analysis: the ITIM method
The intrinsic analysis, in the first place, yields the complete list of surface atoms by which the
surface is unambiguously defined according to the capillary wave theory. To identify surface
atoms we use the ”Identification of Truly Interfacial Molecules” (ITIM) method.26 This
method consists in ”dropping” probe spheres, organized on a grid, from the opposite phase
onto the phase to be analyzed. Probe spheres are ”moved” along a direction parallel to the
macroscopic surface normal until they ”touch” the first atom which is then labeled as surface
atom. In this analysis, we represent atoms with spheres of a diameter equal to their
of interface atoms is readily available. To have a continuous intrinsic surface defined at any
(x,y) points we use a linear triangular interpolation scheme.25,27Such an algorithm was found
to be a very efficient way of accurately computing intrinsic distances (zintrinsic) and, based
on them, intrinsic profiles. The result of the cluster search in combination with the ITIM
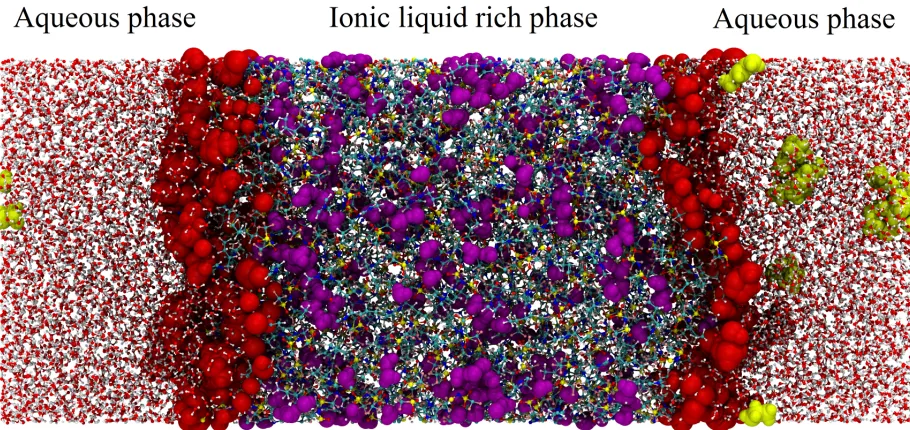
analysis is illustrated in Figure 2 with an equilibrium snapshot from the BMIM NTf2– water
system: molecules solvated in the opposite phase (drawn as large yellow and purple spheres
for the IL and water, respectively) are highlighted as well as atoms constituting the IL-rich
[image:12.612.78.533.267.482.2]phase (large red spheres).
Figure 2: Result of the combination of the ITIM analysis with the cluster search in an equilibrium snapshot of the BMIM NTf2– water interface system. The phase rich in the IL
is in the middle surrounded by the aqueous phases. Note that our systems are fully periodic in all directions. The large red spheres represent the atoms found at the surface of the IL-rich phase by means of the ITIM analysis. Atoms of water molecules solvated in the IL-IL-rich phase as well as those of cations and anions hydrated in water are drawn with large purple and yellow spheres, respectively. Their separation from their main phases was determined by a simple distance-based cluster search analysis. For an explanation of the applied color code of atoms see the caption of Figure 1.
The ITIM method makes use of one free parameter that determines its resolution, i.e. it
controls the length scale of the surface roughness one can probe. It is reasonable to think that
roughness. Therefore the sensible choice for the size of the probe should be comparable with
the average radius of the building blocks (here atoms) in the system. To be consistent with
our previous studies here we chose to use probes of a radius of 2 ˚A. It is worth mentioning
that the ITIM method has recently been generalized to be able to deal with surfaces of
arbitrarily curved shapes.63
Results and Discussion
Equilibrium compositions
Before presenting the interface structure, we start our discussion by reporting interfacial
tensions and miscibilities in the studied biphasic systems and comparing them to respective
experimental values. Interfacial tension values were calculated from the virial route by
integrating, along z, the difference of pressure components lateral(average of px and py) and
normal (pz) to the interface.64 This serves, on the one hand, as validation of the chosen
molecular models. On the other hand, one can benchmark the phase separating capability of
the cluster analysis by comparing the obtained solubilities (xj,clusti ) to those estimated from
densities far from the inteface (xj,densi ):
xj,densi =
ρji Mi
ρjj Mj +
ρji Mi
, (1)
xj,clusti = N
i
tot−Smaxi Smaxj +Ntoti −Smaxi
, (2)
wherexji is the mole fraction of species iin species j. ρji denotes the mass density of species
i, calculated far from the interface in the phase rich in species j, while Mj and Mi are the
corresponding molar masses. Ntoti is the total number of molecules of species iin the system,
while Smaxi denotes the number of molecules or ion pairs (i.e. the average of the number of
of the species in the biphasic system.
Computed and experimentally measured solubility and interfacial tension values are
re-ported in Table 1. This table shows that, on the one hand, the BMIM NTf2 model
repro-duces the experimental surface tension as well as the interfacial tension with water with an
acceptable accuracy, but while the former is somewhat overestimated, the latter value is
underestimated. These deviations hint that the chosen model might overestimate the
po-lar (ionic) character of BMIM NTf2. This conclusion is further confirmed by the fact that
the mutual solubility of BMIM NTf2 with water is roughly twice higher than the measured
values. Although there are no available data regarding the miscibility of this IL with
cyclo-hexane as well as their interfacial tension, the experimentally measured solubility of n-cyclo-hexane
in BMIM NTf2 (0.095) indicates that the actual solubility of cyclohexane in BMIM NTf2
might be higher than the computed value (0.03).75 All things considered, we conclude that
the performance of the model by Logotheti et al. is acceptable for our purposes. A possible
refinement of the force field might consist in further decreasing partial charges and somewhat
increasing Lennard-Jones parameters to make the model less polar.
The performance of the chosen BMIM PF6 force field seems even better than that of
the BMIM NTf2 model. Indeed, it accurately reproduces the interfacial tension values with
both cyclohexane and water, though it somewhat underestimates surface tension. What is
more, the estimated solubility of this IL in water is quite close to the experimental value.
The only respect where the model seems to somewhat fall short is when it comes to the
solubility of water in the IL: it underperforms by 50%. As for the case of cyclohexane,
we found one experimentally measured solubility value in a 2001 article by Blanchard and
Brennecke,61 but since the published value seems too high (0.21) as compared to the very
low solubility of alkanes in ILs we are reluctant to use it as a reference. In the same paper
total miscibility of n-hexane in BMIM PF6 is reported, which seems incompatible with the
general understanding.65Based on the concerns raised above, we prefer to omit the published
Table 1: Comparison of the computed solubility and interfacial tension values for the studied interface systems composed of an IL (BMIM NTf2 or BMIM
PF6) and another species (water or cyclohexane). Experiments and simulations
were performed at 298 K and 1 bar. Solubility data (given as mole fractions) were calculated in two ways, referred to as “dens.” and “clust.” (see text). For better visibility, experimental solubility data are displayed bold faced.
Anion other Solubility
species IL in other sp. / 10−3 other sp. in IL
NTf−2 cyclohexane dens. 0 0.029±0.007
clust. 0 0.029±0.005
exp. -
-water dens. 0.5±0.1 0.61±0.02 clust. 0.5±0.2 0.54±0.02
exp. 0.31a 0.25a
PF−6 cyclohexane dens. 0 0.006±0.001
clust. 0 0.006±0.002
exp. -
-water dens. 1.26± 0.07 0.14±0.01 clust. 1.0±0.3 0.11±0.02
exp. 1.28b 0.26c
Anion other Interfacial tension (mN m−1) species Simulation Experiment NTf−2 vacuum 38 ±3 32.9d– 38.4e
cyclohexane 9± 2 -water 8± 2 13.2f PF−6 vacuum 40 ±4 43.8g – 48h
cyclohexane 14 ±1 13.15i water 10 ±1 10.06i
As long as miscibilities are relatively low, values estimated from the cluster analysis
match perfectly those calculated based on bulk densities. The latter can be considered
the reference method as it is defined only with bulk equilibrium properties. However, as
solubilities increase, the cluster analysis systematically underestimates as is seen in the case
of the solubility of water in either IL. We relate this to the ambiguity in separating molecules
(e.g. those constituting fingers) belonging to one phase or the other. This shows that the
macroscopic concept of the interface loses its meaning at the microscale between liquids of
considerable mutual miscibility. We note that the miscibility threshold above which the
cluster analysis systematically underestimates equilibrium compositions when benchmarked
with values computed from bulk densities necessarily depends on the shape of the constituting
ions and molecules as well as the particular topology of the given interface.
Density profiles
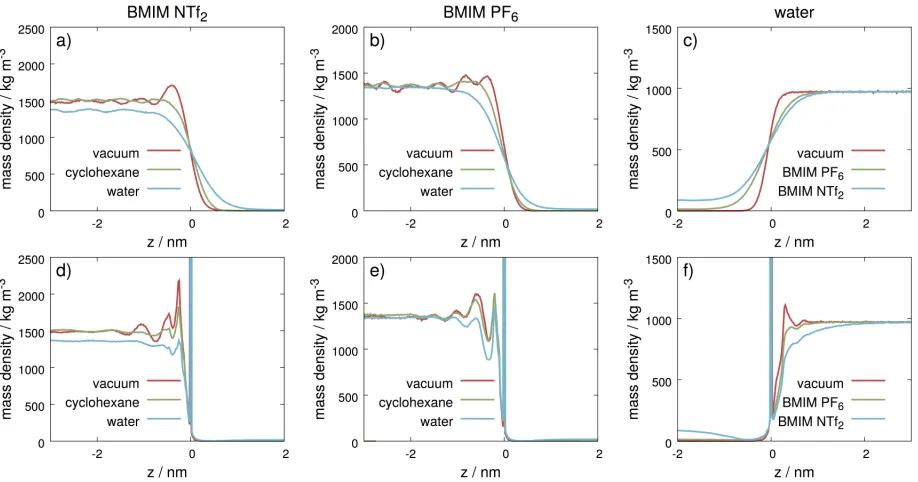
In Figure 3 we present profiles computed with respect to the flat macroscopic plane of the
surface (i.e. global profiles, Figure 3 a-c) and those calculated with respect to the actual
instantaneous surface of a phase as determined by means of the ITIM method (i.e. intrinsic
profiles, Figure 3 d-f). The conventional global density profiles in Figure 3 a-c show a smooth
increase near the interfacial region, while they display a wavy shape of decreasing amplitude
towards the bulk. It is immediately apparent that global profiles get strongly dampened (i.e.
planar layering is strongly reduced) as soon as there is another liquid phase present in the
system regardless of its polarity. Moreover, the density enhancements at the liquid-vapor
interfaces, plotted as black curves in Figure 3 a-c are removed at liquid/liquid interfaces. In
the case of IL – water systems, the bulk ionic liquid density is lower than in the neat system
due to the significant solubility of water in the IL-rich phases.
Intrinsic density profiles computed with respect to the surface of either the IL-rich or
the water-rich phases displayed in Figure 3 d-f also show some noticeable features (profiles
Figure 3: Comparison of global (a-c) and intrinsic (d-f) density profiles computed at all interfaces of BMIM NTf2 (a,d), BMIM PF6 (b,e), and water (c,f). The intrinsic density
profiles were computed with respect to the surface of the phases rich in either BMIM NTf2
(d) or BMIM PF6 (e) or water (f). Flattening of IL density profiles can be observed as the
phase opposite to the IL changes from vacuum through cyclohexane to water.
to their insensitivity to the opposite phase.) The first observation is that these intrinsic
profiles display a more pronounced structure than global profiles. Right at the interface
a delta-like trivial peak occurs. This is because the surface is defined by the positions of
surface atoms which consequently are all at zintrinsic = 0. As one decreases the bin width
to obtain finer resolution this peak can increase to an arbitrary level. Under this layer of
surface atoms there appears an immediate depleted region due to the excluded volume of
surface particles, which is followed by alternating regions characterized with densities above
or below the bulk value indicating positive or negative density correlations with respect to
the instantaneous surface. In the case of BMIM NTf2, the dampening of the correlations due
to the other phase is more pronounced than in the systems containing BMIM PF6: Indeed,
the intrinsic density profiles of BMIM NTf2 are almost totally flat at 0.7 - 1 nm beneath the
seems to be affected (here peak heights get lowered) while the dampening is much weaker
than in BMIM NTf2 systems. Therefore, density profiles calculated at BMIM PF6 surfaces
still show noticeable structure as deep as 2 nm under the surface, irrespective of the nature
of the other fluid. The actual shape of the intrinsic density profiles is the consequence of
the layering, but it is also very strongly related to the particular structure and shape of the
molecules constituting the phase. This dependence, which is totally not straightforward,
could be elucidated by a more thorough analysis, but as it is beyond the scope of the present
paper, we leave it for a future study.
Intrinsic density profiles calculated at liquid/liquid interfaces display a decrease of the
height of the second and subsequent peaks with respect to the corresponding liquid/vapor
systems. This decrease can be sensibly explained by a transfer of molecules from the
under-lying layers to either the bulk or the surface. Generally, a decrease in interfacial tension leads
to an increase in surface area, which makes it possible to accommodate more molecules at
the surface. The decrease in interfacial tensions and the corresponding interface broadening
observed in the mean-filed density profiles are consistent with the increase in the number of
surface molecules.
At a liquid/liquid interface, the surface of both constituting phases can be identified and
hence intrinsic density profiles can be computed with respect to the surface of either liquid
phase. Figure 4 compares global as well as intrinsic density profiles calculated at the BMIM
NTf2– water interface with respect to either liquid phase. Intrinsic profiles computed with
respect to the opposite phases (blue curve in Figure 4 b and red curve in Figure 4 c) contain
information regarding how much the density of a given phase is correlated with the surface
of the other phases. No correlation would result in totally flat profiles. The fact that these
profiles calculated with respect to the surface of the opposite phase are not flat means that
there is some correlation between the surface layering of the two phases, though it vanishes
Figure 4: Global (a) and intrinsic (b and c) density profiles calculated in the BMIM NTf2–
water system. When calculating intrinsic density profiles, the surface of the phase rich in either IL (b) or water (c) was considered as reference plane. While very little correlation is observed with respect to the macroscopic surface (a), noticeably more structured intrinsic profiles are displayed by both intrinsic curves (b and c). Note that the opposite phases also display remarkable density correlation near the interface with respect to the reference instantaneous liquid surface.
Distribution of surface atoms and molecules
In the next step we calculated the number of particles at the surface of the IL-rich phases as
the opposite phase changes. Such an analysis provides information on the surface
composi-tion and the distribucomposi-tion of typical (groups of) atoms that the molecules of the other phase
encounter at the interface. In our analysis, every ion and molecule that has at least one atom
found at the surface is defined as surface ion or molecule. Note that molecules of the other
species were occasionally also found at the surface. The composition of the surface layers
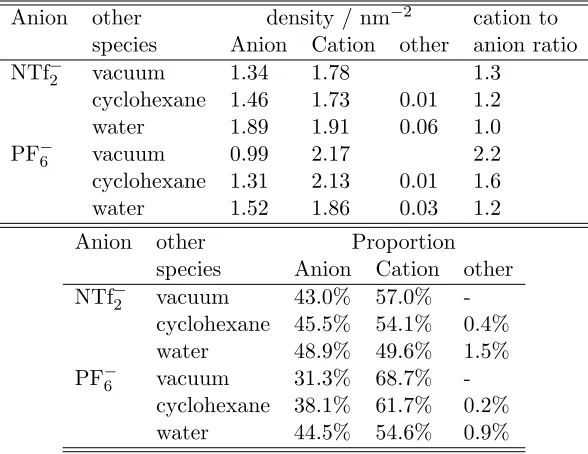
of the IL-rich phases is given in Table 2. Composition is described with surface (number)
densities which were simply calculated by dividing the average number of the given ion or
Table 2: The molecular surface density (see text) of anions, cations and molecules of the other species (cyclohexane or water), as well as their proportion computed at the surface of the phase rich in ionic liquid.
Anion other density / nm−2 cation to
species Anion Cation other anion ratio NTf−2 vacuum 1.34 1.78 1.3
cyclohexane 1.46 1.73 0.01 1.2 water 1.89 1.91 0.06 1.0 PF−6 vacuum 0.99 2.17 2.2 cyclohexane 1.31 2.13 0.01 1.6 water 1.52 1.86 0.03 1.2 Anion other Proportion
species Anion Cation other NTf−2 vacuum 43.0% 57.0%
-cyclohexane 45.5% 54.1% 0.4% water 48.9% 49.6% 1.5% PF−6 vacuum 31.3% 68.7%
-cyclohexane 38.1% 61.7% 0.2% water 44.5% 54.6% 0.9%
Table 2 shows a couple of interesting trends. One can immediately notice that in all
cases, the total number of ions at the surface is indeed higher when the opposite phase is
either liquid with respect to the liquid/vapor case. It is also readily seen that the surface is
always more populated with cations than anions. This is most pronounced in the case of IL –
vacuum systems. This unbalanced repartition of ions is related to the relatively small size of
the anions. Indeed, the well-known high butyl chain density at the liquid/vapor interface of
BMIM containing ILs leads to an efficient screening of the underlying anions such that they
are not “seen” from the opposite phase. Accordingly, as the anion becomes more comparable
in size with the cation (case of BMIM NTf2) this unevenness is reduced (see Table 2). This
disparity further decreases when the IL faces cyclohexane; it is even more so when the polar
water is the opposite phase.
To understand better how the polarity and the coverage of the surface by different
molec-ular moieties change from one system to the other we computed the distribution of atoms at
the surface (i.e. atoms contributing to the trivial peak of the intrinsic profiles) at all ionic
C atom they belong to and derived occurrences for corresponding methine (CH), methylene
(CH2) and methyl (CH3) groups. Similarly, the occurrence of atoms of NTf−2 anions is
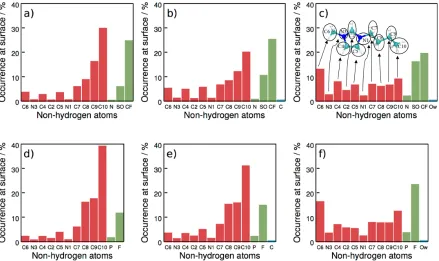
dis-cussed with that of N, SO2 and CF3 groups. Figure 5 shows the distribution of groups at the
IL-rich surfaces of BMIM NTf2 (a-c) or BMIM PF6 (d-f) when the opposite phase is either
[image:21.612.88.527.208.469.2]vacuum, cyclohexane, or water, respectively.
Figure 5: Frequency of identifying non-hydrogen atoms as surface atoms in the ITIM analysis at the surface of phases rich in BMIM NTf2(a-c) or BMIM PF6(d-f) while the opposite phase
is either vacuum (a,d), cyclohexane (b,e), or water (c,f). As illustrated in the inset of graph c, overall counts are derived for CH3, CH2, and CH groups by considering the occurrence of
H atoms together with that of the carbon atoms they belong to. Atoms in the NTf−2 anions are similarly combined into groups. Red, green and blue columns correspond to groups of the cation, anion, and molecules of the other species, respectively. This analysis reveals that the occurence of butyl chains decreases while rings and anions (i.e. polar moieties) become more exposed to the surface of the IL-rich phases when the opposite phase changes from vacuum through cyclohexane to water.
Figure 5a and d reveal that in the case of the interface with vacuum, the majority of atoms
at the surface belong to the butyl chain, while ring atoms are encountered only occasionally.
This distribution noticeably changes at interfaces with cyclohexane (Figure 5b, e) where the
occurrence of the last methyl (C10) and methylene (C9) groups of the butyl chain decreases,
and the recurrence of ring atoms at the surface increases. This can be simply interpreted as a
steric effect: Although still a considerable number of butyl chains stick out from the surface,
not all of them can be incorporated in the cyclohexane phase. In the case of the interfaces
with water, these tendencies become significantly more pronounced. At interfaces between
both ILs and water (see Figure 5 c and f), a drastic reduction of the occurrence of butyl
chain atoms is accompanied by a significant increase of the occurrence of the ring atoms.
Surprisingly, the methyl ligand (C6) becomes the most frequent group of the entire cation at
the surface: it appears 4 times more often at the surface than in the BMIM NTf2– vacuum
system, while the terminal methyl group of the butyl ligand encounters a 4-fold drop in
relative occurrence. At the same time, the anion’s rather polar SO2 groups become almost
equally frequently found at the surface as CF3 groups, and even the central N atom is found
at the surface occasionally.
These trends show that when moving from liquid/vapor to liquid/liquid interfaces the
coverage of butyl chains at the surface decreases and at the same time the polar character
of the surface increases through an increase of surface density of polar moieties. This also
implies that the orientational preferences of surface ions must also drastically change. This
aspect is discussed in the next Section of this paper.
Orientation analysis of interface molecules
The identification of the most preferred molecular orientations at the surface provides crucial
information regarding the character of the interface, which is necessary, among others, to
attain a molecular-level understanding of the mechanism and kinetics of transport through
the interface.
To describe the orientation of the cations we followed the same analysis applied in our
ILs.6,7 The orientation of both the “head” (i.e. the imidazolium ring) and the “tail” (the
butyl chain) is described: in the case of the imidazolium ring which, due to its aromaticity,
can be treated as a rigid body, we computed a bivariate distribution, while for the butyl
chain, a univariate angular distribution. To calculate the bivariate statistics of the rings
we followed the methodology proposed by Jedlovszky et al.: we compute the likelihood of
observing any combinations of the angular polar coordinates (P(cosθ, φ)) of the macroscopic
surface normal (~n) in a coordinate frame fixed to the imidazolium ring (X’,Y’,Z’).76 In this
frame axis Z’ is chosen to point along the bisector of the vectors pointing from the C2 atom
to the two N atoms, N1 and N3 (for the atomic labels see Figure 1). Axis Y’ points along
the N1→N3 vector while axis X’ is perpendicular to Y’ and Z’ in a way that the (X’,Y’,Z’)
triplet satisfies the right-hand rule. Angle θ is the angle between the macroscopic surface
normal (~n) and axis Z’, whileφ is the angle formed between axis Y’ and the projection of~n
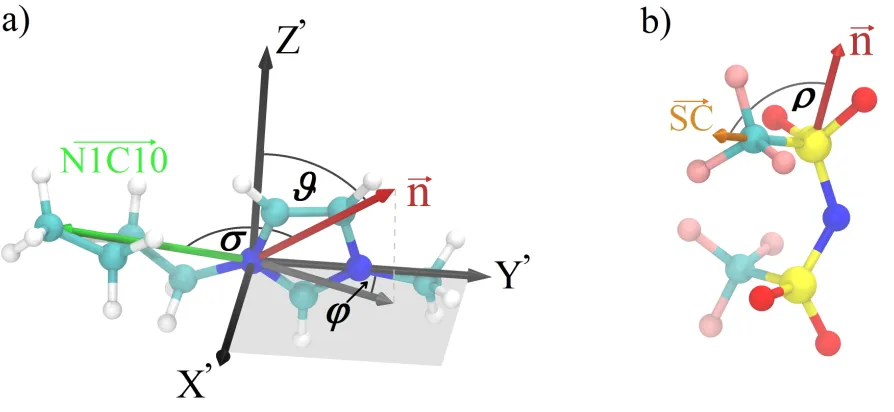
onto the (X’,Y’) plane. See Figure 6 for an illustration of the definition of these angles. The
orientation of the butyl chains is described by computing the distribution of the cosine of
the angle (σ) formed between the macroscopic surface normal and the vector pointing from
the first nitrogen atom adjacent to the butyl chain (N1) to the last carbon atom of the butyl
(C10) chain (see Figure 6).
We were also interested in describing the orientational preferences of anions. For PF−6,
this is of no practical value due to the high symmetry of this ion, while NTf−2 has a less
sym-metric, “two-armed” shape. To elucidate in what directions the “arms” point we computed
the distribution of the cosine of the angle (ρ) of the vector pointing from the sulfur atom of
the polar sulfonyl group to the carbon atom of the adjacent apolar CF3 group with respect
to the macroscopic surface normal (see Figure 6). In Figure 7 we display the computed
orientational distributions of the imidazolium rings of BMIM NTf2 (a-c) and BMIM PF6
(d-f) as calculated at the interfaces between the ILs and vacuum, cyclohexane, and water.
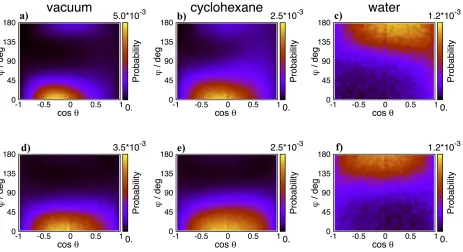
The orientational preferences of both cations, represented as color maps in Figure 7,
Figure 6: Definition of angles for the analysis of preferred orientations at the surface. A body-fixed coordinate frame is used to describe the orientation of the rigid imidazium rings of the cations with the polar angle coordinates θ and φ (a). The orientation of the butyl chains of cations (N1→C10 vector) as well as that of the apolar ”arms” of the NTf−2 anions (S→C vector) are described with the distribution ofσ and ρ, respectively(a,b).
vacuum through cyclohexane to water. At the IL – vacuum interface (Figure 7 a and d) the
overwhelming majority of cation rings have both a cosθ and a φ value near 0. This pair
of values corresponds to an orientation where the ring’s plane is parallel with the surface
normal and N1, to which the butyl chain is attached, points outward to the opposite phase,
while N3 (on the side of the methyl substituent) points inward to the bulk. This is indeed the
most typical cation ring orientation found both in experiments and simulations. In previous
studies we called this orientation “orientation I”.6,7 Note that the peak for the BMIM NTf 2–
vacuum system (Figure 7 a) is shifted to slightly negative cosθ values, which means the ring
(still perpendicular to the surface) is slightly tilted in a way that its C5 atom turns towards
the surface and the C2 atom turns away form it (i.e. towards the bulk). This observation
is consistent with what we have found for the distribution of surface atoms. Indeed, in
orientation I, due to simple geometrical reasons, C5 is expected to appear at the surface
more often than the C2 atom. Such an unevenness is indeed found in the distribution of
system (see Figure 5 a) supporting thus the slightly tilted orientation of the cations.
A secondary, weak preference appears on the map of the BMIM NTf2– vacuum system
(Figure 7 a) at around cosθ = 0 and φ = 180◦. This peak corresponds to an orientation
where the plane is again parallel with the surface normal but now the butyl chain is on the
bulk side of the interface, while the methyl group points outward to the opposite phase. We
referred to this orientation as “orientation III” in our previous work where we identified it
as a distinct feature for the first time.6,7 The existence of this orientation has been since
confirmed by other researchers too at interfaces of alkylimidazolium NTf2 ILs with vacuum
and water.8,19As the opposite phase is replaced with cyclohexane, see Figure 7 b and e, the
main features do not change qualitatively, however broadening of the peaks can be observed
(i.e. they become noisier). In systems where the opposite phase is water (see Figure 7 c and
f) a drastic qualitative change is observed in the orientation maps: “orientation III” becomes
dominant while “orientation I” turns marginal and practically disappears from the map.
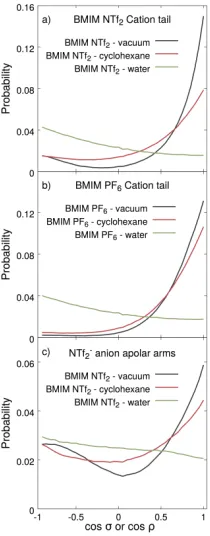
Trends in the orientational preferences of the butyl chains, displayed in Figure 8 a and b,
are consistent with our observations made for the imidazolium rings. At both IL – vacuum
interfaces the most probable orientation of butyl chains is to point towards the opposite
phase along the surface normal (cosσ = 1). In the case of BMIM NTf2, a little secondary
maximum appears too at cosσ = −1 which means a little fraction of the butyl chains
(undoubtedly belonging to imidazolium rings of orientation III) point inward, towards the
bulk. The appearance of this peak can be explained with the less packed structure of
the BMIM NTf2 phase due to the larger size of the anion. When the opposite phase is
cyclohexane slight quantitative but no qualitative changes can be observed: the distributions
become less sharp (especially for BMIM NTf2). At IL–water interfaces the picture changes
qualitatively and the peak at cosσ = −1 becomes dominant, though the distribution is
very flat which renders all other orientations likely too. The orientational preferences of
the S→C vectors (representing the “arms”) of the NTf2 anions show very similar changes
Figure 7: Preferred orientations of the imidazolium rings of the BMIM cations at the surface of the phases rich in BMIM NTf2 (a-c) and BMIM PF6 (d-f) when the opposite phases
is either vacuum (a,d), cyclohexane (b,e) or water (c,f). The bivariate distributions are represented as 2D maps (for the definition of the coordinate frame see Figure 6). When water is the opposite phase cations turn with their butyl chains inside toward the bulk allowing polar ionic moieties become more exposed to the surface.
with vacuum and cyclohexane the most probable orientation of S→C vectors is an outward
pointing direction along the surface normal. At the same time, a pronounced second peak
can also be observed at cosρ=−1 which shows that a non-negligible fraction of the ”arms”
points inside, to the bulk. This conclusion is different from findings of former studies that
concluded the NTf−2 anions’ both CF3 groups point exclusively outwards to the vapor phases
parallel with the surface normal.8,11,18,19 We explain this by the rougher analysis performed
in those studies that considered only the average orientation instead of a distribution of
possible orientations. At the BMIM NTf2– water interface however this second peak becomes
dominant implying that apolar “arms” have a high tendency to point inward. This change
in the orientational preference of the anions was previously suggested by other simulation
apolar “arms” of the anions pointing inward is again consistent with the increased appearance
of polar groups observed in Section ’Distribution of surface atoms and molecules’. These
changes imply among others a water-induced decrease in the hydrophobic character of the
[image:27.612.250.355.169.437.2]IL surface.
Figure 8: Distribution of orientation angles σ of butyl chains (described with the vector pointing from N1 to the last methyl group, C10, of the butyl chain, see Figure 1) of BMIM cations at surfaces involving BMIM NTf2 (a) or BMIM PF6 (b); and distribution of the
anglesρ of the apolar arms of the NTf−2 anions (represented by the vector pointing from the S atom to the C atom). For the definition of these angles see Figure 6. At interfaces with water, these apolar moieties tend to turn from the side of the opposite phase towards the IL bulk letting polar moieties become more exposed to the surface and hence promoting a less apolar overall character.
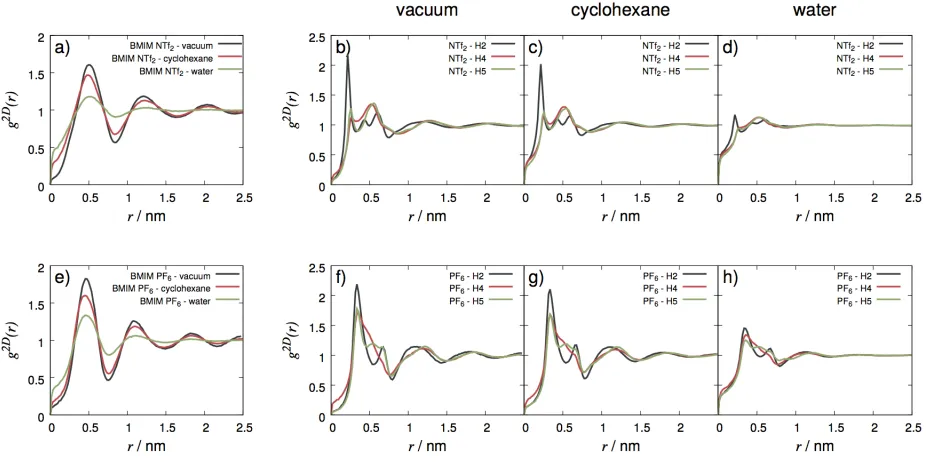
Molecular associations in the plane of the surface
In the last part of our analysis we investigated how molecular ordering changes in the plane of
the surface. To this end, we computed two-dimensional radial distribution functions (g2D(r))
in how cations and anions associate with themselves or each other as well as how water
associates with both the anion and the cation. We note that the surface, a 2D object by
definition, is defined by atoms, however here we analyze entire surface molecules, hence we
might sometimes consider pairs of atoms in our analysis whose projections on the (x,y) plane
fall very close to each other though in reality one is effectively behind the other one (along
the z direction). As a result, the 2D RDFs do not necessarily display zero at short distances.
(Note that the increasing roughness leads to more of such situations thus increasing the
shoulder at very short distances.)
In general, we observe the same trend for all kinds of 2D radial distribution functions:
spatial correlations are strong and extend over the whole surface in IL – vacuum systems,
but get somewhat dampened (meaning lowered peaks, but the a range of correlations does
not change) as soon as the opposite phase is cyclohexane. The drastic change comes again
when the opposite phase is water. As a result, for both ILs, the range of correlations
be-comes much shorter as well as peaks are flattened. We illustrate these trends with 2D radial
distribution functions computed between surface anions and cations: Figure 9 shows the
distribution function of radial distances between the central atoms of the anions and the
center of mass of imidazolium rings (a and e), as well as between the three H atoms attached
to the imidazolium rings and either the central P atom of PF−6 anions (f-h) or the H-acceptor
O atoms of the sulfonyl groups of NTf−2 anions (b-d). 2D radial distribution functions
com-puted between cation-cation and anion-anion pairs are shown in the Supporting information
(Figure S1). Figure 9 illustrates well both the dampening of anion-cation correlations, and
how the reported preference of both anions to associate with cations via the most acidic H
atom of the ring (H2) vanishes at IL – water interfaces.
As water molecules can act both as H-donor and acceptor, in the last step we investigated
if cation-anion associations are replaced with links between surface water molecules and
cations or anions. Accordingly, we calculated 2D radial distribution functions between the
Figure 9: Anion-cation associations described by 2D radial distribution functions computed in the (x,y) plane (i.e. the plane of the macroscopic surface) between either the center of mass of the imidazolium ring and the central atom of anions (a,e) or between the three ring H atoms of the imidazolium ring and either the O atoms of NTf−2 anions (b-d) or the P atom of PF−6 anions (f-h). In the case of both IL species all cation-anion correlations get dampened as the opposite phase changes from vacuum through cyclohexane to water. The preference of the anion to bind with the most acidic H2 atom of the ring vanishes at the IL – water interfaces.
P or N atoms of surface anions (see Figure 10 a), or any of the three ring H atoms of the
cation (see Figure 10 b, c). The displayed curves are somewhat noisy due to the relatively
low occurrence of water molecules at the surface of the IL rich phases, but they clearly
show that anions always associate with surface water molecules. On the contrary, cation–
water associations are observed only in the BMIM NTf2– water system established uniquely
through the most acidic H2 atom of the ring. We relate this simply to the higher ionic
character of the BMIM+ cation in combination with the NTf
2 anion. The importance of
water–anion interactions over those between water molecules and cations has been reported
by a series of quantum chemical as well as classical calculations performed both in gas phase
cations and water was also evidenced experimentally and computationally through H atoms
[image:30.612.254.353.122.369.2]attached to the imidazolium ring, with a preference to interact with H2.79,80
Figure 10: 2D radial distribution functions calculated in the (x,y) plane (i.e. the plane of the macroscopic surface) between the O atom of surface water molecules and either the central atom (N or P, respectively) of NTf−2 and PF−6 anions (a), or the 3 ring H atoms of BMIM cations at the surface of phases rich in either BMIM NTf2 (b) or BMIM PF2 (c). Water
molecules do associate with both anions, however water-cation associations can be observed only in the case of BMIM NTf2 through the most acidic H2 atom.
Summary and Conclusions
In this study we investigated, by means of molecular dynamics simulations, how the
in-trinsic structure of liquid/liquid interfaces involving ionic liquids changes upon varying the
opposite fluid phase. Namely, we studied interfaces between ionic liquids and both an
apolar liquid, cyclohexane, and a polar one, water. We chose to study two of the most
popular ionic liquid species, both members of the alkylimidazolium family:
1-n-butyl-3-methylimidazolium hexafluorophosphate (BMIM PF6) and 1-n-butyl-3-methylimidazolium
corre-sponding IL – vacuum interfaces. Since the mutual miscibility in the studied biphasic systems
is not negligible we applied a distance-based cluster search algorithm to unambiguously
sep-arate the fluid phases. The performance of the IL models was assessed through comparing
computed interfacial tensions and equilibrium compositions to experimental values. We
found the performance of the BMIM NTf2 model acceptable, but we suspect that the model
overrates the ionic character of the IL. Based on the same criteria, the performance of the
BMIM PF6 model was excellent. Furthermore, we found that solubility values estimated
based on the size of the largest clusters determined with the cluster search algorithm agree
reasonably well with those computed based on equilibrium densities, but the former approach
tends to underestimate equilibrium compositions with increasing miscibilities. We explain
this with the increasing theoretical ambiguity when it comes to separating highly mixed fluid
phases and hence to defining the interface between them on the microscopic level.
In the next step we performed the ITIM analysis on the separated liquid phases in each
sampled configuration and determined the list of surface atoms. We then carried out further
analyses to assess, in particular, (i) both global and intrinsic ordering (by means of density
profiles) along the surface normal, (ii) associations between surface ions and molecules in the
plane of the surface, as well as (iii) the most preferred orientations of surface ions. Global
density profiles, i.e. density correlations computed with respect to a flat surface, inevitably
suffer from the smearing effect of thermally excited capillary waves compared to intrinsic
density profiles that use the instantaneous atomic surface as a reference to compute density
correlations. Accordingly, our global profiles showed much less structured shape compared to
intrinsic profiles. We found that the structure of the surface of both ionic liquid rich phases
gets disrupted (i.e. spatial correlations and orientational preferences are dampened) as soon
as the opposite phase is either liquid instead of vacuum. Already the non-mixing apolar
fluid weakens correlations, which are further reduced at IL – water interfaces. Furthermore,
the surface of the phase rich in BMIM NTf2 seemed to be affected more by water (i.e. the
phase, due probably to the higher solubility of water in BMIM NTf2.
In contrast to what was observed at IL – vacuum interfaces, the tendency of surface anions
to associate with surface cations is severely decreased and the preference of the anions to
bind to cations through the most acidic ring hydrogen, H2, is almost totally wiped out at
IL – water interfaces. While water molecules at the surface of both IL-rich phases tend to
associate with anions, they associate with cations only in the case of the BMIM NTf2 IL
(through H2), which is rationalized by the stronger ionic character of the BMIM+ cation in
combination with the NTF−2 anion. The surfaces of IL-rich phases are dominated by cations
which, on the one hand, are bigger than either anion and, on the other hand, have a high
tendency to point with their butyl chains toward vacuum (to a somewhat lesser extent also
to cyclohexane) and thus cover anions. However, the surplus of cations at the surface almost
vanishes at IL – water interfaces. Accordingly, we observed polar moieties being revealed and
“pulled” to the surface from underlying intrinsic molecular layers. This was accompanied by
a drastic change, irrespective of the anion, in the orientational preferences of cations as they
turned with their butyl chains toward the bulk poiting with their methyl substituent to the
water phase. Similarly, anions were found to have a higher tendency to turn with their apolar
”arms” towards the bulk at BMIM NTf2– water interface. This increased appearance of polar
moieties at IL – water interfaces shows a water-induced decrease of the apolar character and
the adaptive capability of IL surfaces depending on the polarity of the opposite phase. In
our subsequent study we plan to investigate the dynamics of transport through IL – water
interfaces.
Acknowledgement
GH is thankful for financial support provided by COST Action MP 1305 (“Flowing Matter”).
GH is an E¨otv¨os postdoctoral fellow of the Hungarian Scholarship Board Office which is
No.642774) is also acknowledged. SK and GH thank the Austrian Research Fund (FWF):
START-Projekt Y 627-N27.
Supporting Information
Snapshots of simulated systems that are not tractable by the proposed methodology
(IL-hexanol and IL-benzene systems); interfacial tension and solubility data for IL – water
sys-tems calculated with 4 different water models; and various additional 2D radial distribution
functions calculated at the surface of IL-rich phases are included.
References
(1) Welton, T. Room-Temperature Ionic Liquids. Solvents for Synthesis and Catalysis
Chem. Rev.1999,99, 2071.
(2) Plechkova, N. V.; Seddon, K. R. Applications of Ionic Liquids in the Chemical
In-dustry Chem. Soc. Rev.2008,37, 123-150.
(3) Castner, E. W. Jr.; Margulis, C. J.; Maroncelli, M.; Wishart J. F. Ionic Liquids:
Structure and Photochemical ReactionsAnnu. Rev. Phys. Chem. 2011, 62, 85-105.
(4) Lovelock, K. R. J. Influence of the Ionic Liquid/Gas Surface on Ionic Liquid
Chem-istryPhys. Chem. Chem. Phys. 2012,14, 5071-5089.
(5) Rowlinson, J. S.; Widom, B.; Molecular Theory of Capillarity; Clarendon press:
Oxford, U.K., 1982.
(6) Hantal, G.; Cordeiro, M. N. D. S.; Jorge, M. What Does an Ionic Liquid Surface
Really Look Like? Unprecedented Details from Molecular SimulationsPhys. Chem.
(7) Hantal, G.; Voroshylova, I.; Cordeiro, M. N. D. S.; Jorge, M. A Systematic Molecular
Simulation Study of Ionic Liquid Surfaces Using Intrinsic Analysis Methods Phys.
Chem. Chem. Phys. 2012, 14, 5200-5213.
(8) L´ısal, M.; Posel, Z.; Iz´ak, P. AirLiquid Interfaces of Imidazolium-Based [TF2N] Ionic
Liquids: Insight from Molecular Dynamics Simulations Phys. Chem. Chem. Phys.
2012, 14, 5164-5177.
(9) L´ısal, M.; Iz´ak, P. Molecular Dynamics Simulations of n-Hexane at
1-Butyl-3-methylimidazolium Bis(trifluoromethylsulfonyl)imide InterfaceJ. Chem. Phys.2013,
139, 014704-1-15.
(10) Bhargava, B. L.; Balasubramanian S. Layering at an Ionic Liquid-Vapor Interface:
A Molecular Dynamics Simulation Study of [Bmim][PF6] J. Am. Chem. Soc. 2006,
128, 10073-10078.
(11) Perez-Blanco, M. E.; Maginn, E. Molecular Dynamics Simulations of CO2 at an Ionic
Liquid Interface: Adsorption, Ordering, and Interfacial Crossing J. Phys. Chem. B
2010, 114, 11827-11837.
(12) Lynden-Bell, R. M. GasLiquid Interfaces of Room Temperature Ionic Liquids Mol.
Phys.2003,101, 2625.
(13) Pensado, A. S.; Costa-Gomes, M. F.; Canongia-Lopes, J. N.; Malfreyt, P.; P´adua,
A. A. H. Effect of Alkyl Chain Length and Hydroxyl Group Functionalization on the
Surface Properties of Imidazolium Ionic LiquidsPhys. Chem. Chem. Phys.2011,13,
13518-13526.
(14) Heggen, B.; Zhao, W.; Leroy, F.; Dammers, A. J.; M¨uller-Plathe, F. Interfacial
Properties of an Ionic Liquid by Molecular Dynamics J. Phys. Chem. B 2010, 114,
(15) Dang, L. X.; Wick, C. D. Anion Effects on Interfacial Absorption of Gases in Ionic
Liquids. A Molecular Dynamics Study J. Phys. Chem. B 2011, 115, 6964-6970.
(16) Lynden-Bell, R. M.; Kohanoff, J.; del P´opolo, M. G. Simulation of Interfaces between
Room Temperature Ionic Liquids and Other LiquidsFaraday Discuss.2005,129, 57.
(17) Chaumont, A.; Schurhammer, R.; Wipff, G. Aqueous Interfaces with Hydrophobic
Room-temperature Ionic Liquids: a Molecular Dynamics Study J. Phys. Chem. B
2005, 109, 18964-18973.
(18) Iwahashi, T.; Sakai, Y.; Kim, D.; Ishiyama, T.; Morita, A; Ouchi, Y. Nonlinear
Vibrational Spectroscopic Studies on Water/Ionic Liquid([Cnmim]TFSA: n = 4, 8)
InterfacesFaraday Discuss. 2012,154, 289-301.
(19) Konieczny, J. K.; Szefczyk, B. Structure of Alkylimidazolium-Based Ionic Liquids
at the Interface with Vacuum and Water – A Molecular Dynamics Study J. Phys.
Chem. B2015,119, 3795-3807.
(20) Iwahashi, T.; Ishiyama, T.; Sakai, Y.; Morita, A; Kim, D.; Ouchi, Y. Liquid/Liquid
Interface Layering of 1-butanol and [bmim]PF6 Ionic Liquid: a Nonlinear Vibrational
Spectroscopy and Molecular Dynamics Simulation StudyPhys. Chem. Chem. Phys.
2015, 17, 24587.
(21) Linse, P. Monte Carlo Simulation of LiquidLiquid BenzeneWater InterfaceJ. Chem.
Phys.1987,86, 4177-4187.
(22) Benjamin, I. Theoretical Study of the Water/1, 2dichloroethane Interface: Structure,
Dynamics, and Conformational Equilibria at the Liquidliquid Interface J. Chem.
Phys.1992,97, 1432-1445.
(23) Chac´on, E.; Tarazona, P. Intrinsic Profiles beyond the Capillary Wave Theory: a
(24) Chowdhary, J.; Ladanyi, B. M. Water-Hydrocarbon Interfaces: Effect of
Hydrocar-bon Branching on Interfacial StructureJ. Phys. Chem. B 2006, 110, 15442-15453.
(25) Jorge, M.; Cordeiro, M. N. D. S. Intrinsic Structure and Dynamics of The
Wa-ter/Nitrobenzene Interface J. Phys. Chem. C 2007, 111, 17612-17626.
(26) P´artay, L. B.; Hantal, G.; Jedlovszky, P.; Vincze, ´A.; Horvai, G. A New Method for
Determining the Interfacial Molecules and Characterizing the Surface Roughness in
Computer Simulations. Application to the Liquid-Wapor Interface of WaterJ. Comp.
Chem. 2008, 29, 945-956.
(27) Jorge, M.; Jedlovszky, P.; Cordeiro, M. N. D. S. A Critical Assessment of Methods
for the Intrinsic Analysis of Liquid Interfaces. 1. Surface Site Distributions J. Phys.
Chem. C 2010, 114, 11169-11179.
(28) Jorge, M.; Hantal, G.; Jedlovszky, P.; Cordeiro, M. N. D. S. A Critical Assessment of
Methods for the Intrinsic Analysis of Liquid Interfaces. 2. Density profiles J. Phys.
Chem. C 2010, 114, 18656-18663.
(29) Hantal, G.; Darvas, M.; P´artay, L. B.; Horvai, G.; Jedlovszky, P. Molecular Level
Properties of the Water Surface at the Interface with Various Fluid Phases, as Seen
from ITIM Analysis of Computer Simulation Results J. Phys.: Condens. Matter
2010, 22, 284112-1-14.
(30) P´artay, L. B.; Jedlovszky, P.; Horvai, G. Structure of the LiquidVapor Interface
of WaterAcetonitrile Mixtures As Seen from Molecular Dynamics Simulations and
Identification of Truly Interfacial Molecules Analysis J. Phys. Chem. C 2009, 113,
18173-18183.
(31) Pojj´ak, K.; Darvas, M.; Horvai, G.; Jedlovszky, P. Properties of the LiquidVapor
Interface of WaterDimethyl Sulfoxide Mixtures. A Molecular Dynamics Simulation
(32) P´artay, L. B.; Horvai, G.; Jedlovszky, P. Temperature and Pressure Dependence of
the Properties of the LiquidLiquid Interface. A Computer Simulation and
Identifica-tion of the Truly Interfacial Molecules InvestigaIdentifica-tion of the WaterBenzene SystemJ.
Phys. Chem. C 2010, 114, 21681-21693.
(33) Hantal, G.; Terleczky, P.; Horvai, G.; Nyula´aszi, L.; Jedlovszky, P. Molecular Level
Properties of the Water-Dichloromethane Liquid/Liquid Interface, as Seen from
Molecular Dynamics Simulation and Identification of Truly Interfacial Molecules
Analysis. J. Phys. Chem. C 2009, 113, 19263-19276.
(34) Darvas, M.; P´artay, L. B.; Jedlovszky, P.; Horvai, G. Temperature Dependence of the
Lateral Hydrogen Bonded Clusters of Molecules at the Free Water Surface J. Mol.
Liq.2012,153, 88-93.
(35) Abrank´o-Rideg, N.; Darvas, M.; Horvai, G.; Jedlovszky, P. Immersion Depth of
Surfactants at the Free Water Surface: A Computer Simulation and ITIM Analysis
Study J. Phys. Chem. B 2013, 117, 8733-8746.
(36) F´abi´an, B.; Sz˝ori, M.; Jedlovszky, P. Floating Patches of HCN at the Surface of Their
Aqueous Solutions Can They Make HCN World Plausible? J. Phys. Chem. C2014,
118, 21469-21482.
(37) Hess, B.; Kutzner, C.; van der Spoel, D.; Lindahl, E. GROMACS 4: Algorithms
for Highly Efficient, Load-Balanced, and Scalable Molecular Simulation J. Chem.
Theory Comp.2008, 4, 435-447.
(38) Visser, A. E.; Swatloski, R. P.; Reichert, W. M.; Griffin, R. T.; Rogers. R. D.
Tradi-tional Extractants in NontradiTradi-tional Solvents: Groups 1 and 2 Extraction by Crown
Ethers in Room-Temperature Ionic Liquids Ind. Eng. Chem. Res. 2000, 39,