Crystal templating through liquid–liquid phase separation
Joanna Mosses,a David A. Turton,a Leo Lue,b Jan Sefcik,b and Klaas Wynnea,bControlled induction of crystal nucleation is a highly desirable but elusive goal. Attempts to speed up crystallization, such as high super saturation or working near a liquid-liquid critical point, always lead to irregular and uncontrollable crystal growth. Here, we show that under highly nonequilibrium condi-tions of spinodal decomposition, water crystals grow as thin wires in a template-less formation of “Haareis”. This suggests that such nonequilibrium conditions may be employed more widely as a mechanism for crystal growth control.
The physical chemistry of crystal nucleation is of great fundamental and practical importance but is yet poorly understood. It is therefore one of the grand challenges on the border between physics, chemistry, and chemical engineering. Crystal nucleation in melt or solution is typically described by Gibbs’s classical nuclea-tion theory based on the competinuclea-tion between the free energy of solidificanuclea-tion and the free energy due to the presence of the interface.1, 2 The latter results in a barrier to crystallization and hence super-saturation and a
metastable nonequilibrium state. Thermodynamic fluctuations then lead to pre-nucleation sites, the majority of which will redissolve.3 Occasionally, a nucleus will grow big enough to overcome the barrier (a critical
nucle-us) and continue to grow. Only at considerable super-saturation will the energy barrier disappear, at which point homogeneous nucleation will occur.
As a result, crystal nucleation is generally a rare process that is difficult to study either experimentally or even through computer simulation. In addition, Ostwald’s rule of stages suggests that there are intermediate metastable states critical to the understanding of the path and thermodynamics of nucleation. Such metasta-ble states are typically too rare or short-lived to be observed.
However, recent work by Gebauer and others has shown that in some cases (such as the nucleation of car-bonates from aqueous solution4-7) solute clusters may form that aggregate into amorphous clusters, which
then transform into crystal nuclei.4, 7-9 Such non-classical nucleation theories do not require a “critical nucleus”.
These theories appear to, but may not necessarily,10 be counter to thermodynamic theory. Interestingly, a
number of light scattering studies of solutions have shown anomalous clustering in solution suggesting that the effect might be more general.11, 12
In the 1990s, Frenkel introduced the concept of the enhancement of crystal nucleation due to the presence of liquid–liquid critical points.13 Such a critical point would induce concentration fluctuations that would give
rise to droplets of so-called “dense fluid” in which the nucleation probability would be greatly enhanced.7, 14-16
Thus, in this scheme the nucleation mechanism is not changed (it could be classical or non-classical) other than to provide an environment with an increased concentration. Although Frenkel’s theory was developed for protein crystallization, it is now widely used in chemical-engineering descriptions of crystal nucleation of small molecules where the dense-fluid effect is referred to as “oiling out”.17, 18 However, the direct application of
a theory for suspensions of mesoscopic objects to small molecules in solution is unlikely to be straightforward as the interaction strengths are very different.19, 20
Here we will study the nucleation of crystals in highly nonequilibrium conditions experimentally. There have been many previous experiments in which crystallization in deeply supersaturated solutions was studied. It is considered well known that high driving force for nucleation results in ill defined amorphous or polycrys-talline objects.17, 21, 22 Here we will take a systematic approach and study crystal nucleation in the presence of (a
critical point for) liquid–liquid phase separation using liquids of small molecules and will demonstrate that high driving force does not necessarily lead to ill defined crystalline forms.
cho-sen molecular liquids (a “solute” liquid and a “solvent” liquid) where the solute-rich fraction after phase separa-tion is most stable in its solid state (see Fig. 1).
Fig. 1.Liquid-solid phase diagrams for mixing two substances. (left) Two substances that mix well will exhibit a eutectic point. Cooling the mixtures will nucleate a solid phase. (right) Substances that mix poorly will give rise to liquid-liquid demixing on cooling. In particular cases, liquid-liquid demixing can be followed by crystallization of one of the phases.
The system chosen first was the well-known mixture of nitrobenzene in hexane, which has an upper conso-lute temperature of 293.55 K at a critical nitrobenzene mole fraction of 0.4275.23 Experiments were carried out
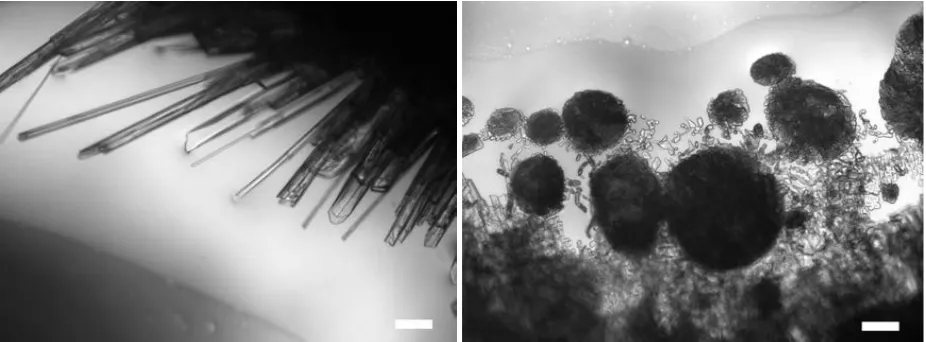
with 0.1%, 1%, and 10% nitrobenzene in hexane by volume, where one expects liquid-liquid phase separation at 184, 226, and 278 K (see SI). The samples were prepared from nitrobenzene (>99.9%) and hexane (99.2%, <0.001% water by Karl Fisher coulometry, Sigma Aldrich), which were used as supplied. The samples were cooled down to 183 K, 223 K, and 253 K respectively at rates of 0.5, 10, and 50 K/min. The 0.1% and 1% samples produce needle like crystals at all cooling rates. However, the 10% sample produced needle like crystals at the slowest cooling rates, mixtures of crystals and round amorphous shapes at the intermediate rate, and only round amorphous shapes at the highest cooling rate (see Fig. 2).
Fig. 2.Nitrobenzene crystal growth under liquid-liquid phase-separation conditions. A mixture of 10% by volume of nitrobenzene in hexane, cooled to 253 K at 0.5 K/min (left) and 50 K/min (right). Scale bar corresponds to 100 µm. Bright-field microscopy images were recorded using a Nikon Eclipse 50i microscope with a 5-megapixel DS-Fi1 camera. Temperature was controlled to ±0.1 K using a Linkam THMS600 microscope stage and T95 controller. All samples were loaded in a freezer at a temperature of about 248 K to avoid evaporation and water absorption, into a 2 mm-deep quartz crucible (ID = ø15 mm).
X
0
1
T
X
0
1
liquid
solid
nucleation
liquid
solid
[image:2.595.67.530.456.627.2]These results are not unexpected. Hexane has a melting temperature of 178 K and therefore remains liquid in all these experiments while nitrobenzene has a melting temperature of 278 K. Thus, when the nitrobenzene-hexane mixture is cooled below the liquid-liquid binodal, the nitrobenzene rich fraction that phase separates is unstable with respect to crystallization of nitrobenzene. At the lowest cooling rate, there is sufficient time for a nitrobenzene rich droplet to nucleate followed by crystallization of nitrobenzene and further growth. At the higher cooling speeds, the system apparently remains metastable for a sufficiently long time that the spinodal can be crossed. Below the spinodal, phase separation takes place everywhere at once at a range of length scales leading to uncontrolled crystallization. As can be seen in Fig. 2, this leads to the formation of round structures containing polycrystalline nitrobenzene.
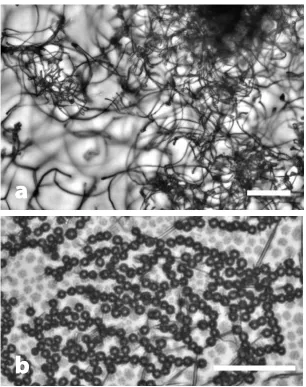
Fig. 3.Water crystal growth during liquid-liquid phase separation from trans-1,2-dichlorobenzene (trans-DCE). Different cooling rates result in different morphology of nucleating water crystals in trans-DCE with 458 ppm water. A cooling rate of 0.5 K/min (a) results in the formation of fluff-like wires at about 255 K while a rate of 50 K/min (b) results in round structures at about 233 K. Data taken as in Fig. 2. Scale bars 50 µm.
The second system chosen was the mixture of water in trans-1,2-dichloroethylene (trans-DCE, 99.6% Sigma Aldrich, melting temperature 223 K) at a concentration of 80 or 458 ppm as determined by Karl Fisher coulom-etry. These two liquids mix very poorly and the highest concentration of water in trans-DCE is 458 ppm at room temperature. The upper consolute temperature and critical concentration are not known but the binodal and spinodal are estimated to be steep functions of the water mole fraction (See SI).
At first glance, the crystal formation patterns as a function of cooling rate (see Fig. 3) are very similar to those observed in nitrobenzene in hexane: at low cooling rates crystals appear to form whereas at higher cool-ing rates, polycrystalline round structures form. However, the crystalline structures are highly unusual: they are thin curved wires that grow for about 50 µm, then branch off a handful of additional wires, which then grow linearly again, etc. Fig. 4 and the movie in the SI show this brush-like growth pattern more clearly. This
a
figure also demonstrates the asymmetry of the crystalline structures. When this growth continues for a while it forms what looks like balls of “fluff”.
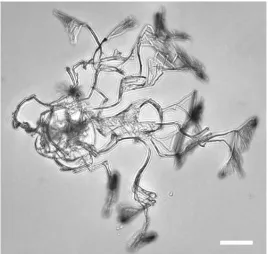
Fig. 4.Bright-field microscopic images of fluff-like water crystals in trans-DCE. Typical appearance of nucle-ating water crystals showing an asymmetric brush-like crystal growth in trans-DCE with 80 ppm water cooled to 213 K. Scale bar 50 µm.
Fig. 5 shows the effect occurring in a bulk sample. Here, water fluff is seen to float in the bulk but in particu-lar near interfaces. In the microscopy experiments, the location of greatest growth is also near an interface such as the meniscus of the liquid drop. Although the water fluff can be formed at a temperature where trans-DCE is supercooled, it does not act as a nucleation site for its crystallization. In the experiments, supercooled trans-DCE crystallizes spontaneously on a timescale of an hour in bulk experiments (see SI). Experiments were carried out in other nonpolar liquids and similar results were found in cis-1,2-dichloroethylene and CS2 (see the
[image:4.595.64.532.473.648.2]SI for details).
Fig. 5.Dark field images of fluff-like water crystals in trans-DCE. The samples shown here are contained in a 2 mm deep by 10 mm wide quartz cuvette inside a cryostat cooled to 218 K. Scale bars are 1 mm. (a) In a freshly cooled sample, water fluff floating in supercooled liquid carried by a convection current. (b) Similar sample but after several minutes of equilibration. The arrow points to a large agglomeration of water fluff nucleated on the curved gas-liquid interface. Suspended fluff below the meniscus continues to give rise to light scattering.
Raman spectra of the wires could be taken only after the removal of liquid trans-DCE through vacuum evaporation at 228 K. The spectra in the region of the ice phonon band (150-350 cm-1) and the OH-stretch
re-gion are shown in Fig. 6. The Raman spectrum from 100 to 3,600 cm-1 is indistinguishable from that of
hexago-nal ice24 and does not show any activity in the CH-stretch region ruling out clathrate formation. Slight shifts
(~5 cm-1) in the phonon band are observed, which are attributable to size effects.
Fig. 6. Raman spectra of fluff-like water crystals. Confocal Raman microscopy experiments were performed us-ing a Horiba LabRAM HR system. The excitation source was a 532-nm DPSS laser with a laser power at the sample stage of 28 mW. A 50 µm diameter aperture and 50× long-working distance objective were used to record the Ra-man spectra.
Highly nonequilibrium crystal growth is typically associated with polycrystallinity and uncontrollable shapes. In our experiments on nitrobenzene–hexane mixtures that are pushed towards the spinodal of the liquid–liquid phase separation, this is most certainly the case. It is almost certain that reports of “oiling out”17, 18
are all related to the crossing of such spinodals although the spinodal can be below the liquid–solid separa-tion line in some cases. However, in mixtures of poorly mixing substances (by necessity at low concentrasepara-tion), we have found that crossing the spinodal results in highly organized asymmetric wire-like structures without the use of external templates.
The asymmetric structure seen, for example, in Fig. 4 is highly unexpected. When a water ice crystal grows in an environment low in free water molecules (such as in the cold air of the atmosphere), the growth habit is the standard hexagonal form and symmetric snowflake patterns develop caused by the limitation in the rate of diffusion of the free water molecules. In fact, there are currently 121 known categories of aqueous solid pre-cipitation particles, none of which is shaped like a wire or fluff.25 Here, we have observed novel asymmetric
growth and asymmetric branching inconsistent with transport-limited growth.
There is only one little-known wire-like form of water ice, known as Haareis, Kammeis, or needle ice. Haareis is formed when a template (such as the bark of a dead tree or porous soil) is just above 0° C while the air above is just below.26 However, in the results described here there is no external physical template. Although the
bi-nodal is very steep making it difficult to predict the location of the spibi-nodal, it is likely that the conditions used here make the homogeneous mixture unstable leading to spinodal decomposition in which water is forced to phase separate from a nonpolar liquid. This leads to highly nonequilibrium crystal-growth conditions. Thus, under these circumstances the bicontinuous structure associated with spinodal decomposition of water and trans-DCE is acting as an effective template for crystal growth.
There have been reports that trans-DCE undergoes a liquid–liquid phase transition in the supercooled re-gime.27-3031, 32 Based on previous studies33, 34 and the current work, we believe the conclusions in these reports
to be incorrect and based on a misinterpretation of the spinodal-decomposition induced nucleation of water. In conclusion, we have shown that highly nonequilibrium crystal nucleation and growth does not have to result in uncontrolled polycrystalline phases. Rather, we have been able to make highly reproducible crystal-line wires (“Haareis”) without the use of an external template. We believe that such a liquid phase-separation induced crystal templating might be a general phenomenon with wider applicability than water ice.
25 20 15 10 5 0 In tensit y /a.u . 350 300 250 200 150
Raman shift /cm-1
fluff ice 40 30 20 10 0 In tensit y /a.u . 3600 3400 3200 3000 2800
We thank the Engineering and Physical Sciences Research Council (EPSRC) for support through grants EP/F06926X, EP/J004790, EP/J004812, and EP/J014478.
Notes and references
a School of Chemistry, WestCHEM, University of Glasgow, Glasgow G12 8QQ, UK
b Department of Chemical and Process Engineering, University of Strathclyde, Glasgow G1 1XJ, UK.
† Electronic Supplementary Information (ESI) available: Information on temperature-composition phase dia-grams of nitrobenzene–hexane and water–trans-DCE. Additional data on fluff in other nonpolar liquids. A vid-eo of the growth of fluff. See DOI: 10.1039/c000000x/
1. D. Erdemir, A. Y. Lee and A. S. Myerson, Acc Chem Res, 2009, 42, 621-629. 2. T. Kawasaki and H. Tanaka, Proc Natl Acad Sci USA, 2010, 107, 14036-14041.
3. D. Erdemir, S. Chattopadhyay, L. Guo, J. Ilavsky, H. Amenitsch, C. Segre and A. Myerson, Phys Rev Lett, 2007, 99, 115702.
4. A. Dey, P. H. H. Bomans, F. A. Mueller, J. Will, P. M. Frederik, G. De With and N. a. J. M. Sommerdijk, Nat Mater, 2010,
9, 1010-1014.
5. P. Raiteri and J. D. Gale, J Am Chem Soc, 2010, 132, 17623-17634.
6. C. J. Stephens, Y.-Y. Kim, S. D. Evans, F. C. Meldrum and H. K. Christenson, J Am Chem Soc, 2011, 133, 5210-5213. 7. A. F. Wallace, L. O. Hedges, A. Fernandez-Martinez, P. Raiteri, J. D. Gale, G. A. Waychunas, S. Whitelam, J. F.
Banfield and J. J. De Yoreo, Science, 2013, 341, 885-889.
8. D. Gebauer, A. Voelkel and H. Coelfen, Science, 2008, 322, 1819-1822.
9. T. Kovács, F. C. Meldrum and H. K. Christenson, J Phys Chem Lett, 2012, 3, 1602-1606. 10. R. Demichelis, P. Raiteri, J. D. Gale, D. Quigley and D. Gebauer, Nat Commun, 2011, 2. 11. A. Jawor-Baczynska, J. Sefcik and B. D. Moore, Cryst Growth Des, 2013, 13, 470-478. 12. Y. Georgalis, A. Kierzek and W. Saenger, J Phys Chem B, 2000, 104, 3405-3406. 13. P. Tenwolde and D. Frenkel, Science, 1997, 277, 1975-1978.
14. L. Filobelo, O. Galkin and P. Vekilov, J Chem Phys, 2005, 123, 014904.
15. L. Xu, S. V. Buldyrev, H. E. Stanley and G. Franzese, Phys Rev Lett, 2012, 109, 95702.
16. Y. Wang, A. Lomakin, R. F. Latypov, J. P. Laubach, T. Hideshima, P. G. Richardson, N. C. Munshi, K. C. Anderson and G. B. Benedek, J Chem Phys, 2013, 139, 121904.
17. P. Bonnett, K. Carpenter, S. Dawson and R. Davey, Chem Commun, 2003, 698-699.
18. R. J. Davey, S. L. M. Schroeder and J. H. Ter Horst, Angew Chem Int Edit, 2013, 52, 2166-2179. 19. V. Talanquer and D. Oxtoby, J Chem Phys, 1998, 109, 223-227.
20. J. Lutsko and G. Nicolis, Phys Rev Lett, 2006, 96, 046102. 21. L. R. Gomez and D. A. Vega, Phys Rev E, 2011, 83, 021501.
22. L. C. Jacobson and V. Molinero, J Am Chem Soc, 2011, 133, 6458-6463.
23. P. Méndez-Castro, J. Troncoso, J. Peleteiro and L. Romaní, Phys Rev E, 2013, 88, 042107.
24. Y. Yoshimura, S. T. Stewart, M. Somayazulu, H.-K. Mao and R. J. Hemley, J Phys Chem B, 2011, 115, 3756-3760. 25. K. Kikuchi, T. Kameda, K. Higuchi, A. Yamashita and W. G. M. F. N. C. O. S. Crystals, Atmospheric Research, 2013,
132-133, 460-472.
26. A. Wegener, Die Naturwissenschaften, 1918, 6, 598–601.
27. S. Kawanishi, T. Sasuga and M. Takehisa, J Phys Soc Jpn, 1982, 51, 1579-1583. 28. S. Kawanishi, T. Sasuga and M. Takehisa, J Phys Soc Jpn, 1981, 50, 3080-3084.
29. S. Rzoska, J. Ziolo, A. Drozd-Rzoska, J. L. Tamarit and N. Veglio, in J Phys-Condens Mat, 2008, vol. 20, p. 244124. 30. K. Merkel, A. Kocot, R. Wrzalik and J. Ziolo, J Chem Phys, 2008, 129, 074503.
31. M. Rovira-Esteva, A. Murugan, L. C. Pardo, S. Busch, M. D. Ruiz-Martin, M. S. Appavou, J. L. Tamarit, C. Smuda, T. Unruh, F. J. Bermejo, G. J. Cuello and S. J. Rzoska, Phys Rev B, 2010, 81, 092202.
32. M. Rovira-Esteva, N. A. Murugan, L. C. Pardo, S. Busch, J. L. Tamarit, G. J. Cuello and F. J. Bermejo, J Chem Phys, 2012, 136, 124514.