LOW ENERGY COMMUNITIES: THE AUTOMATIC SIZING OF HYBRID
RENEWABLE ENERGY SCHEMES AND THE GENERATION OF A SIMULATION
INPUT MODEL FOR PERFORMANCE APPRAISAL
Joe Clarke, Jon Hand, Jun Hong, Nick Kelly, Marco Picco, Aizaz Samuel and Katalin Svehla
ESRU, University of Strathclyde, United Kingdom
ABSTRACT
Integrated building performance simulation provides an appropriate means to appraise the performance of low energy communities incorporating cooperating technologies for demand management and low carbon heat/power delivery. Only by addressing such communities in a holistic and dynamic manner can the performance characteristics of the individual technologies be discerned and overall, well-found solutions established.
This paper addresses a major issue confronting the utilisation of IBPS in such a role: how to generate the initial input model in terms of the capacity levels of each technology that are likely to give an effective demand/supply match in practice. In the described work this is accomplished by using a the MERIT search engine to locate the best quantitative match between demand (real or anticipated) and potential supply profiles and then using the outcome to help synthesise an ESP-r input model for use to ensure that the identified hybrid supply will deliver in practice. The approach ensures that the final design to emerge is arrived at through a rational process as opposed to the refinement of some initial design hypothesis based on arbitrary considerations.
INTRODUCTION
In response to government policies relating to energy utilisation and supply, attention is being directed to developing energy efficient, low carbon communities attaining through the deployment of local supply technologies sized to best match local load profiles. To this end, Integrated Building Performance Simulation (IBPS) is a powerful tool for the assessment of specific schemes. To realise the potential of the approach two significant barriers have yet to be overcome:
1. For a given community, existing or planned, a method is required to identify the mix of supply technologies (by type and capacity) that best match the anticipated demands. Such a method equates to a rational sizing procedure for hybrid new and renewable energy supplies as opposed to the arbitrary selection of a technology mix
based on exogenous factors such as roof area, net annual energy use or peak demand.
2. Once a best match is located, a method is required to (semi-automatically) generate the required model for simulation – typically comprising several hundred buildings with the selected supply technologies imposed. This model may then be used to appraise the feasibility of the embedded generation scheme in terms of relevant criteria such as indoor comfort, system controllability, heat and power quality, and carbon emissions reduction. This paper describes how these issues have been resolved by an approach based on two existing modelling tools when operated in co-operative mode: MERIT (2013) for demand/supply matching assessment and ESP-r (2013) for building simulation.
SIZING HYBRID SUPPLIES
A MERIT model will typically comprise several power profiles representing the heat and electricity demand over time of some target scheme (single building, community, city district etc.). A supply scenario is then established as an ad hoc collection of technologies of interest (PV, wind turbine, CHP, heat pump, biomass, fuel cell etc.). During the subsequent simulation all possible combinations of supply and demand profiles are assessed in terms of statistics that quantify the energy match. This process gives rise to a rank ordered list of best demand/supply profile combinations. For example, assuming a demand scenario comprising a heat and electricity profile and a supply scenario comprising 3 technologies, MERIT would undertake 21 combinatorial match assessments.
First, the user identifies the supply technologies of interest. Often this list will be speculative and might include technologies that are only of marginal interest.
Second, MERIT sets the capacity of each technology to some arbitrary value typically equal to that required to match the peak demand if that technology were deployed alone (and the renewable source was simultaneously available which is unlikely to occur in practice).
Third, the capacity of each technology is ‘chunked’ as a function of the minimum feasible contribution. For example, 1 MW of wind might be represented as 11 turbines of cumulative capacity (50 kW, 150 kW, 250 kW, 350 kW, 450 kW, 550 kW, 650 kW, 750 kW, 850 kW, 950 kW and 1 MW) because the rated power will affect the Capacity Coefficient; while 1 MW of PV might be represented as 100 separate modules each of 10 kW because outputs are additive. The user has control of the chunk size, which will depend on the scale of the scheme being processed: as with the discretisation process applied within a numerical representation of a building, chunks size can vary as a function of the required accuracy.
Fourth, a demand/supply profile match assessment is undertaken but now involving substantially more combinations because of the virtual technologies relating to the chunking process. This results in a rank ordered set of matches arrived at on the basis of two criteria as follows.
• A Rank Correlation Coefficient (RCC; Scheaffer and McClave 1982) that describes the correlation between demand and supply by calculating the degree to which the profile variables fall on the same least square line:
= ∑ − −
∑ − ∑ −
(1)
where Dt is the demand at time t, St the supply at time t, d the mean demand over time period n
and s the mean supply over time period n. RCC
describes the trend between the time series of two data sets and does not consider the relative magnitudes of the individual variables. Thus, if a supply system were doubled in size RCC
would remain the same even though the excess supply would be greater. Additionally, two profiles perfectly in phase with one another, but of very different magnitudes, would result in a perfect correlation, but not a perfect match. An Inequality Coefficient (IC; Williamson 1994) that describes the magnitude inequality due to three sources – unequal tendency (mean), unequal variation (variance) and imperfect co-variation (co-variance). IC ranges between 0 and 1, with 0 indicating a perfect match and 1 denoting no match.
= 1∑ −
1∑ + 1∑
2
• A Percentage match (PM) is then given by
= 1 − 100
(3)with PM indicates the overall match between demand and supply, ranging from excellent (90-100%) and very poor (0-10%).
The rank ordered matches to emerge from the process represents the technologies comprising hybrid system supplies that deliver the best quantitative match. The user is now able to select particular matches based on external factors such as site and budget constraints and then test the operational feasibility of schemes of interest based on explicit simulation.
TESTING SCHEME FEASIBILITY
The scheme selected from the above stage must now be transformed to a model suitable for simulation. In the present context the target program is ESP-r, requiring the explicit definition of multiple buildings and supplies in terms of geometric, constructional, operational and control parameters in the former case, and system layout, building interaction and control parameters in the latter case. While the ESP-r input model could be created in a conventional manner, the scale of an embedded generation community scheme, perhaps comprising several hundred dwellings, will normally render this approach infeasible. To overcome this problem an alternative approach based on pre-existing prototype models was established. These prototype models represent all conceivable dwelling configurations, now and in future, within a national housing stock thus allowing the ESP-r input model for a community to be generated semi-automatically. Because the approach to prototype model formulation is detailed elsewhere (Clarke and Samuel 2011), only a summary is included here.
An ESP-r estate model can therefore be formed by combining prototype models selected on the basis of the descriptive parameters related to the targeted community – age of dwellings, construction types
etc. To this model is added the supply technologies identified from the demand/supply matching and electricity/heat flow network models to connect technology outputs to dwelling loads.
EXAMPLE APPLICATION
The above two-part procedure is now demonstrated through application to a real case: a development at Upton in Northampton, UK (Figure 1). The site, originally farming land, was acquired by Northampton Development Corporation before passing to the Commission for New Towns in 1985. It is now under the control of English Partnerships, a national regeneration agency. The development is regarded as one of the best examples of sustainable design due to the commitment of the partners involved and one of the first applications of the Enquiry-by-Design method (EST 2006) for master planning. Based to its size and structure it is considered a model for future sustainable community development in the UK. The presented case study focuses on Site A, a developed residential neighbourhood occupying a total area of 3.7 hectares and accommodating 214 dwellings subdivided into 110 semi-detached houses (1 2-bed, 13 3-bed, 88 4-bed, 7 5-bed, 1 6-bed) and 104 flats (14 1-bed, 83 2-bed, 7 3-6-bed). The total annual electricity and heating demand of the site is 817,187 kWh and 3,106,098 kWh respectively, corresponding peak capacities of 311 kW and 1,278 kW. The detailed hourly electricity and heating profile for a winter week are as shown in Figure 2.
The low carbon supply technologies considered here are PV and wind turbines for electricity, and solar thermal and heat pumps for heating. According to the chunking procedure described above, different supply technologies are treated differently. Considering electricity as an example, the PV was chunked into 700 x 500W capacity units, while wind power was chunked into multiple turbines of increasing capacity: 10 kW, 30 kW, 50 kW… 290 kW, 310 kW and 330 kW. Because of the chunking process, the combinations between demand and supply profiles increase significantly from 3 to 131,771.
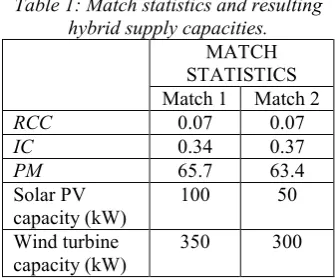
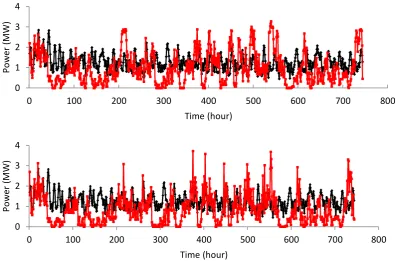
Figure 3 depicts the top two rated matches for electricity resulting from the MERIT search while Table 1 summarises the match statistics and required hybrid capacities for both cases.
At this stage, and as described above, an ESP-r estate model is constructed by selecting prototype models based on available information about the dwellings comprising the targeted community. To this is added the hybrid supply model represented
[image:3.595.335.503.228.367.2]in terms of individual technology models and heat/power network models to connect these technologies to the loads. Two options exist for the creation of this supply model: as a community scheme by which the supply is connected to aggregate load profiles, or as a building-integrated scheme by which the hybrid supply is apportioned to individual dwellings. Here the presented results correspond to the latter scheme which is the one typically pursued in practice. The case considered is a 2002 standard dwelling (140 m2 floor area) with 6.6 m2 of PV (0.5 kWe capacity) and a 1 m diameter wind turbine (1.3 kWe capacity).
Table 1: Match statistics and resulting hybrid supply capacities.
MATCH STATISTICS Match 1 Match 2
RCC 0.07 0.07
IC 0.34 0.37
PM 65.7 63.4
Solar PV capacity (kW)
100 50
Wind turbine capacity (kW)
350 300
Figure 4 illustrates the net electrical power flows associated with the dwelling over a week in spring, with negative values indicating that electrical power is exported to the local network. Also shown is the local network voltage; this is calculated using ESP-r’s electrical systems model, which can be used to assess the performance of electrical systems of varying complexity. In this case, only the local network around the building is modelled. The local supply voltage is heavily influenced by the performance of the dwellings’ local generation and its demand. As the demand increases, the local voltage drops below the nominal network supply voltage of 230 V. Conversely, as the supply from the local generation increases, the voltage rises. To assess the electrical performance of the dwelling, a 100 m length of underground cable was assumed to connect the dwelling to the local supply substation. To account for the effect of other dwellings connected to this cable, and possibly other local generation, the voltage at the grid supply point was subject to perturbation based on a mean voltage of 230 V and a standard voltage distribution of 1.9. These values were derived from monitored low voltage network data (Thomson and Infield, 2007). Figure 4 shows the resulting voltages calculated by ESP-r at the coupling point between the dwelling and the local network supply cable.
supply in the UK (230 V +10%/-6%); the results demonstrate that with the generation scheme as suggested by MERIT the voltage excursions are relatively minor and the supply voltage stays within limits. However, this may not be the case for all local generation schemes. Figure 6 shows the voltage variation with power import and export for an alternative scheme in which a PV system was simply sized to cover fully the net electrical demand of the building, requiring an array of some 30 roof-mounted panels with a capacity of approximately 3 kWe. The graph shows that in this case the upper voltage constraints for the dwelling are frequently breached (this would also be true for any other dwellings connected to that portion of the network).
The more detailed modelling approach demonstrated here, which balances the quantitative and qualitative aspects of demand/supply matching, illustrates that detailed simulation can highlight potential operational problems from local generation schemes emerging from sizing studies. Whilst this example has considered PV and small scale wind and their effect on voltage, the approach has been demonstrated for other technologies such as heat pumps (Hong et al 2013) and other potential network interaction problems such as high current levels (breaching cable constraints), reverse power flow at the supply transformer and phase imbalances.
CONCLUSIONS
This paper has outlined a procedure to automatically size hybrid energy supply solutions at the community level. The approach is based on a search engine that processes all possible combinations of demand and supply profiles after the latter have been quantised. The feasibility of identified schemes may then be tested by simulation on the basis of an input model formed from pre-established prototypes. The approach was elaborated via an example application.
REFERENCES
Clarke J A (2001) ‘Domain integration in building simulation’, Energy and Buildings, V33(4), pp303-8.
Clarke J and Samuel A (2011). ‘Housing upgrades policy development’, Proc. eSim 2011, Halifax, Canada.
BRE (2009) Standard Assessment Procedure for Energy Rating of Dwellings. Building Research Establishment Publication.
EST (2006) ‘Creating a sustainable urban extension - a case study of Upton, Northampton’, Energy Saving Trust Report.
ESP-r (2013) www.strath.ac.uk?Programs/ESP-r.htm (viewed February 2013).
Hong J, Kelly N J, Thomson M and Richardson I (2013) ‘Assessing heat pumps as flexible load’,
J. Power and Energy, 227(1), pp1-13.
Kotsiantis S and Kanellopoulos D (2006). ‘Discretization Techniques: A recent survey’,
International Transactions on Computer Science and Engineering, 3 (1), pp.47-58.
Merit (2013)
www.strath.ac.uk/Programs/Merit.htm (Viewed February 2013).
Thomson M and Infield D (2007) ‘Impact of widespread photovoltaics generation on distribution systems’, J. Renewable Power Generation, (1), pp33-40.
Williamson T J (1994) ‘A confirmation technique for thermal performance simulation models’, University of Adelaide.
Figure 2: Upton Park Estate Demand profiles for heating (top) and electricity (bottom), for January (left) and June (right) weeks respectively.
Figure 3: Top 2 matches from the chunking process over a one month period.
0 1 2 3 4
0 100 200 300 400 500 600 700 800
P
o
w
e
r
(M
W
)
Time (hour)
0 1 2 3 4
0 100 200 300 400 500 600 700 800
P
o
w
e
r
(M
W
)
Figure 4: Voltage levels and power import/export for dwelling with hybrid supply.
Figure 5 voltage variation against power import and export (MERIT-sized system).
[image:6.595.75.486.508.680.2]