Phillips, Catriona and Brown, R.E. (2008) Eulerian simulation of the fluid
dynamics of helicopter brownout. In: 64th American Helicopter Society
Annual Forum, 2008-04-28 - 2008-05-01. ,
This version is available at
https://strathprints.strath.ac.uk/27501/
Strathprints is designed to allow users to access the research output of the University of Strathclyde. Unless otherwise explicitly stated on the manuscript, Copyright © and Moral Rights for the papers on this site are retained by the individual authors and/or other copyright owners. Please check the manuscript for details of any other licences that may have been applied. You may not engage in further distribution of the material for any profitmaking activities or any commercial gain. You may freely distribute both the url (https://strathprints.strath.ac.uk/) and the content of this paper for research or private study, educational, or not-for-profit purposes without prior permission or charge.
Any correspondence concerning this service should be sent to the Strathprints administrator:
The Strathprints institutional repository (https://strathprints.strath.ac.uk) is a digital archive of University of Strathclyde research outputs. It has been developed to disseminate open access research outputs, expose data about those outputs, and enable the
Phillips, C. and Brown, R.E. (2008) Eulerian simulation of the fluid dynamics of helicopter brownout. In:
64th American Helicopter Society Annual Forum, 28 April - 1 May 2008, Montral, Canada.
http://strathprints.strath.ac.uk/
27501
/
Strathprints is designed to allow users to access the research output of the University of
Strathclyde. Copyright © and Moral Rights for the papers on this site are retained by the
individual authors and/or other copyright owners. You may not engage in further
distribution of the material for any profitmaking activities or any commercial gain. You
may freely distribute both the url (
http://strathprints.strath.ac.uk
) and the content of this
paper for research or study, educational, or not-for-profit purposes without prior
permission or charge. You may freely distribute the url (
http://strathprints.strath.ac.uk
)
of the Strathprints website.
Eulerian Simulation of the Fluid Dynamics of Helicopter Brownout
Catriona Phillips∗
Richard E. Brown
[email protected] [email protected]
Department of Aerospace Engineering, University of Glasgow Glasgow G12 8QQ, United Kingdom
Abstract
A computational model is presented that can be used to simulate the development of the dust cloud that can be entrained into the air when a helicopter is operated close to the ground in desert or dusty conditions. The physics of this problem, and the associated pathological condition known as ‘brownout’ where the pilot loses situational awareness as a result of his vision being occluded by dust suspended in the flow around the helicopter, is acknowledged to be very complex. The approach advocated here involves an approximation to the full dynamics of the coupled particulate-air system. Away from the ground, the model assumes that the suspended particles remain in near equilibrium under the action of aerodynamic forces. Close to the ground, this model is replaced by an algebraic sublayer model for the saltation and entrainment process. The origin of the model in the statistical mechanics of a distribution of particles governed by aerodynamic forces allows the validity of the method to be evaluated in context by comparing the physical properties of the suspended particulates to the local properties of the flow field surrounding the helicopter. The model applies in the Eulerian frame of reference of most conventional Computational Fluid Dynamics codes and has been coupled with Brown’s Vorticity Transport Model. Verification of the predictions of the coupled model against experimental data for particulate entrainment and transport in the flow around a model rotor are encouraging. An application of the coupled model to analyzing the differences in the geometry and extent of the dust clouds that are produced by single main rotor and tandem-rotor configurations as they decelerate to land has shown that the location of the ground vortex and the size of any regions of recirculatory flow, should they exist, play a primary role in governing the extent of the dust cloud that is created by the helicopter.
Nomenclature
d particle diameter
F drag force on particle
g acceleration due to gravity
m particle mass
Sω = source of vorticity
Sp source of particulates
t time
u velocity of particle relative to air
µ advance ratio
µ⋆ thrust normalized advance ratio
ν fluid viscosity
νp particle diffusion constant
ρ air density
ρp local density of particulates in air
ρs material density of particles
ς ‘species’ of particle
∗Presented at the American Helicopter Society 64th Annual Forum,
Montr´eal, Canada, April 29 - May 1, 2008. Copyright c°2008 by the American Helicopter Society International,Inc. All rights reserved.
υ local flow velocity
υt threshold velocity
υb local on-blade velocity
υg fallout velocity due to gravity
υp particle velocity
ω vorticity
ωb blade bound vorticity
Introduction
con-dition known as ‘brownout’ where the pilot loses situa-tional awareness. Although it is unlikely that any rem-edy for the operational effects of brownout will be en-tirely aerodynamic in origin, there is the strong possibility that an improved understanding of the fluid dynamics of brownout may lead to measures that might ameliorate its effects. Indeed, some recent reports have claimed that the specifics of rotor geometry may have significant impact on the spatial extent and rate of formation of the dust cloud as brownout conditions develop in the airflow surrounding the helicopter.
Perhaps not surprisingly, given the recency of the events that have promoted a resurgence of interest in the brownout phenomenon, very little work has been published to date that investigates in any detail the governing physics behind its onset. Although a fairly large number of works exist that detail both observational and theoretical studies of the transport of particulate matter by air or water, this literature has originated primarily from within the field of riverine and aeolian sedimentology. A large body of information and a number of empirical models do exist for the behavior of particulate matter suspended in water and air, but these models have generally been derived for flows found in na-ture where the fluid length- and time-scales are somewhat different to those associated with flow conditions in the he-licopter wake. In the hehe-licopter context, very limited exper-imental data exists and, although some significant progress has been made, it is fair to say that modeling of brownout and its development is still in its infancy. Indeed, in the he-licopter context, much remains to be understood at a very fundamental level.
Currently most approaches to the modeling of brownout have been formulated in the particle-fixed Lagrangian frame of reference. In this approach, the dynamics of a (very large) number of individual dust particles is tracked as they are carried along in the air-flow that is generated by the helicopter. The properties of the resultant dust cloud are then inferred from the behavior of this representative set of particles. Previous work in this vein includes that of Keller et al. (Ref. 1) and Leishman’s group at the Uni-versity of Maryland. Good qualitative results are possible using the Lagrangian approach, but the detailed dynamics of a very large number of particles need to be modeled if an accurate measure of the prime variable influencing brownout, i.e. the distribution of dust density within the flow around the helicopter, is to be obtained. The compu-tational requirements of the Lagrangian approach can be-come very large and the formal accuracy of its predictions can be difficult to quantify rigorously. CFD-type methods for the rotor flow itself are generally formulated in the Eule-rian, i.e. helicopter- or ground-fixed frame of reference. A very much more convenient representation of the brownout problem would thus result from modeling the dynamics of the particulate distribution in the air surrounding the he-licopter using an Eulerian approach where the evolution
of the dust density distribution is calculated directly using suitable transport equations.
Given the importance of aerodynamic forces in govern-ing the trajectory of the particles through the air, a formal-ism that relies on a coupled system of mass and momentum transport equations to encapsulate the behavior of the fluid, and any particulate matter suspended within it, would seem to yield the most logical and physically complete approach to modeling the dynamics of brownout. The ‘multi-phase’ formalism that is required to implement this approach is relatively well developed within the chemical processing industry, for instance (see Ref. 2). In applying this ap-proach in its full rigor to the brownout problem there is the distinct possibility though that the parameters that are re-quired to characterize the interactions between the various particulates, and the particulates and the air, may in fact be unknown or only amenable to crude estimation – especially given the diversity of particle sizes and types that are in-volved. Arguably, a model that contains too many free pa-rameters is of little use from an engineering perspective in any case because of the lack of robustness of its predictions to variation in its parameters (the Occam’s Hill scenario de-scribed by Leishman in Ref. 3). There is thus considerable merit, particularly at our present level of understanding of the brownout phenomenon, in developing a robust model with as few free parameters as possible in order to reduce the sensitivity of predictions to errors in capturing the fine details of the behavior of the particulates during the forma-tion of the brownout cloud.
In this vein, Ryerson et al. (Ref. 4) have produced a model for the dynamics of the dust cloud that uses a two-phase mass transport equation to represent the suspended particulate matter as one of two co-existing but continuous fluid phases within the flow around the helicopter. The sus-pended particulate matter is assumed to be convected at the local velocity of the air, offset by a fallout velocity to ac-count for the effects of gravity. Such an approach has the advantage of forgoing any explicit accounting for the mo-mentum interchange between the fluid and the suspended particulate matter, and hence any requirement for explicit characterization of the interactions within the system, but must thus necessarily involve some approximation to the dynamics of the suspended particulate matter. The limits to the applicability of the simplified mass-transport approach in the context of brownout modeling has yet to be rigor-ously explored, however.
ref-erence. The model that results from the analysis is similar in structure to the mass transport equations of Ryerson et al. (Ref. 4), but the foundation of the model in the aero-dynamic behavior of the individual particles that constitute the cloud of suspended matter allows the validity of the ap-proach to be estimated directly in terms of the properties of the flow in the wake of the helicopter.
An extension of Brown’s Vorticity Transport Model (VTM) (Refs. 5, 6) that includes this model for the entrain-ment and transport of particulates is then described in some detail. One of the main benefits of using the VTM to sup-port the particulate transsup-port model is that a particularly ef-ficient computational formulation of the brownout problem can be obtained due to the similarities between the Eule-rian formulation of the particle transport equation and the vorticity transport equation.
Given the extraordinary complexity of the physics in the ground layer, it proves impossible – given the current state of knowledge – not to introduce a fairly large element of semi-empiricism into any self-contained model that is ca-pable of predicting the dynamics of particulate flows that are driven by the interaction of the helicopter wake with the ground. Various insights into the dynamics of particu-late motion along the ground and the entrainment of parti-cles into the air-flow are borrowed from the environmental fluid dynamics community to construct the various semi-empirical constituents of the brownout model that is de-scribed in this paper. Further analysis and verification will reveal if the particular selection of empirical models de-scribed here is the most appropriate for the modeling of the onset and development of brownout conditions surrounding the helicopter. Notwithstanding, the resultant model is used to simulate the evolution of the dust cloud that is gener-ated by two coupled rotor-fuselage configurations in strong ground effect – one representing a conventional helicopter with a single main rotor and the other a tandem configura-tion – when operated at low altitude above a dusty surface. These initial computations illustrate the capabilities of the model and, indeed, reveal some significant differences be-tween the dust cloud that is generated by these two configu-rations. These differences are, to a large degree, consistent with anecdotal evidence.
Vorticity Transport Model
A model for the transport of particulates in the air flow sur-rounding the helicopter has been integrated into Brown’s Vorticity Transport Model (Refs. 5, 6). The VTM is a finite-volume method that calculates the evolution of the vorticity distribution on a structured computational mesh surround-ing the rotorcraft by evolvsurround-ing the solution to the vorticity-velocity form of the incompressible Navier-Stokes equa-tion,
∂
∂tω+υ· ∇ω−ω· ∇υ=Sω+ν∇ 2ω
(1)
through time. The velocity with which the vorticity is con-vected through the flow is related to the vorticity by the differential form of the Biot-Savart relationship,
∇2υ=−∇ ×ω (2)
The vorticity source,Sω, arises in the shed and trailed vor-ticity from the lifting surfaces immersed within the flow, and can be written as
Sω=−d
dtωb+υb∇ ·ωb (3)
whereωb is the bound vorticity associated with each sur-face.
Particle Transport Model
In the Lagrangian frame of reference, the dynamics of a single particle (with massm) is given by Newton’s second law
mdυp
dt =F (4)
whereF is the force applied to the particle. If gravity and aerodynamic drag are assumed to be the dominant forces acting on the particle, then Rayleigh’s expression
F(u) =−1
2ρ|u|u
πd2
4 CD+mg (5)
is often used to describe the force applied to a particle with diameterd, whereu =υp−υ is the particle velocityυp relative to the air velocityυ. The drag coefficientCD of the particle is generally also a function of u(i.e. of the particle Reynolds numberRe) and for very small particles
CD= 24/Reyields a result that is consistent with Stokes’s well-known expression
F(u) =−3πρνud+mg (6)
for a sphere moving through a viscous fluid.
To derive the equation that governs the transport of a large number of suspended particles in the ground or helicopter-fixed Eulerian frame of reference, the most ro-bust approach results from adopting the formalism of clas-sical statistical mechanics. Let the spectrum of particles present in the flow be defined by some (continuous) vari-ableς representing the ‘species’ of any particle as distin-guished by its mass, size or other relevant physical char-acteristics. Define the particle probability density function Φ(x, v, ς, t)so thatΦ(x, v, ς, t)∆x∆v∆ςis the probability of finding a particle of species within the range∆ς contain-ingς, traveling with velocity within the range∆v contain-ingv, within the region of space∆xsurroundingxat time
accounted for) and so that the reaction of the particles on the air can be neglected. Assume also that the particles do not break up or coalesce (so that the species distribution of the particles does not change with time). Newton’s second law can then be expressed in terms of the evolution of the particle probability density function as
Φ(x+v∆t, v+F∆t/m, ς, t+ ∆t) = Φ(x, v, ς, t) (7)
where F(x, v, m) is the force experienced by a particle with massm(ς)and velocityvtraveling through the point
x(and hence is given by Eq. 4). In the infinitesimal limit ∆t→dt, this expression reduces to the Liouville equation
(∂/∂t+v· ∇+F/m· ∇v) Φ(x, v, ς, t) = 0 (8)
For the purposes of predicting brownout, the assumption is then made that the evolution of the particle distribution is governed by two physical processes that have highly dis-parate timescales. Specifically, it is assumed that the con-vective motion of the particles as they are carried along with the air flow is slow compared to the acceleration of the particles in response to any imbalance in the forces act-ing upon them, or, in other words, if u˙ 6= 0, u˙ ≫ υ˙ no matter what the acceleration of the flowυ˙. Given the struc-ture of Eq. 5 or Eq. 6 this assumption implies that the par-ticles will remain in near-equilibrium under the action of the aerodynamic forces that are generated by the particle as they move relative to the air (i.e. the dynamics of any in-dividual particle is such that the net forceF acting on any particle remains small). This near-equilibrium assumption is justified below in the context of the typical particle sizes involved in creating the dust cloud that is responsible for brownout.
From either Eq. 5 or Eq. 6, exact equilibrium in the La-grangian sense implies thatυp =υ−υg, whereυg is the ‘fallout velocity’ of the particle due to gravity. In the Eule-rian frame of reference, the assumption of near-equilibrium allows Eq. 8 to be factored into a ‘fast’ equation
(∂/∂t+F/m· ∇v) Φ(x, v, ς, t) = 0 (9)
and a ‘slow’ equation
(∂/∂t+v· ∇) Φ(x, v, ς, t) = 0 (10)
The solution to the fast equation can easily be shown to be a particle probability density function that concentrates ever more closely on the equilibrium Lagrangian particle velocityυp=υ−υgas time proceeds1.
The number density of particles at pointxin the flow with species within the bandΣ = [ς−
, . . . , ς, . . . , ς+]can be obtained from the particle probability distribution
func-1That is, ast→ ∞,Φ(x, v, ς, t)→0for allv6=υ
p.
tion as
ρp(x,Σ, t) = Z ∞
−∞
Z ς+
ς−
Φ(x, v, ς, t)dςdv
≡
Z
Σ,v
Φ(x, v, ς, t)dςdv (11)
Applying this operator to the slow component, Eq. 10, of the Liouville equation gives
Z
Σ,v
(∂/∂t+v· ∇) Φdςdv= 0 (12)
which can be expanded as
∂ ∂t
Z
Σ,v
Φdςdv+ Z
Σ,v
(v· ∇Φ)dςdv= 0 (13)
From Eq. 11 the first term in this expression is simply
∂ρp/∂t. By the Midpoint Theorem the second term can be written as
¯
v· ∇
Z
Σ,v
Φdςdv+
Z
Σ,v (v′
· ∇Φ)dςdv (14)
where the species-dependent ensemble velocity
¯
v(Σ) = R
Σ,vΦv dςdv R
Σ,vΦdςdv
(15)
Given the structure of the solution to the fast component of the Liouville equation, for a system of particles close to equilibrium, the Lagrangian equilibrium velocityυpfor particles with species ς is a very good approximation to ¯
v(Σ). This allows the first term of Eq. 14 to be interpreted as representing the convection of the particle distribution by the air flow under conditions of force equilibrium. The second, ‘residual’ term then represents the transport of par-ticles due to non-equilibrium of the system (i.e. due to scat-ter of the particle velocities about their equilibrium values). This second term can be modeled in various ways. For in-stance, if a symmetric distribution of velocities about equi-librium is assumed, then this term can be represented as an isotropic diffusion termνp∇2ρp (but where the diffusion coefficient is species-dependent, ieνp = νp(Σ)). Alter-natively, a more sophisticated non-isotropic model can be adopted to capture the skew of the particle velocity distri-bution about equilibrium, for instance by including a de-pendence on vorticity gradients in the flow to model the centrifugal spin-out of particles from vortex cores.
Thus the transport equation for the particulates within the species bandΣcan be written as
∂
∂tρp + (υ+υg)· ∇ρp=Sp+νp∇ 2ρ
p
where the source term Sp(Σ) is introduced to allow the addition of particulates into the flow by entrainment from the ground. The assumption of the absence of collisions between particles allows any significant variations in the physical properties of the particulate matter within the flow to be accommodated by grouping the particulates into a number of species bands Σ1, . . . ,ΣN and solving an in-dependent transport equation for each band.
Particle Equilibrium
For the equations derived above to yield an adequate de-scription of particulate transport under brownout condi-tions, it remains to justify the principal underlying assump-tion of the analysis that the airborne particulates that are responsible for brownout conditions exist in a state of near-equilibrium with the aerodynamic and gravitational forces that act upon them. Newton’s equation, Eq. 4, can be re-cast in terms of the relative velocity between fluid and par-ticle as
˙
u+F(u)/m= ˙υ (17)
Consider the special case in the absence of gravity, so that particle force equilibrium is attained whenu = 0. If the conditionu˙ ≫υ˙for near-equilibrium of the particles does apply whenu˙ 6= 0, then, for instance given Stokes’s drag law (similar results can be derived for other drag models),
u≈υ/˙ Γ (18)
is an approximate solution to Eq. 17, where the particle ‘drag to mass ratio’ (the reciprocal of the ‘particle veloc-ity response time’ used commonly in the multi-phase fluid dynamics literature)
Γ = 18ρ
ρs
ν
d2 (19)
The relative local deviation of the particle dynamics from equilibrium is thus small ifuis small relative toυ, in other words ifΓ ≫ |υ˙|/|υ|, that is, if the drag to mass ratio of the particles is large compared to the local acceleration of the flow (scaled by the local velocity of the flow) in the Lagrangian, or particle, frame of reference.
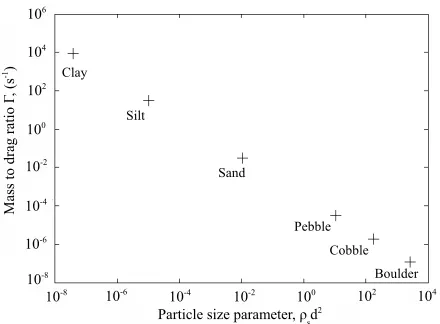
Figure 1 shows typical values for the particle drag-to-mass ratio Γ (assuming the particle drag to be given by Stokes’s law – note that this model under-estimates the aerodynamic drag of large particles) as a function of the particle size parameterρsd2for the variety of different par-ticle types that might constitute the ground surface below the helicopter.
[image:7.595.321.541.64.226.2]For comparison, Fig. 2 shows a typical distribution of the Lagrangian acceleration parameter |υ˙|/|υ| within the flow in the wake below an isolated helicopter rotor operat-ing in strong ground effect, as predicted usoperat-ing the VTM. In this example the rotor is flying 0.68 radii above the ground at an advance ratio of 0.05. The data is scaled
Figure 1: Particle drag to mass ratios for various sizes of particle commonly encountered in the desert environment.
to be representative of a helicopter in the same class as a UH-60 Blackhawk. The Lagrangian acceleration parame-ter is calculated from the Eulerian velocity distribution in the flow surrounding the helicopter according to the equiv-alenceυ˙ =∂υ/∂t+υ· ∇υ. It is important to bear in mind when analyzing this figure that the finite resolution of the computation results in any local maxima in the Lagrangian acceleration parameter being under-estimated, as any non-resolved finer structures in the flow will contribute signifi-cantly to the local acceleration through the termυ· ∇υ.
prob-(a)
[image:8.595.136.474.68.422.2](b)
Figure 2: Snap-shots of the instantaneous flow properties on a vertical slice through the centerline of an isolated rotor
flying at 0.68R above the ground at an advance ratio of 0.05 (CT = 0.0048). (a) Contour plot of vorticity
magni-tude, showing the rotor to be in the ground vortex regime. (b) Plot showing the resultant distribution of the Lagrangian
acceleration parameter|υ˙|/|υ|in the rotor wake (data scaled for a Blackhawk-sized aircraft).
lem using the particulate transport equations derived above, remains well-founded throughout most of the flow sur-rounding the helicopter – with perhaps the exception being near the cores of the individual vortices that constitute the rotor wake, and very close to the rotor itself.
Particle Entrainment Model
The source term Sp in the particle transport equation ac-counts for the entrainment of particulates from the ground into the airflow. In the context of brownout modeling, the model for the source term provides essentially a ‘sublayer’-type description that captures the essence of the complex physics that takes place within the few inches of fluid just above the ground. In much the same fashion as a boundary layer model matches the viscous, possibly turbulent char-acteristics of the flow near the surface to a simplified model that approximates the fluid behavior away from the surface,
the model for the particulate sourceSpis used to represent the effect of the physics in the sublayer on the dynamics of the particulate distribution in the flow away from the surface. In particular, within the sublayer the particulate density can be high and the collisions between particles may assume fundamental importance – in direct variance with the assumptions made earlier in deriving the particu-late transport equations.
The physics of particle entrainment into the flow is thus very complex. Direct modeling of the dynamics of saltating particles is well beyond the present state of the art, but there exists a number of empirical models for the saltation pro-cess that are able to take into account various factors such as surface roughness, soil moisture and soil crusting. Mod-els of this complexity may be useful in capturing the de-tailed behavior of the ground surface in specific geograph-ical areas, but in the present work a simpler semi-empirgeograph-ical model,
υt= 1 κ s a1 µρ s
ρgd+ a2 ρd
(20)
that represents the threshold velocity for flow over dry, loose soil surfaces is used. On the basis of wind tunnel measurements by Lu and Shao (Ref. 8), the coefficientsa1 anda2are approximately 0.0123 and3×10−4kgs−2 re-spectively. The factorκaccounts for the presence of sur-face roughness elements. Many different roughness ele-ments can be present in an actual desert environment but to simplify the model only one type is considered in the cal-culations presented in this paper. It is assumed simply that there are fragments of rock present that armor the surface and inhibit the entrainment of particulates into the flow. According to MacKinnon (Ref. 9), the value ofκfor this type of surface is0.44. For simplicity, the results presented in this paper were generated after adopting a single repre-sentative value of saltating particle diameterdand density
ρs, and hence a uniform threshold velocity over the entire ground surface is assumed.
The overall source of particulate matter into the flow is dependent on the flux of saltating particles along the ground. The saltation or horizontal particle flux,Q, is de-termined using the theory of White (Ref. 10) where the hor-izontal particle flux is related to the flow velocity υ just above the surface by
Q=Ecυ3ρ g
³ 1−υt
υ
´µ 1 + υ
2 t
υ2 
(21)
whereυtis the threshold velocity calculated from Eq. 20. Empirically, c = 0.261, andE is the ratio of erodible to total surface area, taken for simplicity to be unity in the calculations presented in this paper.
The particle flux from the surface into the airflow above the surface then consists of those dust particles that are re-leased from the saltation process and remain in suspension in the air above the ground. The ratio of the particle flux into the air to the saltation flux is dependent on the per-centage of clay within the soil. In the current model, the empirical relationship
Sp=Q e13.4f
−6.0
(22)
described in Ref. 7 is used to relate the sourceSp of par-ticulate matter into the flow to the saltation flux. This
re-lationship applies for soils with clay fraction f less than 0.2; all results presented in this paper were generated using
f = 0.1.
Particle Fallout Model
The fallout velocityυgin Eq. 16 accounts for the tendency of suspended particulate matter to settle out from the flow under the influence of gravity. The model that was used to calculate the fallout velocity for the calculations pre-sented in this paper is based on the work by Cheng (Ref. 11) which extends Stokes’s solution for the settling velocity of spherical particles to allow it to be used when the particle Reynolds number is greater than one. The dimensionless particle diameter,d⋆, is first defined as
d⋆=d µgb
ν2 ¶(1/3)
(23)
whereb= (ρs−ρ)ρ. The fallout velocity of the particles is then given by
υg=
ν d
³p
25 + 1.2d2 ⋆−5
´1.5
(24)
Computational Implementation
There are obvious similarities between the mathematical form of the vorticity transport equation, Eq. 1, and the par-ticulate transport equation, Eq. 16. Both equations (when taken at face value) represent the passive advection of some quantity by a background velocity field, and allow for a lo-calized source of the advected quantity. In the case of the vorticity transport equation an additional stretching term appears simply to account for the fact that the advected quantity (the vorticity) is fundamentally vectorial in nature rather than scalar as in the case of the particulate density. The similarity in structure between the two transport equa-tions allows the procedure that is used within the VTM to calculate the evolution of the vorticity within the flow sim-ply to be generalized slightly if the combined evolution of the flow and particulate density is to be calculated. For the combined particulate-vorticity transport model, define the vector of conserved variables Ω(x, t) = (ω, ρ1
p, . . . , ρNp) whereρi
p(x, t)is the local density of particles in species band Σi at time t. The object-oriented structure of the VTM allows the augmented vector Ωof conserved vari-ables simply to be defined as a generalized form of the vec-tor of conserved quantitiesωthat is used by the original, fluid-only version of the code. The VTM uses an operator-splitting approach to evolve the equations of motion for the coupled system. The source ofΩinto the computational domain is first calculated by evolving the equation
∂
over time ∆t, using the initial condition Ω(x, t)to yield the intermediate solution Ω∗
(x). The combined particu-late / vorticity sourceS = (Sω, Sp1, . . . , SpN)is constructed using the appropriate physical model for each component. The advection equation
∂
∂tΩ +V · ∇Ω = 0 (26)
is then advanced through∆t, usingΩ∗
as initial condition, to yield the revised intermediate solutionΩ∗∗
. The advec-tion velocityV = (υ, υ+υg), and the operatora· ∇bis over-loaded so that(a, b)· ∇(c, d)≡(a· ∇c, b· ∇d). This part of the calculation is performed using Toro’s Weighted Average Flux method (Ref. 12) which allows tight control to be maintained over any spurious diffusion of vorticity or particulate density from cell to cell as a result of numerical truncation errors.
Finally the vorticity distribution is corrected for the ef-fects of stretching by advancing the solution to
∂
∂tω−ω· ∇υ= 0 (27)
through∆tusing Runge-Kutta integration, and initial con-ditions ω∗∗
to obtain the solution ω∗∗∗
. The vector
(ω∗∗∗
, ρ1∗∗
s , . . . , ρN
∗∗
s )is then a second-order approxima-tion toΩ(x, t+∆t)as long asΩ∗
andΩ∗∗
are both second-order accurate approximations to the solutions of their own differential equations (Ref. 5). The process is then repeated for subsequent timesteps. The similarity of this approach to that used by the fluid-only version of the VTM can be assessed by comparing this sequence of operations to that described in Ref. 5.
In the calculations presented in this paper, no non-equilibrium processes were accounted for, but these could be included in the calculation through an additional step that has similar form to that used to evolve the solution to Eq. 25.
Verification of Ground Effect Predictions
An important pre-requisite to the correct modeling of brownout is that the flow field generated by the rotor-craft in ground effect should itself be modeled accurately. This is no trivial requirement. A number of theoretical studies of ground effect, focusing particularly on thrust and power requirements at various rotor heights above the ground, have been published. Betz (Ref. 13) and Knight and Hefner (Ref. 14) for example showed that the power required to maintain a constant thrust reduces in ground ef-fect and that the efef-fect of the ground reduces significantly at heights above one rotor diameter. Cheeseman and Ben-nett (Ref. 15) reported on the effects of the ground during forward flight, showing that the power required to main-tain a constant thrust increases with increasing forward
speed. Hayden (Ref. 16) provides a comprehensive review of power and thrust requirements for a range of helicopters hovering in ground effect that were obtained from flight test data and confirms that the greatest effect of the ground is felt at a height of less than one rotor diameter.
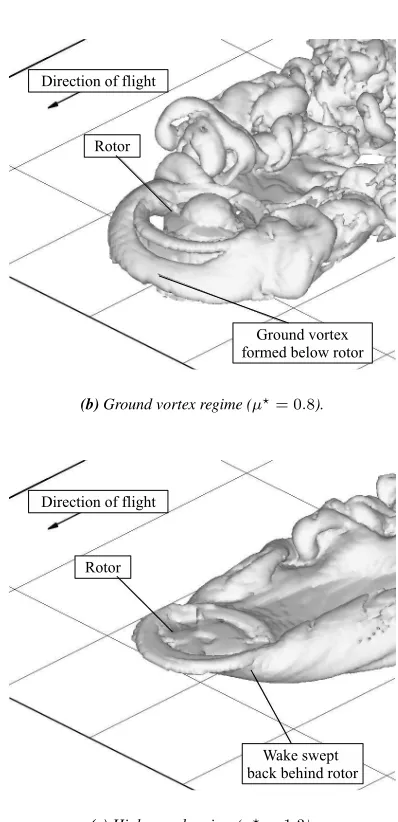
Most importantly in the present context, the experimen-tal work of Sheridan and Wiesner (Ref. 17) and Curtiss et al. (Refs. 18, 19) has shown that the rotor wake ex-ists in a number of distinct states, depending on the thrust-normalized advance ratio
µ⋆= µ p
(CT/2)
(28)
and height of the rotor above the ground. In hover, the wake is distorted significantly by the presence of the ground, and, indeed, at very low forward flight speed, the wake can be recirculated erratically through the front of the rotor. At in-termediate forward speeds, the wake changes structure and a stable, bow-shaped ground vortex forms beneath the ro-tor. As the system is accelerated further, the ground vortex is swept downstream and the effect of the ground on the performance of the rotor reduces dramatically as the rotor accelerates over a narrow range of flight speeds. This char-acteristic behavior, and its dependence on aircraft geometry and flight condition, must be captured accurately in order for the dynamics of the sand cloud that is associated with the development of brownout to be modeled correctly.
The main impediment to accurate modeling of the flow that is induced by the rotor when in ground effect is that the dominant flow structures grow and evolve over very long time-scales. Simulations must thus resolve the wake accurately over many rotor revolutions in order to yield a valid portrayal of the governing fluid mechanics. As an ex-ample, Fig. 3 shows how approximately twenty five rotor revolutions have to elapse from the start of any simulation before the transients within the calculation dissipate, the system settles into its true long-term behavior, and the low-frequency unsteadiness in the power that is characteristic of the rotor dynamics when in ground effect is revealed. The VTM has been shown to be capable of conserving the wake structure almost indefinitely which gives the model an important advantage in being able to capture the slowly-evolving features of the flow that dominate the behavior of the system when in strong ground effect.
0 20 40 60 80 100 120 140 −0.5
0 0.5 1 1.5 2 2.5 3 3.5x 10
−4
Rotor Revolutions
P
o
w
er
co
effi
ci
en
[image:11.595.89.281.66.231.2]t
Figure 3: Example calculation showing the number of ro-tor revolutions that need to be simulated if roro-tor behav-ior IGE is to be captured accurately. Induced power
re-quired for a rotor hovering at 1.27R above the ground.
(CT = 0.0046).
until it is eventually swept downstream to yield the wake geometry shown in Fig.4(c). The changes in computed wake geometry with forward speed are entirely consistent with the existence of the various flow regimes that were revealed in the experimental data of Curtiss et al. (Ref. 18). As a more quantitative verification of the VTM, Fig. 5 shows a comparison between VTM predictions, various empirical correlations and the flight test data for the AH-1G collected by Hayden (Ref. 16) for the power required by a rotor to hover in ground effect at constant thrust. The VTM captures well the experimentally-observed decrease in the effect of the ground on the power required to hover as the height of the rotor above the ground is increased.
A detailed analysis of the changes in wake structure and the associated perturbations to rotor trim that are predicted by the VTM as a function of forward speed and height above the ground is presented by Brown and Whitehouse (Ref. 20). Taken together with the results presented in Figs. 4 and 5, these results illustrate the ability of the VTM to re-produce both the qualitative and quantitative aspects of the flow field that is generated by a rotor in strong ground ef-fect.
Verification of Particulate Transport Predictions
To date, very limited experimental data is available that can be used directly to verify the predictions of numerical brownout models. A recent experimental study carried out at the University of Glasgow (Ref. 22) has allowed some confidence to be placed in the predictions of the VTM, however. The experiment involved placing fine particles on the floor of a wind tunnel below a small model rotor to
(a)Recirculation regime (µ⋆= 0.61).
(b)Ground vortex regime (µ⋆= 0.8).
(c)High-speed regime (µ⋆= 1
[image:11.595.329.528.271.682.2].3).
Figure 4:Rotor wake geometry at various forward speeds
0 0.5 1 1.5 2 2.5 3 0
0.1 0.2 0.3 0.4 0.5 0.6 0.7 0.8 0.9 1
h/R PI
G
E
/P
O
G
E
[image:12.595.335.526.68.411.2]Hayden empirical Cooke & Fitzpatrick empirical Knight & Hefner empirical Hayden flight test data VTM predicted power
Figure 5: Power required to hover IGE. VTM predictions compared to the flight test data and empirical correlations of Hayden (Ref. 16), Knight & Hefner (Ref. 14) and Cooke & Fitzpatrick (Ref. 21) for a rotor operating at various
heights above the ground (CT = 0.0046). Bars attached
to the VTM data represent the predicted root-mean-square of the power fluctuations produced by the rotor.
[image:12.595.81.276.73.230.2]simulate the dynamics of the dust particles that would be entrained into the flow around the rotor in a brownout situ-ation. The motion of the particles as they were transported through the flow surrounding the rotor was recorded using high-speed photography. Figures 6(a) and (b) show typical snapshots of the particle distribution in front of the model rotor when it was placed at one radius above the ground and the tunnel speed was set to represent a thrust-normalized advance ratio of 0.65. For comparison, Fig. 7 shows a rep-resentative snapshot of the particle density distribution in front of the rotor that is predicted by the VTM under similar flight conditions. The experiment reveals a wedge-shaped area in the flow some distance upstream of the rotor, termed the ‘separation zone’ by Nathan and Green (Ref. 22), in which the particle density is very high as a result of the ex-istence of a flow stagnation line in the mean flow on the surface below. Figure 7 shows the location and size of this zone to be represented well by the VTM. Figure 6(a) shows a significant proportion of the suspended particulate matter to be recirculated through the front of the rotor disk under the operating conditions of the experiment, but Fig. 6(b), captured at a later time during the same experiment, shows that clouds of particles that do not recirculate through the rotor are also ejected sporadically from the separation zone. Figure 7 shows both these characteristic features of the dy-namics of the dust cloud surrounding the rotor to be cap-tured by the VTM.
Although a more quantitative verification of the numeri-cal approach awaits further refinement of the experimental technique, the good qualitative agreement between the par-ticulate density distributions that are predicted by the VTM
(a)
(b)
Figure 6:Snapshots of the particulate distribution around a rotor during wind tunnel simulations of brownout. Blade tip visible at middle left. (a) Image showing the recircu-lation of fine particulates through the front of the disk and the existence of a well-defined ‘separation zone’ above the ground plane. (b) Image showing the escape of a cloud of particles from the main recirculatory flow. Images courtesy of Richard Green, University of Glasgow.
[image:12.595.329.530.548.659.2](a)Single main rotor configuration. (b)Tandem-rotor configuration.
Figure 8:Simulated helicopter geometries.
(a)Tandem-rotor configuration.
[image:13.595.94.271.262.532.2](b)Single main rotor configuration.
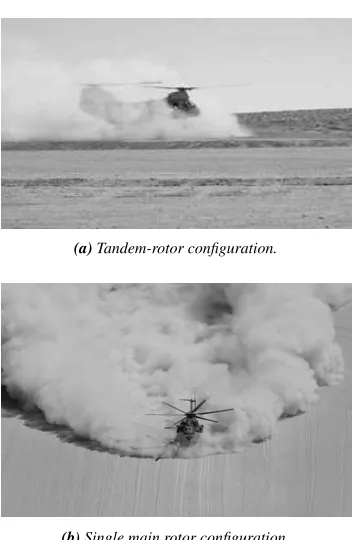
Figure 9: Dust distribution in the airflow surrounding a helicopter operating at low altitude in desert conditions. Images courtesy of U.S. Department of Defense.
and the distribution of particulates that were observed in this simple experiment suggests that the VTM is capable of producing credible simulations of the evolution of the dust cloud surrounding the helicopter under brownout con-ditions.
Simulation of Brownout Development
As an initial test of the capabilities of the approach, the coupled VTM-particulate transport model has been used to
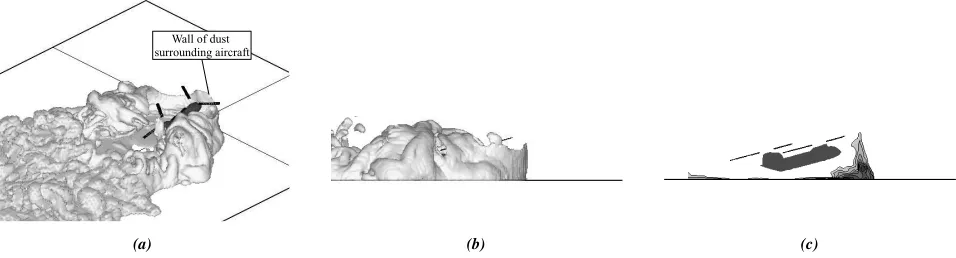
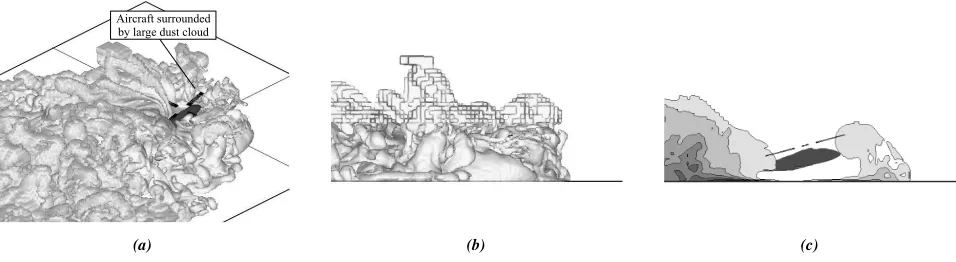
compare the geometry and extent of the dust cloud that is generated under brownout conditions by the two generic helicopters shown in Fig. 8. Anecdotal evidence suggests that, under practical conditions, brownout manifests rather differently for helicopters with a single main rotor, such as that shown at left in the figure, than for aircraft with the tandem-rotor configuration shown at right. In particular, the dust cloud generated by the rear rotor of the tandem configuration is thought to run forward during landing to eventually engulf the cockpit, whereas the dust cloud of the single rotor system is thought to originate somewhat further forward, upstream of the ground vortex, and to en-gulf the helicopter in more sudden fashion as the helicopter nears the ground. These observations are partially con-firmed by images, such as those shown in Fig. 9, of the dust clouds that are generated by the two different types of helicopter when flown at low level in dusty conditions. Al-though there are indeed likely to be very strong qualitative differences between the way that brownout conditions man-ifest for the two different rotor configurations, it should be borne in mind that simplistic descriptions and gross gener-alizations such as the one just given soon prove inadequate once the operating conditions and detailed geometry of the helicopter are considered in more detail. The geometry and extent of the helicopter-generated dust cloud appears to be strongly dependent, for instance, on how the aircraft is ma-neuvered over the ground as the dust cloud begins to form.
ad-(a) (b) (c)
Figure 10:VTM-predicted dust distribution surrounding a helicopter with single main rotor configuration (µ⋆= 0.80).
[image:14.595.66.543.247.380.2](a) (b) (c)
Figure 11:VTM-predicted dust distribution surrounding a helicopter with tandem-rotor configuration (µ⋆= 0.80).
vance ratio. In all cases the wake was resolved using 40 computational cells across the rotor diameter.
The helicopters were modeled with a nose-up pitch atti-tude of15◦
to represent the aircraft during the late stages of a landing maneuver. Somewhat unrealistically, this pitch attitude and also the rotor height above the ground was maintained throughout the maneuver. Given that the tra-jectory of the aircraft is thought to have such a strong influ-ence on the formation of the dust cloud, future efforts will be focused on extending the model to allow the dynamics of the vehicle above the ground to be represented in a more comprehensive fashion.
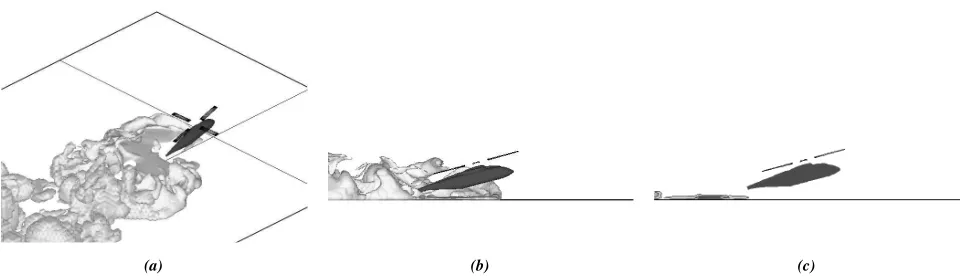
Figures 10 through 17 show the geometry of the dust cloud that is predicted by the VTM with the helicopters at various forward flight speeds during the simulated de-celeration to land. A three-dimensional view of the dust cloud is shown at left in each of these figures by plotting an iso-surface of dust density within the flow surrounding the helicopter. At center, the same iso-surface is represented, but from a side perspective so that the vertical extent of the dust cloud relative to the operating height of the helicopter can be appreciated. At right, contours of dust density on a vertical slice through the flow around the helicopter, on a plane that coincides with the centerline of the fuselage, are shown. These contour plots show the dust density in
the flow around the helicopter, averaged over 60 rotor rev-olutions to yield an appreciation of the most persistent fea-tures in the dust cloud. The minimum contour level repre-sented in the contour plots has the same value as the iso-surface value used to generate the 3-D plots. It is important to avoid contamination of the data by vortical or particu-late structures that arise simply in the initial conditions that were applied to the simulations and for this reason the fig-ures present the dust distributions in the flow around the helicopters at a time far enough into the simulations for the flow to have settled into its long-term behavior.
Figures 10 and 11 show the dust cloud that is created by the two configurations when flying at a relatively high forward speed above the ground. At the advance ratio
(a) (b) (c)
Figure 12:VTM-predicted dust distribution surrounding a helicopter with single main rotor configuration (µ⋆= 0.47).
[image:15.595.68.546.241.370.2](a) (b) (c)
Figure 13:VTM-predicted dust distribution surrounding a helicopter with tandem-rotor configuration (µ⋆= 0.47).
(a) (b) (c)
Figure 14:VTM-predicted dust distribution surrounding a helicopter with single main rotor configuration (µ⋆= 0.29).
(a) (b) (c)
[image:15.595.70.545.403.537.2] [image:15.595.68.548.575.705.2](a) (b) (c)
Figure 16:VTM-predicted dust distribution surrounding a helicopter with single main rotor configuration (µ⋆= 0.12).
[image:16.595.68.546.238.370.2](a) (b) (c)
Figure 17:VTM-predicted dust distribution surrounding a helicopter with tandem-rotor configuration (µ⋆= 0.12).
ground some distance behind the nose of the aircraft and extends outwards and downstream, following the location of the separation zone that forms along the forward edge of the ground vortex that is generated by the helicopter. The interaction between the wakes of the front and rear rotors of the tandem configuration appears to yield a more rear-wards location of the ground vortex and associated dust cloud than the single main rotor configuration under the same flight conditions.
The iso-surface plots of dust density show the single main rotor configuration to generate a distinctly asymmet-rical dust cloud (with a marked absence of dust to the right of the aircraft – the rotor of this helicopter was arranged to rotate anticlockwise when viewed from above). In compar-ison, the tandem-rotor configuration generates a dust cloud that spreads out symmetrically on both sides of the aircraft at this forward flight speed. Unfortunately the asymmetry of the dust cloud generated by the helicopter with single main rotor does not seem to persist to the very lowest for-ward flight speeds where it might be exploited practically to mitigate the effects of brownout.
To explain the asymmetry in the dust cloud, Fig. 18 com-pares the vorticity distribution to the corresponding dust distribution in the flow around the helicopter with single main rotor. For comparison, Fig. 19 shows similar plots for the tandem-rotor configuration. The iso-surface used to
represent the vorticity distribution has been chosen to re-veal the strongest vorticity that is present in the flow. The powerful, crescent-shaped ground vortex that lies below each helicopter is clearly shown, but the plot also reveals that, for the helicopter with a single main rotor, this struc-ture is significantly asymmetric. The core of the ground vortex remains significantly closer to the ground on the left-hand side of the aircraft than on the right as the helicopter moves forwards along the ground. The tandem-rotor heli-copter, on the other hand, generates a ground vortex that has a far more symmetric structure. Any asymmetry in the dust cloud is then explained by the clear correlation be-tween the region of maximum entrainment of dust into the air and the position and strength of the ground vortex that is evident on comparing parts (a), (b) and (c) of the figures.
(a)Vorticity distribution (viewed from below the ground plane).
(b)Vorticity distribution (viewed from the front of the helicopter).
[image:17.595.70.549.74.216.2](c)Dust density distribution.
Figure 18:Correlation between the vorticity distribution surrounding a helicopter with single main rotor and the regions
of maximum entrainment of dust into the flow. (µ⋆= 0.80).
(a)Vorticity distribution (viewed from below the ground plane).
(b)Vorticity distribution (viewed from the front of the helicopter).
(c)Dust density distribution.
Figure 19:Correlation between the vorticity distribution surrounding a tandem-rotor helicopter and the regions of
maxi-mum entrainment of dust into the flow. (µ⋆= 0.80).
and very close to the ground. Even where the dust is lifted into the flow, the resultant cloud remains relatively close to the ground. In contrast, the dust cloud forms very much closer to the tandem-rotor configuration and has significant vertical extent. Indeed, the plots of the averaged dust den-sity on the longitudinal slice through the flow show the wall of dust that forms in front of the aircraft with single main rotor to be diffuse and somewhat tenuous in comparison to the thick, persistent wall of dust that forms directly in front of the tandem-rotor aircraft at this forward speed.
Further deceleration of the helicopters results in a signif-icant enlargement of the dust cloud that surrounds the air-craft, particularly as the wake transitions from the ground vortex regime into the recirculatory regime. Figures 14 and 15 show the dust distribution in the flow with the aircraft travelling above the ground at advance ratioµ⋆= 0.29. At this advance ratio the rotors operate well within the recir-culatory flow regime. Nevertheless, a comparison of the averaged dust density on the longitudinal slice through the
flow shows the tandem-rotor configuration to continue to produce a dust cloud that is far larger and more persistent, and that extends significantly higher above the helicopter, than the cloud that is produced by the single main rotor configuration.
In similar vein to Figs. 18 and 19, Figs. 20 and 21 con-trast the vorticity and dust density distributions in the flow around the two helicopter configurations at this low for-ward speed. The much enlarged region of strong vorticity that forms in front of the helicopter with the rotors oper-ating in the recirculatory regime is principally responsible for transporting dust high into the air surrounding the heli-copter from its origin on the ground plane. The key role of the separation zone just forward of the recirculatory flow in limiting the forward extent of entrainment of dust from the ground, and hence in governing the overall size of the dust cloud, is clearly evident on comparing the vorticity and dust distributions within the flow.
[image:17.595.57.548.285.431.2]config-(a)Vorticity distribution. (b)Dust density distribution.
Figure 20:Correlation between the vorticity distribution surrounding a helicopter with single main rotor and the regions
of maximum entrainment of dust into the flow. (µ⋆= 0.29).
(a)Vorticity distribution. (b)Dust density distribution.
Figure 21:Correlation between the vorticity distribution surrounding a tandem-rotor helicopter and the regions of
maxi-mum entrainment of dust into the flow. (µ⋆= 0.29).
urations becoming engulfed in a large and persistent cloud of dust. Figures 16 and 17 show the predicted dust cloud around the aircraft when flying above the ground at very low forward speed (µ⋆ = 0.1174). Significant recircu-lation of dust through the rotor disks is clearly evident in both cases, and it is quite plausible that in practical circum-stances the density and persistence of the dust cloud might precipitate the onset of brownout conditions.
The results presented here thus reveal distinct differences in the geometry of the dust cloud that is formed by single main rotor and tandem-rotor configurations when operating at low altitude and forward speed above a dusty surface, and it appears that at least some of these differences can be related to the geometry of the vorticity distribution that is produced by the rotors as they interact aerodynamically with the ground surface.
Conclusion
This paper presents a computational model for simulating the development of the dust cloud that is associated with the
particulate matter that can be entrained into the air when a helicopter is operated close to the ground in desert or dusty conditions. The physics of this problem, and the associ-ated pathological condition known as ‘brownout’ where the pilot loses situational awareness as a result of his vision being occluded by dust suspended in the flow around the helicopter, is acknowledged to be very complex, and, in-deed, modeling of the brownout problem from first princi-ples poses many basic challenges.
[image:18.595.123.493.268.426.2]the air is modeled algebraically. As the state of the art ad-vances, it may indeed be possible to supplant this approach using a model that is based on a more fundamental physi-cal description, but certainly the extreme complexity of the physics within the dense layer of strongly interacting par-ticles close to the ground precludes this approach for the time being.
The advantage of the present approach is that the growth in the number of free parameters within the model is strongly curtailed – in fact, almost all of the tunable coef-ficients within the present implementation of the approach reside within the sublayer model itself. This should have distinct advantages for the reliability and robustness of the approach, and in many ways it can be argued that the model presented here may provide a more sensible, bal-anced and well-justified engineering approach to the anal-ysis and eventual understanding of the brownout problem than some descriptions of the problem that embody a more complete set of physical processes and effects.
Most computational codes are written in an Eulerian frame of reference, whereas the most obvious description of the dynamics of individual particles is in a Lagrangian frame of reference. Using the basic principles of statisti-cal mechanics, the Lagrangian and Eulerian descriptions of the problem can be reconciled, however. The advantage of such an analysis is that it provides an inherent method of quantifying its own assumptions – indeed, it has been shown how the validity of the method can be evaluated in context by comparing the spectrum of physical properties of the suspended particulates to the local properties of the flow field surrounding the helicopter.
The result is a particulate transport model that resides in the Eulerian frame of reference and that, because of its particular mathematical form, can be integrated in fairly straightforward manner into other models that describe the dynamics of the fluid in terms of the Eulerian transport of the fluid properties. The VTM helicopter simulation code is used here to host the particulate transport model, and, indeed, possesses particular advantages with respect to the computational implementation of the coupled fluid-particle model because of the very close similarities in structure be-tween the particulate transport equation and the vorticity transport equation.
Verification of the predictions of the method remains problematic at this early stage in investigations into the brownout phenomenon, however. A significant quantity of data resides within the environmental fluid dynamics com-munity, but it is not immediately obvious how relevant this data is given the rather different length and time-scales that are important within the flow field that is induced by a heli-copter flying close to the ground. This presents some con-cerns as to whether the choice of sublayer model used in the present study, based as it is on work conducted in the field of aeolian and riverine sediment transport, is entirely appropriate in the context of brownout modeling. Full
veri-fication of the approach awaits further developments in ex-perimental technique and the gathering of data that is di-rectly relevant to the brownout problem, but limited com-parisons against small-scale rotor experiments show en-couraging results.
An important pre-requisite of any model of brownout is the ability to capture the basic characteristics of the flow that is induced by the helicopter rotors when in strong ground effect; the VTM has been demonstrated to perform well in this respect. Particularly important in the present context appears to be the ability of the model to predict the transition of the wake generated by the helicopter between several characteristic states as the speed of the helicopter above the ground is varied. This is by no means a trivial task as it requires careful preservation of the vortical struc-tures in the wake for the many rotor revolutions that char-acterize the timescales over which the rotor-induced flow evolves in the presence of the ground.
An example application of the coupled VTM-particulate transport model to analyzing the differences in the geome-try and extent of the dust clouds that are produced by single main rotor and tandem-rotor configurations as they decel-erate to land has yielded some very interesting results. Al-though the simulations described here are based on a rather simplified representation of the helicopter landing maneu-ver, it appears, somewhat surprisingly, that relatively coarse features of the geometry and strength of the rotor wakes, in particular the location of the ground vortex and the size of any regions of recirculatory flow, should they exist, play a primary role in governing the extent of the dust cloud that is created by the helicopter.
Much work still remains to be done in conducting and dissecting simulations such as these to elucidate the key parameters that govern the evolution of the dust cloud that is generated by the aerodynamic interaction between the helicopters and the ground when these machines operate at low level in dusty environments. The results presented here represent perhaps a small step along the way to a suffi-cient practical understanding of how the physics of particle entrainment and transport within the flow around the heli-copter can precipitate the onset of brownout conditions, but hopefully they also provide some encouragement that the problem may eventually yield to careful engineering anal-ysis.
References
1 Keller, J.D., Whitehouse, G.R., Wachspress, D.A.,
Teske, M.E., and Quackenbush, T.R., “A Physics-Based Model of Rotorcraft Brownout for Flight Simulation Applications,” 62nd Annual Forum of the American Helicopter Society, Phoenix, AZ, May 2006.
2 Crowe, C.T., Ed., Multiphase Flow Handbook, CRC
Press, Boca Raton, FL, 2006.
Looking Back, College Park Press, College Park, MD, 2007.
4 Ryerson, C.C., Hachnel, R.B., Koenig, G.G., and
Moulton, M.A., “Visibility Enhancement in Rotorwash Clouds,” 43rd AIAA Aerospace Sciences Meeting and Exhibit, Reno, Nevada, Jan 2005.
5 Brown, R.E., “Rotor Wake Modeling for Flight
Dy-namic Simulation of Helicopters,” AIAA Journal, Vol. 38 (1), January 2000, pp. 57–63.
6 Brown, R.E. and Line, A.J., “Efficient High-Resolution
Wake Modeling Using the Vorticity Transport Equa-tion,”AIAA Journal, Vol. 43 (7), July 2005, pp. 1434– 1443.
7 Marticorena, B. and Bergametti, G., “Modeling the
At-mospheric Dust Cycle: 1. Design of a soil-derived dust emission scheme,” Journal of Geophysical Research, Vol. 100 (D8), August 1995, pp. 16415–16430. 8 Lu, H. and Shao, Y., “Toward Quantitative Prediction
of Dust Storms: An Integrated Wind Erosion Modelling System and its Applications,”Environmental Modelling
and Software, Vol. 16 (3), April 2001, pp. 233–249.
9 MacKinnon, D.J., Clow, G.D., Tigges, R.K., Reynolds,
R.L., and Chavez, P.S. Jr., “Comparison of Aerodynam-ically and Model-derived Roughness Lengths (Zo) Over Diverse Surfaces, Central Mojave Desert, California, USA,”Geomorphology, Vol. 63 (1–2), November 2004, pp. 103–113.
10 White, B.R., “Soil Transport by Winds on Mars,”
Jour-nal of Geophysical Research, Vol. 84 (B9), August
1979, pp. 4643–4651.
11 Cheng, N.-S., “Simplified Settling Velocity Formula for
Sediment Particle,”Journal of Hydraulic Engineering, Vol. 123 (2), February 1997, pp. 149–152.
12 Toro, E.F., “A Weighted Average Flux Method for
Hy-perbolic Conservation Laws,”Proceedings of the Royal Society of London, Series A: Mathematical and
Physi-cal Sciences, Vol. 423 (1864), 1989, pp. 401–418.
13 Betz, A., “The ground Effect on Lifting Propellers,”
Tech. Rep. NACA TM 836, August 1937.
14 Knight, M. and Hefner, R.A., “Analysis of Ground
Ef-fect on the Lifting Airscrew,” Tech. Rep. NACA TN 835, 1941.
15 Cheeseman, I.C. and Bennett, W.E., “The Effect of the
Ground on a Helicopter Rotor in Forward Flight,” Tech. Rep. ARC R & M 3021, Aeronautical Research Coun-cil, 1957.
16 Hayden, J.S., “The Effect of the Ground on Helicopter
Hovering Power Required,” 32nd Annual Forum of the American Helicopter Society, Washington, D.C., May 1976.
17 Sheridan, P.F. and Wiesner, W., “Aerodynamics of
Heli-copter Flight Near the Ground,” 33rd Annual Forum of the American Helicopter Society, Washington DC, May 1977.
18 Curtiss, H.C. Jr., Erdman, W., and Sun, M., “Ground
Effect Aerodynamics,”Vertica, Vol. 11 (1–2), 1987, pp. 29–42.
19 Curtiss, H.C. Jr., Sun, M., Putman, W.F., and Hanker,
E.J. Jr., “Rotor Aerodynamics in Ground Effect At Low Advance Ratios,”Journal of the American Helicopter
Society, Vol. 29 (1), 1984, pp. 48–55.
20 Brown, R.E. and Whitehouse, G.R., “Modelling Rotor
Wakes in Ground Effect,”Journal of the American
He-licopter Society, Vol. 49 (3), July 2004, pp. 238–249.
21 Cooke, A.K. and Fitzpatrick, E.W.H., Helicopter Test
and Evaluation, American Institute of Aeronautics and
Astronautics Education Series, Reston, VA, 2002. 22 Nathan, N.D. and Green, R.B., “Measurements of a