Use of bacterial ureolysis for improved gelation of silica sol in rock
1!
grouting
2!
3!
Erica MacLachlan
4!
Gráinne El Mountassir
5!
Rebecca J. Lunn
6!
Department of Civil and Environmental Engineering, University of Strathclyde, Glasgow, UK
7!
8!
Corresponding Author:
9!
Name: Gráinne El Mountassir
10!
11!
Address:
12!
Department of Civil and Environmental Engineering,
13!
John Anderson Building,
14!
University of Strathclyde
15!
107 Rottenrow,
16!
Glasgow,
17!
G4 0NG
18!
19!
Telephone: +44 141 548 3252
20!
Fax: +44 141 553 2066
21!
E-mail address: grainne.elmountassir@strath.ac.uk
22!
23!
Abstract
24!
Low pH silica-based grouts suitable for penetrating fine aperture fractures are increasingly being developed for
25!
use in engineering applications. Silica sol has an initial low viscosity and mixing with an accelerator destabilises
26!
the suspension producing a gel. The influence of sodium, calcium and ammonium chloride accelerators on gel
27!
time, rate of gelation and shear strength of the resulting gel were investigated in this study. For the first time the
28!
potential use of bacterial ureolysis as an accelerator for the destabilisation of silica sol was also explored.
29!
This study demonstrates that bacterial ureolysis can be used to control the gelation of silica sol. The rate of
30!
ureolysis increases with increasing bacterial density, resulting in faster gel times and higher rates of gelation. In
31!
addition, for grouts with similar gel times, using bacterial ureolysis to induce destabilisation results in a higher
32!
rate of gelation, a higher final shear strength and a more uniform gel than direct addition of the corresponding
33!
chemical accelerator. These results suggest that bacterial ureolysis could potentially be used in rock grouting to
34!
achieve long gel times and hence greater penetration, while also maintaining sufficiently rapid gelation to
35!
minimise issues related to fingering and erosion of the fresh grout.
36!
1.
Introduction
39!
Cementitious grouts are commonly used to reduce hydraulic conductivity in fractured rock and increasingly
40!
microfine and ultrafine cements are used for penetrating fine aperture fractures. However, their penetration
41!
below 50-100µm remains limited without hydraulic jacking. For geological repositories of high level nuclear
42!
waste (HLW), fractures with apertures down to 10µm will need to be sealed to meet acceptable leakage rates
43!
(Funehag, 2007). High pH cement grouts (pH 12-13) will not be used in the vicinity of HLW repositories due to
44!
the adverse impact of high pH leachate on the behaviour of bentonite (Bodén & Sievänen, 2005). There are also
45!
concerns that superplasticisers, used to improve the flow of cement grouts, may reduce radionuclide sorption in
46!
repository environments (Young et al., 2013). Thus, there is a need for the development of alternative grouts
47!
which can penetrate fine aperture fractures.
48!
A low viscosity grout comprising silica sol and an accelerator has been proposed (Funehag & Axelsson, 2003;
49!
Funehag & Gustafson, 2008). The accelerator, a saline solution, destabilises the suspension of nanometre sized
50!
silica particles resulting in a gel. The distance the grout can penetrate is governed by the gel time (and initial
51!
viscosity) (Funehag & Gustafson, 2008). In water-filled fractures, it is desirable that the grout gains strength
52!
quickly to reduce fingering of the grout front and to minimise its erosion by ingressing water. Hence, the gel
53!
time, rate of gelation and shear strength evolution are critical properties for the design of a successful grouting
54!
campaign.
55!
In this study, the direct addition of three different accelerators (sodium, calcium and ammonium chloride) was
56!
investigated and the gel time, rate of gelation and shear strength parameters determined. The potential use of
57!
bacterial ureolysis as an accelerator for the in situ destabilisation (i.e. cations produced within the silica sol) was
58!
also explored for the first time.
59!
60!
2.
Materials and Methods
61!
2.1 Silica sol and gel properties
62!
MP320 colloidal silica (Meyco BASF), which is sold with a sodium chloride accelerator was used in this study.
63!
The silica sol has the following properties: dynamic viscosity ~ 10 mPa.s, density = 1.3 g/cm3, pH = 9.5-9.8 and
64!
Silica sol was mixed with accelerators in a 5:1 ratio. The increase in dynamic viscosity that occurs as gelling
66!
proceeds was measured using a Brookfield Digital Viscometer (LVT DVII model) in accordance with ASTM
67!
D4016-93. 200ml of silica sol: 40ml of accelerator was used in the viscosity tests and double these volumes for
68!
the shear strength tests. Shear strength tests were carried out using a Wykeham Farrance laboratory shear vane
69!
apparatus (BS1377-7:1990). Specimens were sealed to prevent evaporation and shear strength was measured
70!
after: (i) 1 day and (ii) 7 days in an environment with a relative humidity of between 40 – 60 %. Viscosity and
71!
shear strength tests were carried out in a temperature controlled laboratory at 20 oC.
72!
73!
2.2 Bacterial suspension
74!
Bacterial ureolysis relies on the urease enzyme of bacteria to hydrolyse urea to ammonium ions. In this study
75!
Sporosarcina pasteurii (strain ATCC 11859), a common ureolytic soil bacterium was used. S. pasteurii were
76!
initially grown on solid Brain Heart Infusion (BHI) agar with urea (20g/l). A single colony was then transferred
77!
to liquid BHI growth medium (37g/l) again supplemented with urea (20g/l) and cultures were grown at 25°C
78!
over 24 hours. The bacterial suspensions were produced by separating the bacteria from the growth medium by
79!
centrifuging (at 8,000 rpm for 4 mins) and diluting with sterile tap water until the required optical density
80!
(OD600) was achieved (measured using a UV-VIS spectrophotometer @600nm). OD600 is commonly used as a
81!
method of ensuring that similar numbers of bacteria are present in prepared solutions.
82!
Equal volumes of the bacterial suspension and urea were mixed together prior to mixing with silica sol in a 5:1
83!
ratio. The accelerator of bacterially-induced ammonium ions with a final OD600 =0.33 and 0.145M urea was
84!
prepared by mixing 20ml of 4 OD600 bacterial suspension and 20ml of 1.74M Urea together and then mixing
85!
with 200ml of silica sol. To give a final OD600 =0.67 the solutions were mixed as before but with 20 ml of 8
86!
OD600 bacterial suspension. To achieve optical densities >1, larger volumes of lower concentration suspensions
87!
were centrifuged, and the supernatant re-suspended in smaller volumes of sterile water, e.g. the supernatant of
88!
80ml of 1 OD600 was re-suspended in 20ml of sterile water to give an equivalent of 4 OD600. Separation of the
89!
bacteria from growth medium ensures limited further growth, while ureolysis provides the existing S. pasteurii
90!
with energy for metabolic processes.
91!
92!
The ureolysis rate constant, kurea was calculated for aqueous solutions from Equation 1 using experimental
94!
measurements of ammonium concentration over time [NH4+]t, where [urea]0 is the initial urea concentration
95!
(Tobler et al., 2011):
96!
[
4]
2
[
]
0(
1
k t)
t
urea
e
ureaNH
+ −−
=
(1)
97!
Ammonium concentrations were determined using the colorimetric Nessler method for aqueous solutions as
98!
described in Tobler et al., (2011). This method could not be used to determine the ammonium concentration in
99!
silica sol, due to its opalescence. However, since the hydrolysis of urea produces ionic products from a
non-100!
ionic substrate it is possible to measure conductivity (Whiffin, 2004; DeMuynck et al., 2011). For both aqueous
101!
bacterial suspensions (OD600 of 0.33 and 0.67) the linear relationship between conductivity and ammonium
102!
concentrations (determined using the Nessler method) was derived (R2 values of 0.95 and 0.98) enabling
103!
ammonium concentration within the silica sol to be estimated using conductivity measurements and hence
104!
calculation of kurea.
105!
!
106!
3.
Results
107!
The gelation properties of the silica sol can be controlled by varying the type and concentration of the
108!
accelerator (e.g. Funehag & Axelsson, 2003). This results in changes not only to the gel time but also to the rate
109!
of gelation (defined in Figure 1). For example, Figure 1 illustrates that decreasing the concentration of NaCl
110!
accelerator from 0.363M to 0.255M , increases the gel time from 17 mins to 120 mins, with a corresponding
111!
decrease in the rate of gelation from 322 mPa.s/min to 241 mPa.s/min. At lower concentrations the onset of
112!
gelation is also more gradual.
113!
114!
3.1 Monovalent and divalent cation accelerators
115!
Comparing Grout A (0.29M NaCl) and Grout B (0.033M CaCl2) in Figure 2, it is apparent that despite the final
116!
concentration of CaCl2 being almost an order of magnitude less than that of NaCl, the gel time was slightly
117!
shorter for Grout B (29 mins) than for Grout A (38 mins) and the rate of gelation much higher, 767 mPa.s/min
118!
compared to 324 mPa.s/min. This is because the divalent calcium ion is more effective at compressing the
119!
reduces electrostatic repulsion between silica particles, increasing the likelihood of inter-particle collision, hence
121!
accelerating aggregation and gelation. After 1 day, Grout A and B had a shear strength of 28 kPa (Table 1), after
122!
7 days Grout B exhibited a higher shear strength (76 kPa) compared to Grout A (51 kPa), indicating that cation
123!
valency also influences strength gain.
124!
During visual inspection of Grout B (0.033M CaCl2) large aggregations were noted on mixing and the resulting
125!
gel had distinguishable layers in varying shades of white. This indicates a degree of heterogeneity resulting from
126!
the direct addition of calcium chloride. It is likely that aggregations also form on the direct addition of sodium
127!
chloride; however these only became visible at higher salinity concentrations.
128!
129!
3.2 Monovalent cation accelerators
130!
It is evident that Grout C (0.29M NH4Cl) gelled much quicker than Grout A (0.29M NaCl). This is despite the
131!
fact that both accelerators have monovalent cations and had the same final concentration (Figure 2). The rate of
132!
gelation was also higher for Grout C (Table 1). After 1 day both grouts had similar shear strength, however
133!
after 7 days, Grout C (0.29M NH4Cl) exhibited a higher shear strength of 79 kPa compared to 51 kPa for Grout
134!
A.
135!
The observed differences in the viscosity curves and shear strengths between these two monovalent ions (Na+
136!
and NH4+) is due to ion specificity. Na+ due to its small size has a high charge density and exhibits a strong
137!
interaction with water molecules (kosmotropic), resulting in a large hydration sphere (Trompette & Meireles,
138!
2003). By comparison NH4+ is a large ion with a low charge density and exhibits weaker interactions with water
139!
molecules (chaotropic), thus it has a smaller hydration sphere than Na+. As a result, NH
4+ ions can adsorb closer
140!
to the silica particle surface, which may explain the higher shear strength observed. Consistent with our results,
141!
Trompette & Meireles, (2003) found that chaotropic ions are more efficient at destabilising silica sol than
142!
kosmotropic ions.
143!
144!
3.3 Bacterially-induced ammonium ions (in situ) compared with direct addition of ammonium chloride
145!
Comparing the direct addition of ammonium (Grout C 0.29 M NH4Cl) with the production of NH4+ ions in situ,
146!
(i.e. within the silica sol) by bacterial ureolysis (Grout E max of 0.29M NH4+), it is clear that for the same
147!
(Figure 2). However, if we compare direct addition versus in situ production for grouts with a similar gel time,
149!
(Grout D 0.16M NH4Cl and Grout E), Grout E had a rate of gelation 2.8 times that of Grout D (546 mPa.s/min
150!
compared to 192 mPa.s/min, Table 1) and a 25% higher 7-day shear strength than Grout D.
151!
152!
3.4 Influence of bacterial density on silica sol gelation
153!
Figure 3 compares the viscosity evolution of silica sol destabilised using two different bacterial densities,
154!
equivalent to 0.67OD600 and 0.33OD600. For the grout with the higher numbers of bacteria present (0.67OD600)
155!
the gel time is much shorter and the rate of gelation higher than for the 0.33OD600 grout. This can be explained
156!
by considering the production of NH4+ ions which is dependent on bacterial density (OD600) (Figure 4).
157!
Ureolysis proceeds rapidly in the silica sol due to the fact that here the bacteria have been grown in media
158!
containing urea; only a small initial lag can be observed. Figure 4 shows that NH4+ ions are produced before
159!
gelling begins in both bacterial grouts indicating that a critical ion concentration is required for gelation and that
160!
this is reached much sooner in the higher bacterial density grout (0.67OD600) due to the higher ureolysis rate
161!
constant (kurea).
162!
163!
4.
Discussion
164!
In order to use silica sol to grout fine aperture fractures in hard rock, the gel time should enable sufficient
165!
penetration during the initial period of low viscosity and allow for mixing and pumping; workability times of
166!
more than 1 hour are recommended (Bodén & Sievänen, 2005). Once the gel time has been reached and
167!
pumping stopped, gelation should proceed rapidly, so that there is a rapid strength gain. Reducing accelerator
168!
concentrations to control gel time, compromises the gel rate and the rate of strength gain. This can result in back
169!
flow (particularly if connected to a tunnel), fingering, and grout erosion (Emmelin et al., 2007; Axelsson et al.,
170!
2008).
171!
Our research shows that it is possible to use bacterial ureolysis to induce the gelation of silica sol and for a given
172!
gel time results in a higher rate of gelation and a 25% higher final shear strength than can be achieved with the
173!
corresponding chemical accelerator (i.e. NH4+ ions). Furthermore, as observed in our experiments, chemical
174!
accelerators can result in heterogeneous gel formation due to the non-uniform distribution of ions during
175!
bacterially-induced gels. Figure 5 shows Scanning Electron Microscope (SEM) images of a single cell (Figure
177!
5a) and multiple cells (Figure 5b) embedded within Grout E after 1 day. The relatively even distribution of
178!
bacteria engenders a more uniform distribution of ammonium cations, since production occurs in situ, resulting
179!
in a more uniform gel structure.
180!
The consideration of biological processes in geotechnical engineering has gained increasing interest in recent
181!
years (Mitchell & Santamarina, 2005; DeJong et al., 2013) with much attention focused on microbially induced
182!
calcite precipitation (DeJong et al., 2006; Van Paassen et al., 2010; Al Qabany & Soga, 2013). This study
183!
demonstrates for the first time the potential use of microorganisms as a means of controlling the gel time of a
184!
low viscosity grout; an entirely new avenue of research in geotechnical engineering. Field application will
185!
require cultivation of S. pasteurii on a large scale, which can be carried out by biotechnology companies (Van
186!
Paassen, 2011). It is envisaged that the bacterial suspension would be first mixed with the silica sol and urea,
187!
and then pumped into the subsurface via injection points. While separation of S. pasteurii from the growth
188!
medium as conducted in our experiments may not be entirely necessary, the advantage is that the stimulation
189!
and growth of indigenous microorganisms can be avoided by not introducing additional nutrients into the
190!
subsurface. Finally, the use of this technique in soils would require consideration of the bacteria size relative to
191!
the interconnected porosity (Mitchell & Santamarina, 2005; Phadnis & Santamarina, 2011).
192!
193!
5.
Conclusions
194!
This study has shown that bacterial ureolysis can be used to control the production of ammonium ions and thus
195!
the gelation of silica sol. The rate of ureolysis increases with increasing bacterial density, resulting in faster gel
196!
times and higher rates of gelation. For a specified gel time, i.e. penetration distance, the use of bacterial
197!
ureolysis leads to a higher rate of gelation, a higher final shear strength and a more uniform gel structure than
198!
direct addition of the corresponding chemical accelerator. These results suggest that bacterial ureolysis could
199!
potentially be used in rock grouting to achieve long gel times and hence greater penetration, while also
200!
maintaining sufficiently rapid gelation to minimise issues related to fingering and erosion of fresh grout.
201!
202!
203!
Acknowledgements
205!
This work was funded by a UK EPSRC research grant (EP/G063699/1) and an EPSRC doctoral studentship.
206!
The authors also thank Prof Zoe Shipton for reviewing an early draft of the paper.
207!
208!
References
209!
Al Qabany, A. & Soga, K. (2013). Effect of chemical treatment used in MICP on engineering properties of
210!
cemented soils. Géotechnique 63, No. 4, 331 – 339.
211!
ASTM D4016 (1993). Standard Test Method for Viscosity of Chemical Grouts by Brookfield Viscometer
212!
(Laboratory Method). ASTM International, West Conshohocken, PA, 1993.
213!
Axelsson, M., Gustafson, G., Fransson, Å. & Funehag, J. (2008). Design criteria for permeation grouting in hard
214!
rock at great depths. World Tunnel Congress 2008 - Underground Facilities for Better Environment and
215!
Safety, Agra, India. New Delhi: Central Board of irrigation & Power, vol. 1, pp. 510-520.
216!
BASF. (2009). Meyco MP320 Solvent-free, low viscosity, hydrophilic grout for rock injection and
217!
consolidation of sand and silt strata. See
218!
http://www.meyco.basf.com/en/meyco_solutions/TDS/Injection/mineralgrouts/MP320/Documents/TDS_ME
219!
YCO_MP_320.pdf . Accessed 8/06/2012.
220!
Bodén, A. & Sievänen, U. (2005). Low-pH injection grout for deep repositories, Summary report from a
co-221!
operation project between NUMO (Japan), Posiva (Finland) and SKB (Sweden), SKB Report R-05-40,
222!
Swedish Nuclear Fuel and Waste Management Co., Stockholm Sweden.
223!
BS 1377-7:1990.Methods of test for soils for civil engineering purposes. Shear strength tests (total stress).
224!
British Standards Institution. 62 pages. ISBN: 0580182649
225!
DeJong, J.T., Fritzges, M.B., & Nüsslein, K. (2006). Microbial Induced Cementation to Control Sand Response
226!
to Undrained Shear. Journal of Geotechnical and Geoenvironmental Engineering 132, No. 1, 1381-1392.
227!
DeJong, J.Y. Soga, K., Kavazanjian, E., Burns, S., van Passen,L.A., Al Qabany,A., Aydilek, A., Band, S.S.,
228!
Burbnak, M., Caslake, L.F., Chen, C.Y., Chen, X., Chu, J., Ciurli, S., Esnault-Filet, A., Fauriel, S.s Hamdan,
229!
N., Hata., T., Inagaki, Y., Jeffers, S., Kuo, M., Laloui, L., Larrahondo, J., Manning, D,A,C., Martinez, B.,
230!
Montoya, B.M., Nelson, D.C., Palomino, A., Renforth, P., Santamarina, J.C., Seagren, E.A., Tanyu, B.,
231!
Tsearsky, M., & Weaver, T. (2013). Biogeochemical processes and geotechnical applications: progress,
232!
opportunities and challenges. Géotechnique 63, No. 4, 287 -301.
233!
De Muynck, Willem, Leuridan, S., Van Loo, D., Verbeken, K., Cnudde, V., De Belie, N., & Verstraete, W.
234!
(2011). Influence of Pore Structure on the Effectiveness of a Biogenic Carbonate Surface Treatment for
235!
Limestone Conservation. Applied and Environmental Microbiology 77, No. 19, 6808–6820
236!
Emmelin, A., Brantberger, M., Eriksson, M., Gustafson, G. & Stille, H. (2007). Rock grouting: Current
237!
competence and development for the final repository. SKB Report R-07-30, Swedish Nuclear Fuel and Waste
238!
Management Co., Stockholm Sweden.
239!
Funehag, J. & Axelsson, M. (2003). Hydrogeological characterisation and sealing of narrow fractures in hard
240!
rock – A case study. RMZ-Materials and Geoenvironment 50, No. 1, 121–124.
241!
Funehag, J. (2007). Grouting of tunnel at great depths – How to meet strict demands? Proceedings of the third
242!
workshop on low pH cements for a geological repository, Paris, June 13th-14th 2007. ESDRED Workshop,
243!
124-133.
244!
Funehag, J. & Gustafson, G. (2008). Design of grouting with silica sol in hard rock: New design criteria tested
245!
in the field, part I. Tunnelling and Underground Space Technology 23, No. 1, 1-8.
246!
Mitchell, J. K. & Santamarina, J. C. (2005). Biological considerations in geotechnical engineering, Journal of
247!
Geotechnical and Geoenvironmental Engineering 131, No. 10, 1222-1233.
248!
Phadnis, H. S. & Santamarina, J. C. (2011). Bacteria in sediments: pore size effects, Géotechnique Letters 1, No.
249!
4, 91-93.
250!
Savarmand, S., Carreau, P.J., Bertrand, F., Vidal, D. J.-E. & Moan, M. (2003). Rheological properties of
251!
concentrated aqueous silica suspensions: Effects of pH and ions content. Journal of Rheology 47, No. 5,1133
252!
- 1149.
253!
Schantz Zackrisson, A., Skov Pedersen, J., & Bergenholtz, J. (2008). A small-angle X-ray scattering study of
254!
aggregation and gelation of colloidal silica. Colloids and Surfaces A: Physicochemical Engineering Aspects
255!
315, No. 1-3, 23 - 30.
256!
Summers, L. E., Purkaple, J. D. & Allison, J. D. 1988. Laboratory evaluation of crosslinked polymer gels for
257!
Proceedings of a National Meeting of the ACS entitled Polymers in Enhanced Oil Recovery and the
259!
Recovery of other Natural Resources, held September 7-12, 1986, Anaheim, California, Plenum Press, New
260!
York, pp. 313-328.
261!
Tobler, D.J., Cuthbert, M.O., Greswell, R.B., Riley, M.S., Renshaw, J.C., Handley-Sidhu, S., & Phoenix, V.R.
262!
(2011). Comparison of rates of ureolysis between Sporosarcina pasteurii and an indigenous groundwater
263!
community under conditions required to precipitate large volumes of calcite. Geochimica et Cosmochimica
264!
Acta 75, No. 11, 3290-3301.
265!
Trompette, J. L. & Meireles, M. (2003). Ion-specific effect on the gelation kinetics of concentrated colloidal
266!
silica suspensions. Journal of colloid and interface science 263, No. 2, 522-527.
267!
Van Paassen, L.A., (2011). Bio-mediated ground improvement: From laboratory experiment to pilot
268!
applications, ASCE GeoFrontiers 2011: Advances in Geotechnical Engineering, Geotechnical Special
269!
Publication 211, pp. 4099-4108.
270!
Van Paassen, L.A., Ghose, R., van der Linden, T.J.M., van der Star, W.R.L., & van Loosdrecht, M.C. (2010).
271!
Quantifying bio-mediated ground improvement by ureolysis: a large scale Biogrout experiment. Journal of
272!
Geotechnical and Geoenvironmental Engineering 136, No. 12, 1721- 1728.
273!
Whiffin, V.S. (2004). Microbial CaCO3 Precipitation for the Production of Biocement. Science and Engineering
274!
School of Biological Sciences and Biotechnology. Murdoch University. PhD thesis.
275!
Young, A. J., Warwick, P., Milodowski, A. E. & Read, D. (2013). Behaviour of radionuclides in the presence of
276!
super plasticiser. Advances in Cement Research 25, No. 1, 32-43.
277!
List of Figures
279!
Figure 1. Viscosity-time curves for the gelation of silica sol destabilised using sodium chloride accelerators. For
280!
each concentration the experiment was performed in triplicate. Gel time (tgel) is defined as the intercept of
281!
the extrapolations from the two straight line portions of the viscosity-times curves (Summers et al., 1988)
282!
and the rate of gelation (rgel) as the slope of the curve as marked on the figure. Values of tgel and rgel reported
283!
are averages of each triplicate.
284!
Figure 2. Viscosity-time curves for the gelation of silica sol destabilised using different accelerators. Table 1
285!
summarises the properties of each grout marked on Figure 2.
286!
Figure 3: Viscosity-time curves for in situ destabilisation via bacterial ureolysis at two different bacterial
287!
densities: 0.33OD600 and 0.67OD600. Experiments were performed in triplicate.
288!
Figure 4. Ammonium production and kurea in silica sol at two different equivalent bacterial densities: 0.33OD600
289!
and 0.67OD600. Initial urea concentration used for determination of kurea was 1.5M. Closed and open circles
290!
are ammonium concentrations estimated from conductivity measurements.
291!
Figure 5. Scanning Electron Microscope images of grout E obtained after 1 day, showing that (a) the bacteria
292!
remain in the form of individual cells and (b) they are relatively evenly distributed indicating that the
293!
production of ammonium ions would be well distributed throughout the silica sol.
294!
295!
296!
List of Tables
297!
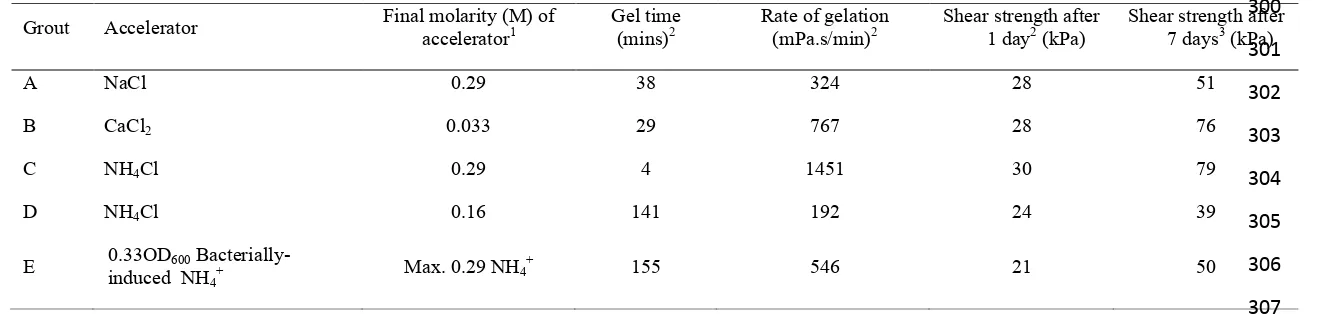
Table 1. Silica gel properties for different grout and accelerator combinations as shown in Figure 2.
299!
300!
301!
302!
303!
304!
305!
306!
307!
1After mixing with silica sol in 5:1 ratio308!
2 Average of three specimens tested
309!
3 Single measurement
310!
Grout Accelerator Final molarity (M) of
accelerator1
Gel time (mins)2
Rate of gelation (mPa.s/min)2
Shear strength after 1 day2 (kPa)
Shear strength after 7 days3 (kPa)
A NaCl 0.29 38 324 28 51
B CaCl2 0.033 29 767 28 76
C NH4Cl 0.29 4 1451 30 79
D NH4Cl 0.16 141 192 24 39
E 0.33OD600
Bacterially-induced NH4+ Max. 0.29 NH4
311!
Figure 1. Viscosity-time curves for the gelation of silica sol destabilised using sodium chloride accelerators. For
312!
each concentration the experiment was performed in triplicate. Gel time (tgel) is defined as the intercept of
313!
the extrapolations from the two straight line portions of the viscosity-times curves (Summers et al., 1988)
314!
and the rate of gelation (rgel) as the slope of the curve as marked on the figure. Values of tgel and rgel reported
315!
are averages of each triplicate.
316!
317!
318!
Figure 2. Viscosity-time curves for the gelation of silica sol destabilised using different accelerators. Table 1
319!
[image:12.595.88.452.393.639.2]321!
Figure 3: Viscosity-time curves for in situ destabilisation via bacterial ureolysis at two different bacterial
322!
densities: 0.33OD600 and 0.67OD600. Experiments were performed in triplicate.
323!
324!
Figure 4. Ammonium production and kurea in silica sol at two different equivalent bacterial densities: 0.33OD600
325!
and 0.67OD600. Initial urea concentration used for determination of kurea was 1.5M. Closed and open circles
326!
[image:13.595.80.392.347.552.2]328!
Figure 5. Scanning Electron Microscope images of grout E obtained after 1 day, showing that (a) the
329!
bacteria remain in the form of individual cells and (b) they are relatively evenly distributed indicating that
330!
the production of ammonium ions would be well distributed throughout the silica sol.