City, University of London Institutional Repository
Citation
:
Andrienko, G., Andrienko, N., Dykes, J., Fabrikant, S. I. and Wachowicz, M. (2008). Geovisualization of dynamics, movement and change: key issues and developing approaches in visualization research. Information Visualization, 7(3-4), pp. 173-180. doi: 10.1057/ivs.2008.23This is the unspecified version of the paper.
This version of the publication may differ from the final published
version.
Permanent repository link:
http://openaccess.city.ac.uk/175/Link to published version
:
http://dx.doi.org/10.1057/ivs.2008.23Copyright and reuse:
City Research Online aims to make research
outputs of City, University of London available to a wider audience.
Copyright and Moral Rights remain with the author(s) and/or copyright
holders. URLs from City Research Online may be freely distributed and
linked to.
City Research Online: http://openaccess.city.ac.uk/ [email protected]
Geovisualization of Dynamics, Movement and Change:
Key Issues and Developing Approaches in Visualization
Research
Gennady Andrienko, Natalia Andrienko, Jason Dykes, Sara Irina Fabrikant, Monica Wachowicz
This issue of Information Visualization showcases research activity involving and contributing to the visual analysis of dynamism, movement and change in phenomena that have a spatial element.
The work presented here represents a selection of the contributions made to a workshop coordinated by the International Cartographic Association (ICA) Commission on Geovisualization and the Association of Geographic Information Laboratories in Europe (AGILE) on the Geovisualization of Dynamics, Movement and Change. Theoretical and methodological approaches for exploring and analyzing large datasets with spatial and temporal components were presented, discussed and developed at the meeting in Girona, Catalunya which was held on 5th May 2008 one day before AGILE’s 11th International Conference on Geographic Information Science.
The high level of interest raised by the open call for contributions and the ultimate participation of more than 40scientists suggests that this theme is timely and of relevance to many researchers and research groups. It would also seem to indicate that spatio-temporal data pose plenty of interesting and unsolved research problems. The workshop, and the work subsequently reported here suggest that many of these are complex and can benefit from the application of cross-disciplinary approaches. Cross-disciplinarity has been reflected not only in the contents of the submissions, but also in the composition of the workshop delegates, which included scientists from a variety of nations with backgrounds in geography, geographic information science, information visualization, data mining and other cognate disciplines. We reflect upon some of these trends in this introduction to the papers.
Integration of approaches from multiple disciplines is a characteristic feature of geovisualization - a research domain addressing the visual exploration, analysis, synthesis, and presentation of geographic data, information, and knowledge (Dykes et al. 2005). The ICA Commission on Geovisualization works to develop, promote and communicate advances in this multidisciplinary domain - http://geoanalytics.net/ica. One way of so doing is to attract researchers with various disciplinary backgrounds to themed workshops that showcase current multidisciplinary approaches whilst allowing participants to learn about relevant theories and methods existing in related fields. They also create new opportunities for considering problems from different perspectives, and for starting new cross-disciplinary collaborations.
Common approaches in current visualization research
that need to be analyzed. A number of identifiable approaches are common to current research in Information Visualization and Geovisualization. These are evidenced by the work presented in this special issue of Information Visualization.
The traditional visualization approach involves the direct depiction of each record in a data set so as to allow the analyst to extract noteworthy patterns by looking at the displays and interacting with them. However, multifarious data sets of unprecedented size and complexity are accumulating at rapid speed. Effective visual exploration may offer opportunities for analysing these data sets in a timely fashion, but current techniques may not be effective when applied to the visual analysis of the kinds of large and complex data sets that are increasingly common. The displays may become illegible due to visual clutter and massive overplotting associated with large numbers of cases, users may have difficulty perceiving, tracking and comprehending numerous visual elements that change simultaneously, or the speed of rendering and responses to user interactions may become too slow for efficient inference making. A series of methods are being developed to address these issues and support our capabilities for the visual analysis of large spatio-temporal datasets through ‘direct depiction’. Some of these are reported here in the context of geovisualization of dynamics, movement and change – for example Carvalho et al. (this issue – paper 7) develop novel means of interacting with direct depictions of data that have a temporal element.
Despite these advances, it is unlikely that new methods that solve all of these problems can be developed solely through this approach. Two alternative approaches are being increasingly utilized in response to the current challenges. One modifies the traditional visualization approach by involving methods for data aggregation and summarization prior to graphical depiction and visualization. Appropriate summaries may involve various forms of abstraction including aggregation, generalization and perhaps sampling. The idea here is that appropriate and meaningful summaries are derived from the original measurements through consistent elementary transformations such as aggregations that may occur according to space (to a particular resolution of set of spatial units), time (to a particular temporal resolution or unit) and attribute (through classification). Rather than directly mapping the original data these transformed summaries are presented in a way that allows the user to extract patterns. Zhao et al. (paper 2 - this issue) and Slingsby et al. (this issue – paper 3) present some novel representations of data aggregates..
The other approach involves applying more sophisticated computational techniques, such as those developed in data mining, to semi- or fully automatically extract specific types of feature or pattern from data prior to visualization. Computationally extracted patterns
(or more specifically ‘proto-patterns’ as they lack semantic embedding) are presented to the user for interpretation, evaluation, and synthesis, which may involve visualization of the computationally derived artifacts. This ‘visual data mining’ approach may apply to summaries and along with the visualization of summaries, may take advantage of ideas and advances developed in ‘direct depiction’. For example, Rinzivillo et al. (paper 4 - this issue) use data mining methods to explore patterns in constructs derived from their data.
may also be applicable to the processes involved in deriving these summaries and patterns as well as the results, reinforcing the direct links between the phenomena of interest, the measurements made and the higher level derivatives achieved through their analysis.
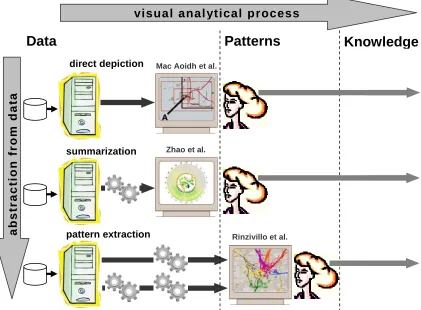
Figure 1 graphically represents these three approaches to exploratory and analytical visualization:
1. direct depiction and visualization of the data collected;
2. derivation, depiction and visualization of abstract data summaries – aggregates, generalization, samples;
3. extraction, depiction and visualization of computationally extracted patterns.
In each case an analyst interacts with visual representations developed using these approaches and derives knowledge by interpreting patterns, comparing patterns, building composite patterns and developing arguments, ideas and conclusions.
The objects of study are increasingly abstract and reliant upon informed computation in successive approaches and may themselves rely increasingly upon knowledge from multidisciplinary domains: developing and using techniques and tools according to either of the latter approaches requires competences from at least two disciplines - visualization plus database processing, statistical analysis, or data mining.
Patterns
Data
direct depiction
summarization
visua l anal ytical process
pattern extraction
ab
st
ract
io
n
from
dat
a
Mac Aoidh et al.
Zhao et al.
Rinzivillo et al.
Figure 1: Three approaches to visual analysis in exploratory visualization. (1) The user identifies patterns by interacting with visual representations that directly depict individual measurements recorded in their data set (e.g. MacAoidh et al., paper 8 - this issue). (2) The user identifies patterns from visual representations of data summaries computed from the original measurements (e.g. Zhao et al., paper 2 - this issue). (3) The computer identifies patterns from the data or summaries of the data and visually represents these data artifacts which are interpreted by the user (e.g. Rinzivillo et al., paper 4 - this issue).
The increasing sizes and complexities of data sets being collected not only call for new cross-disciplinary approaches to analysis but also require that visualization researchers explicitly define the types of patterns that can exist in different types of data. Indeed, as analytical approaches develop to focus upon more abstract constructs it may no longer be possible or appropriate to just plot all data values and “let the data speak for themselves”. Data visualization methods and tools may need to be designed and utilized with a particular pattern type in mind. This is most evident for analysis using the third approach in which pattern extraction is fully computational. However, this is also true for techniques intended to help users to see relevant patterns on a display: if aggregation or other forms of data reduction are inevitable then this must be achieved in such a way that significant patterns are preserved and detectable. Theoretical research aimed at the explicit definition of possible pattern types is being undertaken (e.g. Purchase et al. 2008). A taxonomy of patterns that can exist in data about movement was discussed at the Girona workshop and a paper describing the developing taxonomy is included here (Dodge et al., paper 5 - this issue).
Visual depictions of more abstract semantic constructs such as aggregations, generalizations, and patterns require relatively sophisticated methods, tools and user-system interaction facilities for their exploration and analysis. Furthermore, effective use of complex visual exploration tools may not only pre-suppose basic training in handling the visual displays and interactive controls, but also advanced understanding of the computational processing involved, i.e. how the constructs shown on the display have been obtained, and what they mean. Hence, visualization techniques and tools employing approaches that involve increasing levels of abstraction from the recorded data need to be designed for specifically trained analysts rather than more generic “end users”.
- this issue) report upon visualization tools developed to explore system use in this context.
Evaluation of a method must also include an explicit confirmation that the method really uncovers the types of patterns it is supposed to uncover. One means of validating methods is to check them against datasets where the patterns are known in advance. If such datasets are not available, it may be appropriate to construct synthetic data with various required properties for validation. Demšar et al. (paper 1 - this issue) use this approach to evaluate their method, which combines computational and visual techniques for pattern detection. They check whether previously known spatio-temporal patterns can be visually identified in computationally derived surfaces visualized by means of the GeoVISTA Studio software (Takatsuka and Gahegan, 2002).
Furthermore, it is important to ensure that the method not only detects or helps to detect patterns that exist in data, but also does not derive or exhibit patterns that do not exist. For example, a computational method designed to find clusters may be likely to do so even if no valid clusters are present in the dataset. For this reason, it is important to cross validate patterns that are identified with other approaches to avoid discovering artifacts generated by the particular method employed.
Besides establishing computational validity, any methods developed must be cognitively adequate for inference and tools must be usable for analysis and decision making. We have argued that broad-based user studies are unlikely to be feasible or appropriate in many cases as it may be too difficult to find representative users and settings for externally and ecologically valid experiments. To alleviate this problem tools must be developed within the context of known theories and well established design principles that are based upon existing empirical studies reported in a growing interdisciplinary literature on visual displays. Cognitive theories, long-standing design principles, and related empirical studies on visual displays serve as appropriate starting points for tool development and these key aspects of visualization were actively discussed at the workshop.
Furthermore, if tools for visual exploration and analysis are oriented to expert analysts rather than the general public or decision makers, it is necessary to support the analyst in summarizing the results of their work and presenting them in a form suitable for consumption by the ultimate users of the knowledge derived. One of the contributions to the workshop proposed an approach to computer-supported generation of 2D semantic and geometric map generalizations for presenting patterns extracted from spatio-temporal data. These ideas are presented more formally in this special issue (Del Fatto et al., paper 6 - this issue).
Data
Patterns
Theory
Methods
Computing Visualization Interaction
Types; structures; properties; relations Types; properties Derived attributes, smoothing, interpolation, projection, …
Derivation of discrete aggregates, fields, flows, summaries, …
Visualization of individual data items Visualization of summaries Querying, focusing, selecting, … Drilling down, dynamic re-aggregation, querying, … Filtering, arranging, combining, … Summaries Visualization of proto-patterns
2 3 2 3 2 3
1 7
6
1 4 4
4 4 4
5 6 6
7 8 8 Support for knowledge externalization and reasoning Knowledge Task-effectiveness; validity; efficiency; sensitivity; scalability Task-effectiveness; perceptual & cognitive
plausibility; efficiency
Task-effectiveness; usability; efficiency Cognition;
Evaluation of methods
[image:7.612.87.523.77.534.2]1 8 6 2 Presentation of analysis results reasoning Types; structures; semantics; Extraction of proto-patterns (data mining) perception
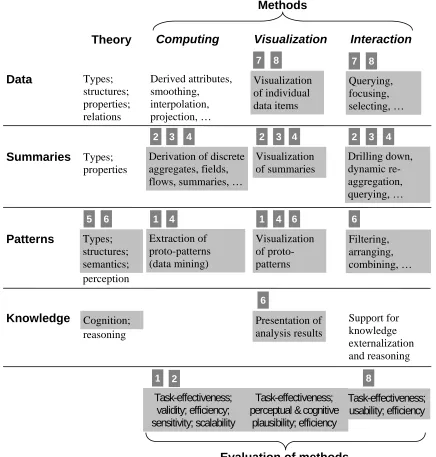
Figure 2: The objects and topics of current research in visualization. Topics discussed at the ICA Commission on Geovisualization workshop on Geovisualization of Dynamics, Movement and Change are highlighted. Example papers that address some of these topics are identified by number.
Geovisualization: what is special about spatial data?
geospatial data are measured and represented to maintain a number of specific properties, relationships and structures.
Consider, for example, the heterogeneity of space where oceans and seas radically differ from continents and islands, mountains are very different from valleys, forests differ from deserts, coastal areas differ from inland regions, urban areas differ from rural areas, countries differ from each other, and so on. Spatial processes operate differently in different places, spatial relationships may differ in different places and according to direction, and so measurements relating to these processes and relationships need to be interpreted in the context of location.
A second feature of spatial data is inherent spatial autocorrelation as expressed by Tobler’s well known first law of geography, “Everything is related to everything else, but near things are more related than distant things” (Tobler, 1970, p.236). Some geographic phenomena may vary relatively smoothly across space in most circumstances (i.e., elevation or population density) and others are characterized by significant discontinuities and irregularities (i.e., landcover or rates of taxation). Autocorrelation in time is also relevant to temporal phenomena. In other words, if features are similar in location (time) they are often also similar in attributes. Some phenomena and processes occur concurrently in geographic space but at different points in time – and vice versa.
A third important aspect of geographic datasets is the need to consider the scale at which phenomena exist and the level of detail used to digitally represent them. Geo-spatial analysts and decision-makers are increasingly aware that the scale and nature of the spatial and temporal units used to model geographic phenomena will have a significant effect on the analysis undertaken and results that are subsequently reported.
These characteristics of geographic information mean that standard statistical techniques requiring independence of variables are often not suitable for spatio-temporal data analysis. They also mean that distances in geographic space are not necessarily synonymous with Euclidean distances on a plane or in an abstract three-dimensional space. They may be affected by the heterogeneity of space and spatial objects, phenomena and events. To be meaningful, geographical distances have to be defined and interpreted in problem and / or context specific manners. A variety of means of measuring ‘similarity’ in two and three dimensional spatial contexts can be applied in spatial analysis and may include decays based upon Euclidean distances or more sophisticated measurements associated with the costs of movement between locations. Examples include the use of topological or metric network distance in transportation contexts, the consideration of perceived vs. actual distances in map displays, functional distances that might be expressed as travel costs or travel times in a commuting context, etc.
embed geospatial data and any kind of derived structures within their geographical context, which may be provided by a cartographic depiction of the environment - a map.
The main reason is that the heterogeneity of the space and the variety of properties and relationships occurring within it cannot be adequately represented for fully automatic processing - there are limitations to what can be achieved solely through computation. The exploration and informed analysis of geospatial data and the derivation of knowledge from it therefore relies heavily upon the human analyst’s sense of the space and place, tacit knowledge of their inherent properties and relationships, and space / place -related experiences. These are incorporated into visual geo-spatial analysis through the use of an appropriate representation of the space that serves as an adequate model of reality and prompt to it through which an informed user can interpret data associated with a space and its places. For example, a map allows a human analyst to recognize familiar places, types of spatial objects, groups of features and structures. A skilled analyst can perceive typical spatial relationships and patterns and associate them with relevant background knowledge of places and likely geographic processes.
The spatial nature of data recorded in the geo-sciences and the importance and complexity of spatial relationships between entities and variables has resulted in a strong visualization tradition upon which we can draw. Simply plotting data on a suitable background map or image will not necessarily be effective however. A good map does not just convey data in its geographical context, but also serves as an instrument of generalization and summarization, helping a user to see the forest for the trees. Whilst an air photograph or satellite image may be data rich, a well designed topographic map may effectively present abstract information that reveals unseen patterns not directly visible in the landscape. Interaction with a thematic value-by-area map, such as a representation of election results combined with socio-demographic data, may draw attention to hidden patterns that were not evident in aspatial representations of the data.
In short, successful, effective, efficient and appropriate visualization of geospatial information requires knowledge of fundamental geographic concepts and expertise in longstanding principles of mapping, which are well documented in the respective geographic information science and cartographic literature. This tradition continues - the best paper prize at AGILE 2008 was awarded to a visualization contribution that computes multiple perspective 3d views in real time (Lorenz et al., 2008).
Geo-spatial analysts and decision-makers are increasingly aware that ways in which the properties of geographic information are used to model geographic phenomena have a significant effect on any analysis undertaken and results that are subsequently reported. The kinds of exploratory methods introduced here can help analysts consider alternative assumptions and support them in investigating the sensitivities of results to variations in scale and summarization – for example by varying the spatial and temporal units used to aggregate and model geographic phenomena. The effects of these variations may themselves vary in space and over time and be visualized.
Organisations that support Cartography and GIScience and their related meetings – for example
• ICA / ACI – the International Cartographic Association http://www.icaci.org/
• AGILE – the Association of Geographic Information Laboratories for Europe:
http://www.agile-online.org/
• GIScience – the International Conference on Geographic Information Science: http://www.giscience.org/
Academic journals in the disciplines – for example
• IJGIS - International Journal of Geographical Information Science (Taylor & Francis):
http://www.tandf.co.uk/journals/tf/13658816.html
• CaGIS - Cartography and Geographic Information Science (the American Congress on Surveying and Mapping):
http://tinyurl.com/5f2o5f
• Cartographica: The International Journal for Geographic Information and Geovisualization (University of Toronto Press Journals):
http://www.utpjournals.com/carto/carto.html • The Cartographic Journal (Maney Publishing)
http://www.maney.co.uk/search?fwaction=show&fwid=152
Accessible texts that document cartographic knowledge and its use in visualization – for example
• MacEachren, A.M. (1995) How Maps Work: Representation, Visualization, and Design, Guildford Press, 513 pp.
• Robinson, A.H., Morrison, J.L., Muehrcke, P.C., and Kimerling, J.A. (1995) Elements of Cartography: 6th Edition, John Wiley & Sons, 688 pp.
• Slocum, T.A., McMaster, R.B, Kessler, F.C. and Howard, H.H. (2008) Thematic Cartography and Geovisualization, Prentice Hall, 576 pp.
• Kraak, M-J. and Ormeling, F. (2003). Cartography: Visualization of Spatial Data. 2nd Edition. Prentice Hall, 205 pp.
• Andrienko, N and Andrienko, G., 2005, Exploratory Analysis of Spatial and Temporal Data: A Systematic Approach, Springer-Verlag Berlin, 703 pp.
depiction’ of a data set in a spatial graphic designed to support analysts and interpreters in visually extracting significant spatio-temporal patterns to gain information, new ideas and knowledge. A variety of methods have been developed, combined, augmented and evaluated by cartographers in a range of experimental and applied contexts. These include a range of innovative static and animated 2D maps, 3D space-time cubes, interactive query and display interfaces, and coordinated multiple views where maps are combined with time graphs and other non-cartographic data displays. Andrienko et al. (2003) provide a review of these and other techniques for the exploratory analysis of spatio-temporal data. A number of new techniques developed using the ‘direct depiction’ approach are detailed in this collection of papers. The approaches that involve higher levels of abstraction maintain and enhance a cartographic tradition of transformations through which data are abstracted (through aggregation, selection, generalization and the like) and then symbolized by, as we have noted, drawing upon computational methods from other domains.
Advancing the geovisualization of dynamics, movement and
change: The workshop and this special issue
Our workshop was co-organised by the ICA Commission on Geovisualization and AGILE to promote, develop and report upon the use of cartography in its widest sense in the exploration and analysis of spatial information through interactive visual interfaces. Active participation by colleagues from both broad communities provided plenty of scope for discussion between cartographers, visual analysts, visualization developers and geographic information scientists with a range of experience and expertise in using graphics and spatio-temporal information and in studying spatio-temporal phenomena in a variety of application domains. This multi-disciplinary and international workshop might be considered an example of organisational good practice in the context of the needs identified to support and develop common approaches in current visualization research as we develop new ways of visually analysing dynamism, movement and change. It involved cross-disciplinary cooperation and supported the cross-disciplinary penetration of accumulated knowledge as we move towards this aim.
The original call for papers attracted 26 extended abstracts from colleagues across the globe with a broad range of disciplinary backgrounds and interests. An editorial panel consisting of five Commission members selected 20 of these to be presented at the workshop. Presentations were selected on the basis of their quality and relevance to the call for participation and were followed by mediated discussion. The abstracts and slides of the presentations are available on the workshop web site - http://geoanalytics.net/GeoVis08/.
eight full papers that reflect a 31% acceptance rate for the entire review process. Two of the submitted full papers were co-authored by members of the guest editorial panel. These papers were handled directly by the editor-in-chief of the journal following their submission.
We are very grateful to the reviewers and the authors for their diligent and extremely efficient work. It is notable that the reviewers not only carefully scrutinized papers, but also gave very valuable and concrete recommendations to authors for improving their submissions. As a result, authors could work more efficiently on making appropriate revisions to develop their work and its presentation
Paper 1 - “Exploring the Spatio-temporal Dynamics of Geographical Processes with Geographically Weighted Regression and Geovisual Analytics” by Urška Demšar, Stewart Fotheringham, and Martin Charlton.
Spatial statistics are combined with data mining and visualization to support the exploration of spatially referenced time-series data. A noteworthy feature of the work is that the methodology is verified through application to a dataset with previously known patterns. In terms of the visualization research topics that we identify in Figure 2, Demšar et al deal with patterns: computing (methods + evaluation), visualization (methods).
The three papers that follow deal with methods for the analysis of movement, which was the most popular theme at the workshop.
Paper 2 - “Activities, Ringmaps and Geovisualization of Large Human Movement Fields” by Jinfeng Zhao and Pip Forer
Novel techniques for studying movements of people in relation to their activities are suggested. Computational processing precedes the visualization and includes dimensionality reduction, aggregation, and pattern extraction. An innovative visualization technique is introduced - the Ringmap - which presents computationally derived aggregates and patterns through a polar coordinate system with angle relating to cyclical time and distance representing other variables that may include ordinal representations of spatial relationships. Zhao and her colleagues are concerned with summaries: computing, visualization, interaction (methods, no evaluation).
Paper 3 - “Using Treemaps for Variable Selection in Spatio-Temporal Visualization” by Aidan Slingsby, Jason Dykes, and Jo Wood
Treemaps are adapted with novel methods of node ordering and interactive facilities to provide graphical depictions of summaries for the visualization of large multivariate spatio-temporal data sets. This applied work includes a design relating to data about movement that relates spatial, temporal and attribute aggregations and spatially generalized entities. The research contribution focuses on a design that provides access to structured summaries: computing, visualization, interaction (methods) some elements of interaction with summarised data (querying, focusing).
A cross-disciplinary research team consisting of authors with backgrounds and associated expertise in data mining and visualization combines techniques from these two domains to explore large datasets of movement tracks. Clustering techniques are adjusted to a special stepwise way of analyzing complex spatio-temporal objects characterized by multiple heterogeneous properties. The team’s research focus is on patterns: computing, visualization (methods, evaluation of sensitivity and scalability of computations) and some elements of interaction with elementary data (querying, focusing).
Paper 5 - “Towards a Taxonomy of Movement Patterns” by Somayeh Dodge, Robert Weibel, and Anna-Katharina Lautenschütz
The three contributions describing new methods for analyzing movement data are followed by a theoretical contribution that defines various types of patterns that can exist in movement data. The authors have collected existing definitions of pattern types and suggest a conceptual framework for building a comprehensive movement taxonomy. To facilitate the further development of the taxonomy, the authors have established a wiki where researchers can directly contribute to this evolving taxonomic effort - http://movementpatterns.pbwiki.com/. Involvement in this type of endeavor will support the kinds of multidisciplinary activity required to achieve the advances in visualization described here. In terms of our approaches and associated research topics paper 5 has a unique focus within this special issue on patterns: theory.
Paper 6 - “A Chorem-based Approach for Visually Synthesizing Complex Phenomena” by Vincenzo Del Fatto, Robert Laurini, Karla Lopez, Monica Sebillo, and Giuliana Vitiello
Unlike the previous papers, which deal with finding patterns in spatio-temporal data Del Fatto and colleagues contribute a paper on the synthesis and presentation of discovered patterns in a concise and understandable way to end users - decision makers for example. They suggest an approach based on the use of Chorems - schematic depictions of spatial phenomena and processes known in geography and cartography since the 1960s. Paper 6 describes how highly abstracted maps, conveying only the most essential information, and thus omitting unnecessary detail, can be generated in a semi-automatic manner from the outcomes of computational data processing, including data mining and database queries. As such the research contribution can be categorized as dealing with patterns: visualization (methods, no evaluation) and some theory involving the discussion of a number of generic pattern types (flow, tropism, and diffusion).
Paper 7 - “A Temporal Focus + Context Visualization Model for Handling Valid-Time Spatial Information” by Alexandre Carvalho, A. Augusto de Sousa, Cristina Ribeiro, and Emília Costa
consider this a contribution relating to direct depiction: visualization, interaction (focusing) .
Paper 8 - “Understanding Geospatial Interests by Visualising Map Interaction Behaviour” by Eoin Mac Aoidh, Michela Bertolotto, and David C. Wilson
Here the authors argue that valuable behavioral information can be gained for improving highly interactive visual analysis tools by tracking user-display interaction behaviors such as mouse movements during complex spatial data exploration. This information can later be used for personalizing visualization tools to provide better support to a varied user base and make users’ work more effective and efficient. A system that captures users’ mouse movements and interface interactions and consequently visualizes the behavioral data to better enable the analysis of this behavior is described. The system includes an algorithm for determining the degrees of relevance of various visual objects to a particular user on the basis of his / her display interactions. Mac Aoidh and colleagues’ work contributes methods relating to direct depiction: visualization, interaction (querying, focusing), evaluation (usability).
This collection of eight papers addresses a wide range of research issues within the domain of Geovisualization and draws attention to a range of topics, approaches and research issues. We use this introduction to demonstrate the close links between Information Visualization and Geovisualization and argue that cross-disciplinarity is key to the advancement of our sciences. Indeed, this publication aims to continue and enhance knowledge transfer between communities such as that reported in ‘Exploring Geovisualization’ (Dykes et al., 2005).
We anticipate and look forward to increasing synergies between the disciplines and hope that this collection of papers and review of key issues and approaches in visualization research will be interesting and useful not only for those primarily involved with the analysis and/or visualization of spatial data, but also for a more general information visualization audience. We encourage active participation in the activities of the ICA Commission on Geovisualization and AGILE and invite colleagues who are using geo-spatial data and interested in a visual approach to their analysis to contribute to and participate in future activities.
References
Andrienko, N., Andrienko, G., & Gatalsky, P. (2003): Exploratory Spatio-Temporal Visualization: an Analytical Review. Journal of Visual Languages and Computing, 14 (6): 503-541
Anselin, L. (1989): What Is Special about Spatial Data? Alternative Perspectives on Spatial Data Analysis. Technical Report 89-4. Santa Barbara, CA: National Center for Geographic Information and Analysis.
Lorenz, H., Trapp, M., Döllner, J. and Jobst, M. (2008) Interactive Multi-Perspective Views of Virtual 3D Landscape and City Models, in Bernard, L., Friis-Christensen, A., Pundt, H. (eds.) The European Information Society - Taking Geoinformation Science One Step Further (Proceedings AGILE 2008), Springer Berlin Heidelberg, 301-321
Purchase, H.C., Andrienko, N., Jankun-Kelly, T.J., & Ward. M. (2008): Theoretical Foundations of Information Visualization. In Kerren, A., Stasko, J.T., Fekete, J.-D., & North, C. (Eds.): Information Visualization - Human-Centered Issues and Perspectives. Vol. 4950 of LNCS State-of-the-Art Survey, Berlin: Springer
Tobler, W. R. (1970): "A computer movie simulating urban growth in the Detroit region". Economic Geography, 46(2): 234-240.