THE INFLUENCE OF COUPLING AGENT, FIBRE SIZING AND
MATRIX DEGRADATION ON THE INTERFACIAL SHEAR
STRENGTH BETWEEN CARBON FIBRE AND POLYPROPYLENE
D. T. Burn1, L. T. Harper∗1, M. Johnson1, N.A. Warrior1, L. Yang2, J. Thomason2
1School of Mechanical, Materials and Manufacturing Engineering, University of Nottingham, The
ITRC Building, University Park, Nottingham, NG7 2RD, UK
2Department of Mechanical Engineering, University of Strathclyde, 75 Montrose Street, Glasgow, G1
1XJ, UK
∗Corresponding Author: [email protected]
Keywords: Carbon fibre, Thermoplastic matrix, Interfacial shear strength, Microbond,
Abstract
The interface strength between carbon fibre (CF) and polypropylene (PP) was characterised using the microbond test. The effect of removing the sizing from the fibres, as well as intro-ducing a maleic anhydride grafted polypropylene (MAPP) coupling agent were investigated. The polymer was found to degrade when prepared under atmospheric conditions, and therefore droplets were formed in a nitrogen purged oven for subsequent studies. The removal of the sizing from the fibre using pyrolysis and solvolysis techniques had little influence on the appar-ent interfacial shear strength (IFSS), suggesting that the IFSS for recovered fibres is similar to that of virgin fibres. Introducing a maleic anhydride coupling agent at 2wt% had the largest influence on the interface strength, increasing it by 320%.
1. Introduction
Thermoplastic composites used in the automotive industry are primarily injection moulded to yield short cycle times, but this processing route limits fibre length and therefore ultimate me-chanical properties of the composite. Long fibre Thermoplastics (LFTs) are able to maintain a longer fibre length due to a less aggressive processing route. One of the main limitations with these materials is that in-mould melt flow distances can be quite large, limiting fibre volume fractions to around 20-30% [1]. Higher volume fractions can be achieved by bundling the fibres into tows to increase the packing density. The Dieffenbacher LFT-D process exploits this by introducing glass rovings after the polymer has been processed through a twin-screw extruder, reducing processing damage to the fibres.
The high manufacturing costs associated with producing carbon fibre limit applications to niche areas where mechanical properties and mass reduction are of paramount importance. Studies have shown that recycling carbon fibre would reduce the cost by almost 50% compared to the virgin fibre [2]. It therefore seems appropriate to combine these fibres with low cost polymers such as polypropylene.
inherent property of the polyolefin group is that they are nonpolar which means that they have a low chemical affinity with other materials, therefore much of the interface strength is provided by mechanical interlocking and compressive residual stresses created during cooling. Addition-ally, carbon fibre is coated with an epoxy compatible sizing, which may not be compatible with thermoplastic matrices. The introduction of coupling agents can increase the mechanical prop-erties of composites manufactured with polyolefin matrices by promoting chemical interaction with the fibre. [3].
The mechanical performance of the composite at the macro-scale is heavily influenced by the micro-scale interface, which governs the stress transfer capability of fibre reinforced compos-ites. Additionally, the strength of the interface determines the composite failure mode; for example, fibre pull-out versus fibre fracture. In the literature a number of methods have been used to quantify the interface for fibre reinforced composites, however there is a debate over the repeatability of data between research groups and test methods [4].
There has been no standardised method developed for composites interface testing, which is the primary cause for data scatter in the literature and has prevented ratification of individual results. In general, interface testing is therefore used as a qualitative method to assess the effect of processing.
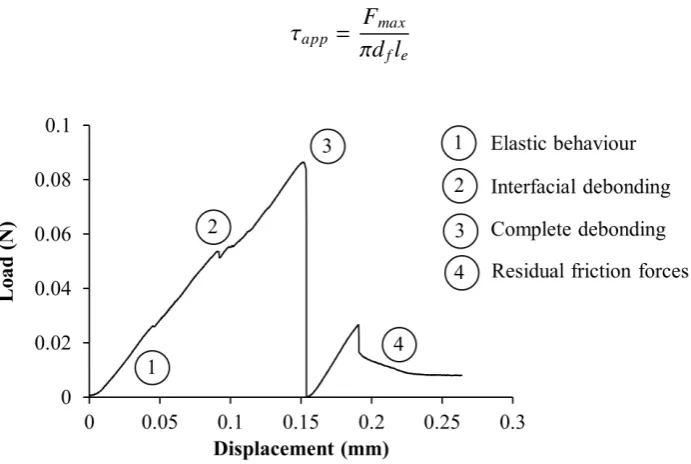
Of the tests adopted the microbond test has been widely researched, with a number of au-thors conducting FE analysis on experimental parameters to reduce data scatter [5]. A typical microbond force-displacement plot is shown in figure 1, the large reduction in force (at 3) is as-sumed to be complete interfacial debonding and the peak force is used to calculate the apparent interfacial shear stress (IFSS) using equation (1). Fmax is the maximum force anddf andle are
the fibre diameter and embedded length respectively.
τapp = Fmax
πdfle
[image:2.595.122.468.455.687.2](1)
Figure 1.Microbond force-displacement plot for CF/MAPP
elastic, although some authors have noted that for thermoplastic systems this may not be the case [7]. Further inspection by the authors showed that plastic deformation had occurred potentially invalidating the results.
2. Experimental
2.1. Materials
T700SC-60E 12k tow carbon fibre, supplied by Toray Co., ltd, was used as the reinforcement as it is widely used in commercial automotive applications. An isotactic homopolymer polypropy-lene (576P), supplied by Sabic, with a melt flow index of 19g/10min (at 230◦C and 2.16kg), was used as the matrix, supplied in pellet form. A maleic anhydride grafted polypropylene cou-pling agent (G3015) was supplied by Eastman, UK in granular form and in all cases was mixed with the polypropylene at 2wt.%. For the benchmark epoxy microbond samples, a development epoxy powder system (DLS1776) was provided by Hexcel, UK.
2.2. Sample Preparation
Three fibre permutations were used for the study; virgin T700 fibre, a pseudo-recycled fibre where the sizing was removed by pyrolysis (CFP) and a pseudo-recycled fibre, where the sizing was removed by solvolysis (CFS) in accordance with [8] and the manufacturers guidelines. The CFP fibres were heated in a furnace to 550◦C for 15 minutes, and subsequently put in a water bath in an ultrasonic cleaner for 30 minutes, before being dried at 80◦C for a week. For the CFS fibres, 2g of virgin T700 carbon fibre were soaked in 100cm3 of acetone for a week at room temperature. The fibres were then washed three times using fresh acetone, and then refluxed in 200cm3 of boiling tetrahydrofuran (THF) for 72hrs. The fibres were washed a further three times with fresh THF, and then dried at 80◦C for a week.
The maleic anhydride was mixed with the PP at 2wt.% in a Prism TSE twin screw extruder at 200◦C. The screw speed was 120rpm and the feeder speed was set to 80rpm. The extruded material was subsequently pelletised.
The method for producing carbon fibre/polypropylene samples was the same as in [4]. The droplets were formed in a nitrogen-purged oven for the non-degraded samples and under atmo-spheric conditions for the degraded samples. The oven temperature was set at 220◦C and the
samples were kept at this temperature for 5 minutes.
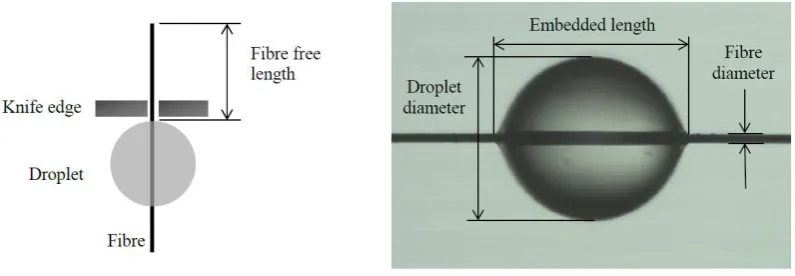
A different method was used to prepare the carbon fibre/epoxy samples. The epoxy used was B-staged, enabling it to be melted and pulled into a fibre without curing. The epoxy was much more brittle than PP which prevented it from being tied onto the carbon fibre. A soldering iron was used to apply heat to a epoxy strand, making it coil around the fibre, to secure it in place. These samples were transferred to a preheated oven at 125◦C to cure for 25 minutes, in accordance with the manufacturer’s cure cycle. Once the droplets were produced, the samples were transferred to card tabs to control the fibre free length, which was kept constant at 20mm (Figure 2) and allow alignment with the fibre in the loading direction.
A Veeco Dimension 3000 SPM system atomic force microscope (AFM) was used to measure the surface roughness of the recovered fibres. The AFM was used in tapping mode and a scan area of 1.5 x 1.5µm was measured for each sample. 12 scans were carried out for each fibre type, with 2 scans per fibre. An open-source analysis package (Gwyddion) was used to analyse the output and calculate the Raand Rzvalues. The background of the fibre was removed by a 2nd
order polynomial algorithm and the Ra and Rzvalues were calculated using a moving average
calculation.
2.3. Experimental Apparatus and Procedure
The card tabs were suspended from the punched hole, onto a steel hook attached to a 10N load cell on an Instron tensile testing machine (Model 3342) during the microbond test. A fixture [4] comprising two knife edges, which are movable by micrometer heads, constrain the droplet vertically. The knife edge separation could be finely controlled by the micrometers and was kept constant for each test. Positioning of the knife edges was aided by the use of a stereo microscope at x45 magnification. Initially the knife edge separation was 7µm, (i.e. the diameter of the fibre), however it was later found that for some tests the knife edges were damaging the fibres and causing premature failure in the samples. The knife edge separation was therefore increased to 10µm and the test was carried out at a constant rate of 0.1mm/min. Non-axisymmetric samples and samples that failed by fibre failure were not included in the results.
[image:4.595.96.494.486.624.2]After testing the samples were re-examined under a microscope to check pure debonding had occurred and for re-measurements of the embedded length. Approximately 20 test were used to obtain the IFSS value.
Figure 2.microbond test set-up (left), CF/Epoxy droplet viewed by microscopy (right)
3. Results and Discussion
Sample IFSS
Average St dev.
CF/PP (degraded) 3.6 1.5
CF/PP (non-degraded) 7.7 1.4
CFP/PP 8.1 1.7
CFS/PP 10.3 0.9
CF/MAPP 32.3 3.8
CFP/MAPP 35.2 2.9
CFS/MAPP 35.4 4.9
[image:5.595.153.443.85.234.2]CF/Epoxy (benchmark) 45.8 5.0
Table 1.Summary of interfacial shear strengths for tested droplets
3.1. The effect of degradation
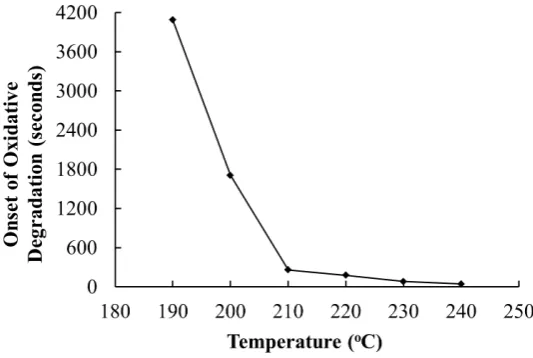
[image:5.595.163.430.447.626.2]Figure 3 shows the effect of oven temperature on the oxidation induction time (OIT) of the polypropylene used in this study. Considering most microdroplet samples are prepared at tem-peratures close to 220◦C, and the OIT reduces from 68.15mins to 2.97mins between 190 and 220◦C, it suggests that some thermal degradation may occur during processing. This is accen-tuated, as precise temperature control may not be possible when inserting specimens into a hot oven. Assuming the temperature of the oven drops when the door is opened to insert specimens, the temperature may then overshoot during the heating phase. An increase in temperature of 10◦C to 230◦C, reduces the OIT to 1.35mins.
Figure 3.Oxidative induction time for polypropylene (Sabic 576P)
3.2. The effect of using a coupling agent
Introducing MAPP at 2 wt.% increased the IFSS by 320% from 7.69MPa±1.36 to 32.25MPa±3.82, which is much higher than other values reported in the literature for a similar system [11]. For the CF/PP samples to have an interface strength similar to that of CF/epoxy, suggests that some chemical bonding has occurred with the addition of the coupling agent.
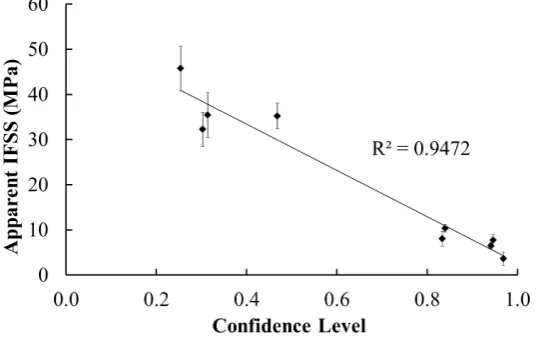
[image:6.595.163.435.309.479.2]The confidence in the IFSS value has been found to decrease as the IFSS increases, the ratio of successful tests to unsuccessful tests (confidence level) for the CF/MAPP samples was very low compared to the CF/PP samples, with almost 70% of the samples failing by fibre breakage. This suggests that the average values of the successful test are therefore lower bound results, as samples with higher interface strengths failed by fibre breakage as opposed to interface failure. Samples that failed in the fibre were discounted from the average IFSS calculation. Figure 4 shows the relationship between confidence level and the IFSS for the studies that have been performed in this paper.
Figure 4.Relationship between confidence level of successful test and IFSS
3.3. The effect of fibre sizing
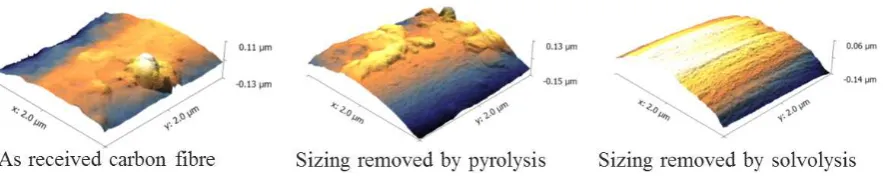
Removing the sizing marginally increased the interface strength, for both the pyrolysis and solvolysis samples without MAPP. The IFSS were 8.05MPa±1.66 and 10.33MPa±0.89 respec-tively and with maleic anhydride they were 35.43MPa±4.99 and 35.21MPa±2.88 respectively. For the samples with no MAPP, the interface strength may have been increased due to further mechanical interlocking between the fibre and matrix. Atomic force microscopy was carried out to quantify the change in surface roughness with the two sizing removal techniques. The re-sults of the AFM are shown in Table 2, and sample topologies of the fibres are shown in figure 5.
The pyrolysis samples and as-received fibre samples have similar Ra values which can be
This is significant for the microbond test method, especially where mechanical interlocking dominates the IFSS, as these uneven surfaces lead to further data scatter. At the macroscale, this would not be apparent as fibres usually remain in tow form, but this may require further in-vestigation to quantify the effect on the IFSS. The interface strength for the samples with maleic anhydride appears to be dominated by chemical coupling, although the IFSS values for both the pyrolysis and solvolysis samples were 10% higher than the received fibre. This unlikely to be explained by the surface roughness of the fibres however, as there is not a significant difference between the Raand Rzvalues.
Fibre Treatment Ra (µm) Rz(µm)
Average St dev. Average St dev.
As Received 6.92 4.66 18.63 11.97
CFP 7.18 6.65 16.17 8.26
[image:7.595.80.522.352.441.2]CFS 4.04 2.65 12.37 7.00
Table 2.Results from AFM microscopy on the surface roughness of the fibres
Figure 5.Sample AFM images for each fibre permutation
4. Conclusions
The objective of this study was to investigate the adhesion between carbon fibre and polypropy-lene. The importance in understanding interactions at the microscale is paramount as ultimately these properties affect the macroscale mechanical properties. The potential future use of recy-cled fibre has prompted whether lower cost thermoplastic matrices, with low cycle times and high chemical resistance can be utilised. The removal of fibre sizing by pyrolysis yielded at 5% increase in the IFSS, and sizing removal by solvolysis increased the IFSS by 34%. This demonstrates that recovered fibres may not need additional sizing to be added to be effective with this polymer. The addition of maleic anhydride had the largest effect on the IFSS, with a 320% increase over the base polymer. The value of the IFSS for the maleic anhydride modified samples was much higher than other values reported for similar systems in the literature, which suggests that other authors may have tested degraded samples.
References
[1] S. Troster O. Geiger P. Eyerer W. Krause, F. Henning. LFT-D - A process technology for large scale production of fiber reinforced thermoplastic components. Journal of Thermo-plastic Composite Materials, 16:289–302, 2003.
[2] S. Pimenta and S.T. Pinho. Recycling carbon fibre reinforced polymers for structural applications - technology review and market outlook. Waste management, 31(2):378–92, February 2011.
[3] N.G. Karsli and A. Aytac. Effects of maleated polypropylene on the morphology, ther-mal and mechanical properties of short carbon fiber reinforced polypropylene composites.
Materials&Design, 32(7):4069–4073, August 2011.
[4] L. Yang and J.L. Thomason. Development and application of micromechanical techniques for characterising interfacial shear strength in fibre-thermoplastic composites. Polymer Testing, 31(7):895–903, October 2012.
[5] G. Pandey, C.H. Kareliya, and R.P. Singh. A study of the effect of experimental test pa-rameters on data scatter in microbond testing.Journal of Composite Materials, 46(3):275– 284, October 2011.
[6] S. Zhandarov. Characterization of fiber/matrix interface strength: applicability of different tests, approaches and parameters. Composites Science and Technology, 65(1):149–160, January 2005.
[7] P. Zinck, H.D. Wagner, L. Salmon, and J.F. Gerard. Are microcomposites realistic models of the fibre/matrix interface? I. Micromechanical modelling. Polymer, 42:5401–5413, 2001.
[8] G. Jiang, S. Pickering, E. Lester, T. Turner, K. Wong, and N. Warrior. Characterisation of carbon fibres recycled from carbon fibre/epoxy resin composites using supercritical n-propanol. Composites Science and Technology, 69(2):192–198, February 2009.
[9] Z. Dai, F. Shi, B. Zhang, M. Li, and Z. Zhang. Effect of sizing on carbon fiber surface properties and fibers/epoxy interfacial adhesion. Applied Surface Science, 257(15):6980– 6985, May 2011.
[10] L. Yao, M. Li, Q. Wu, Z. Dai, Y. Gu, Y. Li, and Z. Zhang. Comparison of sizing effect of T700 grade carbon fiber on interfacial properties of fiber/BMI and fiber/epoxy. Applied Surface Science, 263:326–333, 2012.