City, University of London Institutional Repository
Citation
:
Hickey, M. & Kyriacou, P. A. (2007). Development of a new splanchnic perfusion
sensor. Paper presented at the 29th Annual International Conference of the IEEE
Engineering in Medicine and Biology Society, 22-26 Aug 2007, Lyon, France.
This is the accepted version of the paper.
This version of the publication may differ from the final published
version.
Permanent repository link:
http://openaccess.city.ac.uk/14299/
Link to published version
:
http://dx.doi.org/10.1109/IEMBS.2007.4352948
Copyright and reuse:
City Research Online aims to make research
outputs of City, University of London available to a wider audience.
Copyright and Moral Rights remain with the author(s) and/or copyright
holders. URLs from City Research Online may be freely distributed and
linked to.
City Research Online:
http://openaccess.city.ac.uk/
publications@city.ac.uk
Abstract— the continuous monitoring of splanchnic organ
oxygen saturation (SpO2) would make the early detection of
inadequate tissue oxygenation feasible, reducing the risk of hypoperfusion, severe ischemia, multiple organ failure, and, ultimately, death. In an attempt to create a splanchnic SpO2
sensor that can be used intra-operatively, pre-operatively and post-operatively this paper describes the design and technical evaluation of fiber optic based reflectance pulse oximeter sensor and processing system. In a detailed investigation to determine the optimal source-emitter spacing it was found that the optimum separation distance was between 3mm and 6mm. In vivo thermal testing showed that the rise in temperature at the tip of the fiber at both wavelengths was insignificant and therefore should have no effect in the splanchnic tissue.
I. INTRODUCTION
PLANCHNIC organs are particularly vulnerable to hypoperfusion [1]. If an organ or tissue is not sufficiently perfused with oxygenated blood, cell death and tissue necrosis can ensue. Failure of one organ due to malperfusion may lead indirectly to the dysfunction of distance organs through the release of various toxins into the portal blood stream [2, 3]. This could result in the onset of multiple organ failure, which is a common cause of morbidity following major surgery [4]. Therefore, a continuous method for monitoring perfusion of the splanchnic area would be invaluable in the early detection of inadequate tissue oxygenation [5].
Current methods for assessing splanchnic perfusion have not been widely accepted for use in the clinical care environment. Techniques such as polarographic oxygen electrodes and positron emission tomography remain research tools [2], while methods such as laser Doppler, Doppler ultrasound [6, 7], and intravenous fluorescein [4] are complex and expensive and none of them directly measures oxygenation. Gastric tonometry is currently considered the only clinically available tool for assessing splanchnic perfusion [8]. However, because it is a heavily operator dependent, time consuming and expensive device, it has not been widely accepted and is still not routinely used [9, 10]. Pulse oximetry has also been used experimentally in the detection of intestinal oxygenation in animals [11, 12]
Manuscript received April 2, 2007. This work was supported in full by the Engineering and Physical Sciences Research Council.
M. Hickey is with the School of Engineering and Mathematical Sciences, City University, London, UK (phone: +44(0)2070403878; e-mail: m.hickey@ city.ac.uk).
P. A. Kyriacou is with the School of Engineering and Mathematical Sciences, City University, London, UK (e-mail: p.kyriacou@city. ac.uk).
where it was found to be a rapid, reproducible, as well as a highly sensitive and specific technique for detecting small bowel ischemia. The use of commercial pulse oximeters for estimating splanchnic perfusion in humans has been found to be impractical (bulky probes, cannot be sterilized, etc). More recently a custom made reflectance pulse oximeter has shown for the first time that good quality photoplethysmographic (PPG) signals can be detected from various human abdominal organs (bowel, kidney, liver) during open labarotomy [1]. However, this probe is not suitable for prolonged continuous monitoring in the abdomen. Therefore, there remains a need for a new sensor technology that is suitable for use in the human abdomen and will allow the continuous measurement of SpO2 in the
splanchnic area pre-operatively, operatively and post-operatively.
In an attempt to overcome the limitations of the current techniques for measuring splanchnic perfusion, this paper describes the design, development and validation of a new fiber-optic sensor and it’s processing system utilizing the principle of reflectance pulse oximetry.
II. METHODS
A. Fiber Optic Sensor
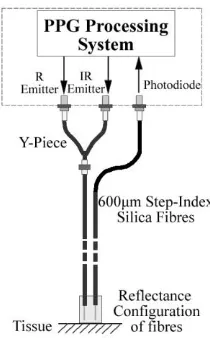
A new reflectance, pulse oximeter sensor was developed, comprising of optical fibers coupled to infrared and red subminiature version A (SMA) mounted emitters (peak emission wavelengths at 850 nm and 650 nm respectively) and a photodiode (single photodiode with an active area of 1 mm2). Silica glass step index fibers with a core of 600 μm were chosen for the transmission and reception of light to the tissue. The fiber was cleaved to achieve a flat surface at 90 degrees to the emitting light. The tip of each fiber was polished with a 5 μm, 3 μm, 1 μm, and 0.3 μm polishing film to ensure that the fiber region was free from large scratches and that there were no chips in the edges of the fiber that extended into the core of the fiber.
In order to facilitate multiplexing of the red and infrared light into a single fiber, a 400 nm bifurcated fiber (Y piece) was used (Ocean Optics, Netherlands). Two ends of the Y-piece were coupled to SMA mounted emitters, while the other end was attached to a prepared 600 μm fiber (Figure 1). This allows for the two wavelengths to be transmitted down a single fiber. A single prepared 600 μm fiber is used to detect the backscattered light.
Development of a New Splanchnic Perfusion Sensor
First M. Hickey and Second P. A. Kyriacou,
Senior
Member, IEEE
B. Processing System
An electrically isolated acquisition and processing system has been designed and developed to drive the optical components of the fiber probe and also to detect and pre-process the red and infrared ac and dc PPG signals. Digitization of the acquired signals was then achieved using a 16-bit data acquisition card from National Instruments. A virtual instrument (VI) implemented in LabView was also developed. The VI provides signals which are required by the hardware for driving the emitters, as well as by the demultiplexer for splitting the mixed signal into its red and infrared components. The VI is also used for the acquisition, displaying, analysis and storing of all acquired PPG signals. A block diagram of the processing system is shown in Figure 2. The emitters, red (R) and infrared (IR), are driven by a software controlled constant current source. It is necessary to multiplex the two emitters so that they are never on at the same time. By utilizing the two counter output channels on the DAQ card two multiplexing signals (one for the red emitter and one for the infrared) are created.
The multiplexing frequency and the duty cycle required can be selected by the user on the front panel of the virtual
instrument. Figure 3 shows the two multiplexing signals (R and IR) used in this application with frequencies of 500 Hz and duty cycles of ¼. The red emitters were on for the first quarter cycle, then all emitters were off for the second quarter cycle. The infrared emitters were on for the third quarter cycle, and all were again off for the final quarter cycle.
A third signal is also generated by the VI, and is represented in Figure 2 as a voltage signal. This signal allows the user to control the intensities of the emitters at all times during use. By altering the voltage applied to the positive input of the current source, the drive current to the emitters can be changed. The required emitter current can be selected by the user on the front panel of the VI, and by taking into account the configuration and component values of the constant current source, the required voltage is calculated and is generated on an analog output port of the DAQ card.
[image:3.612.122.227.60.229.2]The photodetector detects the energy backscattered by the tissue and gives an output current proportional to the detected light intensity. The output of the current-to-voltage (I-V) differential amplifier contains multiplexed PPG signals corresponding to red and infrared wavelengths. The signal from the current-to-voltage differential amplifier passes to a demultiplexer synchronized to the multiplexing signals from the VI, which separate the red and infrared signals. The two signals (R and IR) pass through an isolation barrier which has been included for increased patient safety. These isolated signals are then filtered to extract the ac and dc PPG components for each wavelength. The output PPG signals are digitized and further analyzed by the VI. PPG traces corresponding to infrared and red wavelengths are obtained simultaneously and displayed on the personal computer screen. All acquired signals are also saved in spreadsheet format for further post processing and analysis.
[image:3.612.330.536.168.294.2]Fig. 1. Reflectance configuration of fiber-optic pulse oximeter probe.
Fig. 2. Block Diagram of the processing system.
[image:3.612.61.289.534.676.2]C. Experiments
Source-detector separation is of great significance in designing a reflectance pulse oximeter sensor as it bears a direct impact on the quality of the PPG signal and the accurate estimation of SpO2 [13]. Prior to finalizing the
sensor design, a detailed investigation was conducted to examine the effect of source detector separation on PPG signals and to ultimately establish the optimum separation distance between the light emitting and receiving fiber.
In order to conduct this experiment, a precision drilled perspex finger piece was designed to allow for the placement of the fibers at various distances. All separation distances given are from the centre of the emitting fiber to the centre of the detecting fiber. During the experiment, PPG signals obtained from the finger at both wavelengths were recorded simultaneously while varying the separation between emitter and detector at 1 mm increments (range: 1-8 mm). During the experiment the emitter current was maintained constant at 40 mA.
The operating current of the emitters is relatively low (40 mA) and the use of fiber optics ensures that the emitters are not in direct contact with the skin. However, it was still necessary to confirm that the red and infrared sources would not cause any direct thermal damage to the splanchnic tissue. An in vivo temperature test was conducted to investigate the possibility of excessive temperature rises in the splanchnic area during PPG measurements.
III. RESULTS
Photoplethysmographic signals of good quality were recorded at both wavelengths at all separation distances between the transmitting and receiving fibers. Figure 4 depicts typical finger ac PPG traces at various separation distances.
Although PPG traces were detected at almost all separation distances, there were significant differences in signal amplitude, and morphology at the various monitoring separations. Large amplitude PPG signals were acquired at 1 mm separation. However, these signals were of very poor quality (very noisy) and erratic with little resemblance of a conventional PPG signal. Signals within the range of 2 mm to 6 mm produced PPGs of good quality with large amplitudes and high signal-to-noise ratio (SNR). Over 6 mm separation distance the resulted ac PPGs were of poor quality and very low amplitude. It can be seen in Figure 5 that the PPG amplitudes decrease as the separation distance increases. Such a phenomenon is well explained as the transfer of photons to the emitter via the tissue bed decreases as the distance between the emitting source and the receiving source increases.
Fig. 4. Typical amplified AC photoplethysmographic (PPG) traces from the finger at various fiber separation distances. Each signal is offset for illustration purposes.
Separation Distance (mm)
1 2 3 4 5 6 7 8
Me
an
A
C P
P
G
A
mp
lit
ude
0 5 10 15 20 25 30
[image:4.612.334.547.65.246.2]IR R
Fig. 5. Mean PPG ac red and infrared amplitudes for all separation distances
Figure 6 shows the mean dc red and infrared PPG signals for all separation distances. The dc signals at 1-2 mm separation were predominately larger than at other separation distances. This suggests that the source and detecting fibers are too close, and therefore saturating the photodetector.
Separation Distance (mm)
1 2 3 4 5 6 7 8
Mean DC
P
PG
Am
plitude (V)
0 1 2
IR R
[image:4.612.322.558.293.450.2] [image:4.612.327.539.560.713.2]Figure 7 shows the mean ratio and mean SpO2 values for
various separation distances. The linear equation
R
SpO
2
110
25
was used when calculating SpO2values. It can be seen from the graph that SpO2 values
nearing 100% oxygen saturation are acquired for separation distances in the range 3-6mm.
The in vivo temperature test was made on a normal healthy volunteer. In order to simulate conditions in the splanchnic area the emitting fiber optic lead was placed in contact with the mucosa of the cheek inside the mouth. A type K thermocouple was attached adjacent to the fiber tip, and was also in contact with the mucosa of the mouth. The temperature was recorded until a constant baseline was attained. The infrared light emitter was switched on and the temperature was monitored. Steady state conditions were achieved after approximately 5 minutes and monitoring was continued for a further 5 minutes. The measurement was repeated for the red emitter.
It was found that the temperature of the mucosa remained constant at 36.95 deg C, even after the emitters had been switched on. Therefore, the red and infrared light emerging from the emitting fiber have no thermal effect on the mucosa of the mouth, and it can be assumed that they would have negligible or no effect on the tissue of the splanchnic region.
IV. CONCLUSION
A new fiber-optic splanchnic perfusion sensor and processing system has been successfully designed and developed. An experiment to determine the optimum separation distance between the receiving and the transmitting fibers of the sensor was conducted in the laboratory, as well as a test to determine the thermal effect of the emitters on the tissue.
Photoplethysmographic signals acquired at 1 and 2 mm distance between the transmitting and receiving fibers are found to be unsuitable as the resultant ac and dc PPG signals were unrealistic especially at 1 mm where ac PPGs were noisy, and erratic. This is possibly due to the photodetector running close to saturation. Also, these two separation distances produce ratios (Figure 7) which represent complete
erroneous values of SpO2. Separation distances between 3
and 6 mm produced PPG signals of good quality that yielded ratio values which represented more realistic blood oxygen saturation values. PPG signals above 6 mm separation produced weak signals of low amplitude. Such signals will be unreliable in the estimation of blood oxygen saturation and, therefore, such distances between transmitting and receiving fibers should be avoided.
The results of the in-vivo temperature test showed that the red and infrared emitters had no thermal effect on the mucosa of the mouth. It can be assumed from this result, that the probe will not cause any thermal damage to the tissue of the splanchnic region.
In conclusion this work details the initial design and development of a new splanchnic pulse oximetry sensor, and suggests that it might be feasible to create a sensor that can be used pre-operatively, intra-operatively, and post-operatively. Further studies will be conducted to verify the use and ability of this sensor in a clinical setting.
REFERENCES
[1] A.J. Crerar-Gilbert, P.A. Kyriacou, D.P. Jones and R.M. Langford, “Assessment of photoplethysmographic signals for the determination of splanchnic oxygen saturation in humans”, Anaesthesia, vol. 57, pp. 442-445, 2002.
[2] D. Rittoo, P. Gosling, C. Bonnici et al, “Splanchnic oxygenation in patients undergoing abdominal aortic aneurysm repair and volume expansion with eloHAES”, Cardiovascular Surgery, vol. 10, pp. 128-133, 2002.
[3] T. Koch, S. Geiger and M.J.R. Ragaller, “Monitoring of Organ Dysfunction in Sepsis/Systemic Inflammatory Response Syndrome: Novel Strategies”, J AM Soc Nephrol, vol. 12, pp. S53-S59, 2001. [4] Jury of the Consensus, “Tissue Hypoxia: How to detect, how to
correct, how to prevent?”, Intensive Care Med, vol. 22, pp. 1250-1257, 1996.
[5] D.R. Dantzker, “The gastrointestinal tract. The canary of the body?”, JAMA, vol. 270(10), pp. 1247-1248, 1993.
[6] J.J. Ferrara, D.L. Dyess, M. Lasecki, S. Kinsey, C. Donnell, and G. Jurkovich, “Surface Oximetry. A new method to evaluate intestinal perfusion”, The American Surgeon, vol. 54, pp. 10-4, 1988. [7] D. Lynn Dyess, B.W. Bruner, C.A. Donnell, J.J. Ferrara, and R.W.
Powell, “Intraoperative Evaluation of Intestinal Ischemia: A Comparison of Methods”, Southern Medical Journal, vol. 84(8), pp. 966-970, 1991.
[8] P.J. Kinnala, K.T. Kuttila, J.M. Gronroos, T.V. Havia, T.J. Nevalainen, and J.H.A. Niinikoski ,“Splanchnic and Pancreatic Tissue Perfusion in Experimental Acute Pancreatitis”, Scandinavian
Journal of Gastroenterology, vol. 7, pp. 845-849, 2002.
[9] J.J. Kolkman, J.A. Otte , and A.B. Groeneveld, “Gastrointestinal luminal PCO2 tonometry: an update on physiology, methodology and clinical applications”, British Journal of Anaesthesia, vol. 84(1), pp. 74-86, 2000.
[10] M. Haterhill, S.M. Tibby, R. Evan, and L.A. Murdoch, “Gastric tonometry in septic shock”, Archives of Disease in Childhood, vol. 78, pp. 155-158, 1998.
[11] J. DeNobile, P. Guzzetta, and K. Patterson, “Pulse Oximetry as a means of assessing bowel viability”, Journal of Surgical Research, vol. 48, pp. 21-3, 1990.
[12] P. H. MacDonald, P.K. Dinda, I.T. Beck, and C.D. Mercer, “The use of oximetry in determining intestinal blood flow”, Surg. Gynecol.
Obstet., vol. 176, pp. 451-458, 1993.
[13] Y. Mendelson and B.D. Ochs, “Noninvasive Pulse Oximetry Utilising Skin Reflectance Photoplethysmography “, IEEE Transactions on
Biomedical Engineering, vol. 35, pp. 798-805, 1988.
Fig. 7. Mean Ratio and SpO2 values for various separation distances. Fig. 6. Mean