Genetic algorithm applied to the optimization of quantum cascade lasers
with second harmonic generation
A. Gajic´,1,2J. Radovanovic´,1,a)V. Milanovic´,1D. Indjin,3and Z. Ikonic´3 1
School of Electrical Engineering, University of Belgrade, Bulevar kralja Aleksandra 73, 11120 Belgrade, Serbia
2
Telekom Srbija, a.d., Takovska 2, 11000 Belgrade, Serbia 3
School of Electronic and Electrical Engineering, University of Leeds, Leeds LS2 9JT, United Kingdom
(Received 24 December 2013; accepted 24 January 2014; published online 7 February 2014)
A computational model for the optimization of the second order optical nonlinearities in GaInAs/AlInAs quantum cascade laser structures is presented. The set of structure parameters that lead to improved device performance was obtained through the implementation of the Genetic Algorithm. In the following step, the linear and second harmonic generation power were calculated by self-consistently solving the system of rate equations for carriers and photons. This rate equation system included both stimulated and simultaneous double photon absorption processes that occur between the levels relevant for second harmonic generation, and material-dependent effective mass, as well as band nonparabolicity, were taken into account. The developed method is general, in the sense that it can be applied to any higher order effect, which requires the photon density equation to be included. Specifically, we have addressed the optimization of the active region of a double quantum well In0.53Ga0.47As/Al0.48In0.52As structure and presented its output characteristics.VC 2014 AIP Publishing LLC. [http://dx.doi.org/10.1063/1.4864472]
I. INTRODUCTION
The complex structure of quantum cascade lasers (QCLs), consisting of many alternating layers of quantum wells (QWs) and barriers, enables one to shape the intersub-band transitions occurring in these complex devices accord-ing to a particular purpose by simply varyaccord-ing the layer thick-nesses and/or the composition of the constituent materials.1,2 This feature, combined with room temperature operation and a wide range of emission wavelengths, has earned them the flattering title of being one of the most sophisticated and reliable light sources in the infrared and terahertz region of the electromagnetic spectrum.3–9 Their fast development in the past decade led to high performance devices, which have been commercialized by several companies, such as Nanoplus and Alpes Lasers.
However, regardless of the abovementioned advances, reaching the 3–4lm region of the electromagnetic spec-trum has still remained with limited success. A possible solu-tion to this problem would be to use QCLs as strongly nonlinear oscillators, changing the fundamental laser source frequency10–12 by allowing huge optical nonlinearities to take place.13Still, in order for the effect to be observed and utilized, the optical medium must have a large nonlinear sus-ceptibility,14which can be attained by careful tailoring of the QCL energy states and corresponding wavefunctions. This tailoring can be achieved through various optimization tech-niques that can be adapted for heterostructure design, which all rely on finding a set of design parameters that result in optimal device output characteristics.15,16The desired behav-ior is modeled through the so called target function, the
maximization (or minimization) of which is the main task of the adopted optimization technique. The obtained design pa-rameters are then used to calculate the macroscopic parame-ters of the QCL structure such as current density, optical gain or, as in the work presented here, the linear and second harmonic generation (SHG) output power.
The existence of an accurate modeling technique that would be able to closely simulate the physical processes occurring in these complex devices is the essence of successful QCL design. This model needs to include all rel-evant scattering mechanisms that take place in both the optically active and collector (extractor)/injector multi-QW regions of the QCL,17,18as well as the processes describing the stimulated and simultaneous double photon absorption that occur between the second harmonic generation-relevant levels.
In the model that we describe in Secs.II–IV, we wish to address the optimization of the resonant second-order suscep-tibility in a two-QW active region mid-infrared (MIR) QCL.19 The optimal potential profile that maximizes the product of dipole matrix elements (DMEs) relevant to xð2Þ associated
with SHG is obtained via the Genetic algorithm (GA). The output properties of the reference and optimized structure are calculated by using the full self-consistent rate equation model, similar to the one used in our previous work described in Ref.17, but with the difference that the model is extended to include not only sub-band carrier density equations but pho-ton density equations20,21as well. The results of the calcula-tions predict an improvement of the targeted nonlinear optical susceptibility and consequently the nonlinear output power for the optimized design. Both, the reference and optimized de-vice, are designed for fundamental and SHG laser emission at
k9lm andk4.5lm, respectively.
a)Electronic mail: [email protected]
II. THEORETICAL CONSIDERATIONS
A. Genetic algorithm
When one wishes to address the optimization of a device as complex as a QCL, ordinary optimization techniques will not be sufficient enough to escape the trap of finding only the local optima, and more sophisticated optimization techni-ques need to be applied. One of these technitechni-ques is the Genetic Algorithm.
Genetic Algorithms are a family of computational mod-els created with the purpose of solving complex problems by imitating the process that happen in nature during the course of natural evolution. In these algorithms, the solutions to optimization problems are found using a combination of selection, recombination, and mutation.22 An implementa-tion of a genetic algorithm begins with a populaimplementa-tion of typi-cally random chromosomes into which a potential solution to a specific problem is encoded.23 At each step, the genetic algorithm randomly selects individuals from the current pop-ulation and uses them as parents to produce the children for the next generation. Over successive generations, the popula-tion “evolves” toward an optimal solupopula-tion and the “fitness” of a solution is typically defined with respect to the current population. The manner in which the algorithm searches the parameter space with the purpose of finding the optimal solu-tion, as well as its independence on the initial conditions, makes it particularly suitable for applications in which other optimization techniques would have little or limited success, that is problems with discontinuous, nondifferentiable, sto-chastic, or highly nonlinear objective (target) functions. Various production constraints regarding design parameters can easily be included in the optimization procedure, which make the resulting structures more convenient for further fabrication than the ones obtained with more rigid methods such as, for instance, SYSQM, which results in a potential profile that needs to be further discretized in order to be pro-duced, which can result in the deterioration of the output characteristics.
The optimization of the entire QCL structure would be a complex and long-lasting task because of the large number of parameters that would need to be taken into account, so we have focused on the optimization of the active region which we then seamlessly assimilate with the existing injector/ collector design.
1. Active region optimization
Active regions in QCLs have been designed in many ways, the number of constituent quantum wells varying from a single QW to ten coupled QWs or even superlattices.24 However, a typical MIR design based on electron-longitudinal optical (LO) phonon depopulation mechanisms implies a minimum of three consecutive energy levels, with the radiative transitions occurring between the upper and lower laser levels, i.e., levels 3 and 2, in which electrons quickly leave the lower laser level 2 by resonant LO phonon scattering into the ground level 1. The electrons scatter into the upper laser level from the injector region and transfer to
the collector (extractor) region by the means of LO scattering from the lower active region levels.
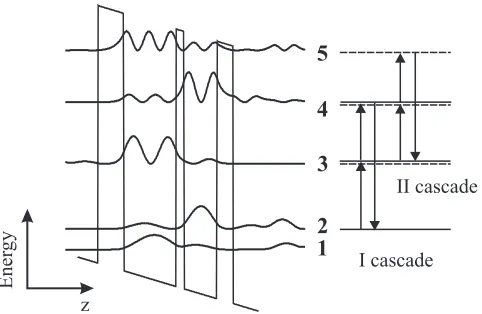
A QCL structure capable of second harmonic generation contains another energy triplet in the active region, in which at least one energy level has to be populated with free elec-trons in order for the structure to be able to generate radiative transitions. This sets an important design requirement, i.e., that at least five significant levels in the active region are needed, four of which must be approximately equidistant, while the fifth, ground level, must be kept at LO phonon energy below the lower laser level of the lower cascade. This is best illustrated in Fig. 1, which shows close-up details of the reference structure conduction band diagram and moduli squared of the active region essential wavefunctions. The SHG nonlinear cascades are indicated on the right of the active region. Cascades I (continuous line) and II (dashed line) extend over the levels 2–3–4 and 3–4–5, respectively.
In our optimization model, we start with the existing design (see Ref. 19) in which the active region consists of two coupled InGaAs quantum wells separated with an AlInAs barrier.
The optimization target function is chosen so as to ena-ble the maximization of the second order nonlinear susceptibility25
vð Þ2ð2xÞ 2pe
3
de0
M23M34M24
c42
n3n4
c43
þn3n2
c32
"
þM34M45M35
c53
n4n5
c54
þn4n3
c43
#
; (1)
where Mij is the DME between levelsi andj,cijis the full width half maximum (FWHM) for transitions occurring between levelsi andj, with the following values (Ref.24):
c42¼c53¼20 meV, c43¼c54¼15 meV, and c32¼10 meV,
niis the sheet electron density on the leveli, anddrepresents the layers width.
[image:2.612.319.560.555.712.2]In order for radiative transitions to take place, the popu-lation of the upper laser level, namely level 3, needs to be
considerably higher than the population of the higher active region levels, i.e., levels 4 and 5, so it is safe to assume that
n3n4,n5. Also, the values ofcij are in the same order of magnitude, so it is possible to use a simplified form of the optimization target function
FT¼
M34n3 M23M24 2
n2
n3
M45M35
: (2)
The objective is to maximize the function FT, given in Eq.(2), while at the same time the active region continues to match the existing injector/collector regions described in Ref.19. The energy differenceDE21, defined by the LO pho-non energy together with the transition energies between the levels constituting the cascades, DE32, DE43, and DE54, should remain unchanged. While maintaining the energy dif-ferences within a reasonable margin, the shape of the wave functions can be modified by varying the potential profile in order to influence the parameters of interest in the calcula-tion of the target funccalcula-tion.
The parameter vector consists of layer thicknesses, which are only allowed to have non-negative values, and these are limited to 105 A˚ for wells and 30 A˚ for barriers. Additional constraints to be taken into account during the optimization process include defining the minimal value of the matrix element, as well as the upper laser level energy, which is set to fit the injector region. Also, the algorithm is tuned to encourage the selection of potential profiles that favor diagonal transitions, with the intention of increasing the upper laser level life times. The optimization is per-formed for the external field value of 38 kV/cm.
The design process is concluded by adding the existing injector/collector region to the calculated optimized active region, which makes the structure ready for the next step in which the macroscopic parameters are calculated.
B. The self-consistent rate equation model
Once the optimized structure is defined and its energies and wave functions are evaluated, we can estimate its output characteristics by extending the full self-consistent rate equa-tion modeling of the electron transport described in Ref.17 so that it includes photon density equations. The inclusion of equations that describe single and double-photon stimulated emission processes will significantly add to the complexity of the numerical procedure and makes the achieving of con-vergence of the system more challenging. However, this approach will provide with a more general optimization method, which will be readily used in real-life applications of higher-order effects in QCLs we are developing now, see, for example, Refs.26–28.
A typical QCL structure contains multiple periods, each consisting of a large number of quantum wells that can be di-vided into active and collector/injector (extractor) regions. The quasi-discrete states that form the structure’s energy spectrum can be assigned to each region based on the local-ization of their wavefunctions. The electron scattering occurs between states that belong to the same period, as well as between states associated to different periods. However, if
the wavefunction overlap lessens, the electron scattering between the corresponding states decreases, so it is safe to assume that significant interaction exists only between states belonging to adjacent periods. If we assume an identical electron distribution throughout the periods, the scattering rate equations in the steady-state for a “central” period with
P neighbouring periods on either side can be written in the following form:29
XN
j¼1;j6¼i
njWj;ini
XN
j¼1;j6¼i
Wi;jþ
XP
k¼1
XN
j¼1;j6¼i
njðWj;iþkNþWjþkN;iÞ
½
niðWiþkN;jþWi;jþkNÞ ¼0 i2 1;N2ð2P2þ1Þ N
;
(3)
whereiþkNis theith state of thekth neighbouring period, and Wi,j is the total scattering rate from state i into statej. The equation takes into account both, intra-period (first two sums in [Eq. (3)]) and inter-period scattering (sum three). Since the number of total scattering rate processes equals to
N2(2Pþ1)N, in order to reduce the number of scattering rate processes necessary to calculate the electron distribu-tion, we have introduced the “tight-binding” approximation30 assuming that only the nearest neighbours interact, and set
P¼2.
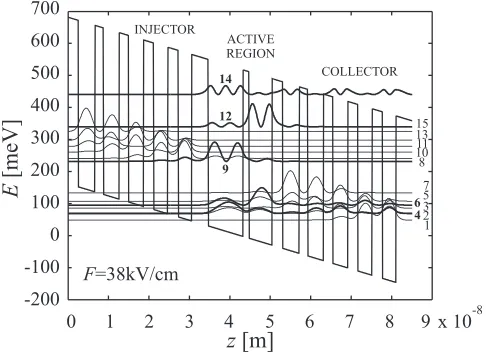
Adopting the notation and sub-band indexes given in Ref. 29, the injector and collector regions are represented with five energy levels each, sub-bands 1, 2, 3, 5, and 7 in the collector, and 8, 10, 11, 13, and 15 in the injector. The active region levels 14, 12, 9, and 6 are equally spaced with the energy intervals resonant to the lasing frequency. Level 4 represents the active region ground state, which is located one LO phonon energy below the lower laser level in order to facilitate faster carrier extraction from the active QCL region into the following collector/injector region of the sub-sequent period, see Fig.2.
[image:3.612.317.560.535.712.2]The incorporation of the influence of the SHG resonant levels, i.e., 6–9–12 and 9–12–14 cascades, into the rate
equation model is essential, since the two-photon absorption between 9 and 14 and emission between levels 12 and 6 can seriously influence the lasing performance due to the reduced population inversion between the lasing states 6 and 9. They are taken into account by extending the rate equations system with the rate equation for the density of photons describing single and double-photon stimulated emission processes
dmx
dt ¼
C
d W
p
96ðn9n6Þ þW p
14
ð Þð12Þðnð14Þnð12ÞÞ h
þWðp12Þ9ðnð12Þn9Þ
þ2C
d W
2p 14
ð Þ9ðnð14Þn9Þ þW 2p
12
ð Þ6ðnð12Þn6Þ
h i mx sx p : (4)
Here, mxis the photon density [m3],W
p ij andW
2p ik are the single- and double-photon stimulated emission rates,Cis the mode confinement factor, which is assumed to be 0.5 (Ref. 31), and sx
p is the photon lifetime related to the total loss ax as31 sxp ¼ðvgaxÞ1, where vgrepresents the group velocity,vg¼c=nx.
The single-photon stimulated emission rate, which is proportional to the photon density, is expressed as32
Wpij¼e
2M2 ijx 2e
cij
Eijhx
ð Þ2þ cij=2
2mx; (5)
whereEijis the energy difference between levels iandj,eis the permittivity of the lasing medium, andx is the incident photon frequency. The double-photon stimulated emission/ absorption rate in the transition cascadei – j – kis proportional to the photon density squared, as given in Refs.19and31
W2pik ¼
e4M2 ijM2jk 4he2
hx
Ejkhx
c
ik
Eik2hx
ð Þ2þðcik=2Þ 2m
2
x:
(6)
The total scattering rates between any two levels of the nonlinear cascade in the active region in the rate equations system described by Eq.(3)are modified so that they include not only the nonradiative scattering rates but also the radia-tive single and two-photon transitions, i.e., for transition rates between the adjacent single-photon resonant levels,
W69,W96,W9(12),W(12)9,W(12)(14)andW(14)(12), the total tran-sition rate can be expressed as
Wij¼WLOij þW ee ij þW
p
ij: (7)
Similarly, the transition rates between the two-photon resonant levelsW6(12),W(12)6,W9(14), andW(14)9, can now be calculated as
Wij¼WijLOþW ee ij þW
2p
ij : (8)
This makes the transition rates between the single-photon levels linearly and between the two-photon levels quadrati-cally dependent on the incident photon density. The values forWpij andW
2p
ik can be obtained from Eqs. (5)and(6). For
any other transitions occurring outside the active region, the scattering rates are obtained by taking into account electron-LO phonon and electron-electron scattering only and inde-pendent of the photon density in the cavity.
The set of equations expressed by Eq.(3), together with Eq. (4)describing the photon density, form a total of 16 rate equations whose solutions for electron and photon densities,
niandmxrespectively, can enable us to estimate macroscopic
parameters of the system, such as the current density or the linear or SHG output power. Since the scattering timeWi,f rep-resents a function of both ni and nf—the initial and final sub-band populations, and in the active region of the photon density as well, these equations need to be solved self-consistently using an iterative procedure (Refs.17and29).
The current density flowing through a reference plane placed in the injection barrier of the central period is calcu-lated by subtracting the current density component, which is the result of electrons scattering into the next periods of the QCL from the component caused by electrons scattering back (Refs.17,29, and30)
J¼X
P
k¼1
XN
i¼1
XN
j¼1
kniðWi;jþkNþWiþkN;jÞ: (9)
Even though simplified, in the case of MIR structures this approach is proven to be accurate enough compared to computationally more demanding models, like the density fraction model33,34 or the nonequilibrium Green function approach.35,36 The factor k in the summation, effective for non-nearest-neighbour scattering, originates from the scatter-ings from any QCL period left of the central period into any period right of it, or vice versa. Once again, we introduce the “tight-binding” approximation assuming that only the nearest neighbours interact, and setP¼2.
The linear and SHG output light intensity can be calcu-lated from the photon density in the cavity as
Ix¼NmodðhxÞmx c nx
; (10)
where Nmod is the number of QCL periods in the lasing cavity, and is set to 50, as in Ref. 19. The output power can now be calculated as
Px¼IxA; (11)
whereArepresents the cross-sectional area transverse to the light propagation direction.
The nonlinear output power can then be obtained from the following expression:31
P2x¼
2p2jvð Þ2j2
e2a2-L2e2a2xLcosðDkLÞ þ1
½ ð1R2Þ
IRn2xn2xk2ce0 Dk2þa22x
1R1
ð Þ2 P
2
x:
(12)
one given in Ref. 19, i.e., 1000lm2. nx¼kxc/x and
n2x¼k2xc/x are refractive indices of the fundamental and
second harmonic mode,Dk¼2kxk2xthe phase constant
mismatch, anda2xis the total loss including both the
wave-guideaw2xand the mirror loss am2x. The waveguide losses,
as well as the dimensions of the waveguide are taken from Ref. 19. The mirror losses can be estimated by
am
xð2xÞ¼ lnR1ð2Þ=L, where L is the cavity length, while
R1and R2are reflection coefficients at the fundamental and second harmonic frequency. They are related to the refrac-tive indices asR1ð2Þ¼ ð1nxð2xÞÞ2=ð1þnxð2xÞÞ2.
The self-consistent procedure is performed for a certain value of the external bias field. Changing the bias modifies the potential and consequently the energies and correspon-ding wave functions of the electron states. Therefore, all the lifetimes and transition matrix elements change, as do the current density, sub-band populations, and eventually the output power. By repeating the self-consistent procedure for a number of external fields, we can calculate the macro-scopic output characteristics and perform comparisons of the estimated device performance for various obtained structures.
III. NUMERICAL RESULTS AND DISCUSSION
The procedure described above is flexible enough to be applied on a wide variety of structures where a significant number of different operating wavelengths can be tailored. In this work, we have chosen to address the optimization of an active region for the structure described in Ref.19. It consists of two coupled InGaAs quantum wells separated with an AlInAs barrier, designed for fundamental and SHG wave-lengths ofk9lm andk4.5lm, respectively, which sets the fundamental transition energy to approximately 136 meV. The energy difference between the ground and lower laser state equals the LO phonon energy, i.e., 34 meV. The optimi-zation was carried out for the value of the applied field of
F¼38 kV/cm, temperature T¼10 K, and the sheet carrier densityNs¼37.21010 cm2, which was derived from the dopant profile per repeat period and was initially, at the begin-ning of the self-consistent procedure, assumed to be distrib-uted equally between the sub-bands of one period.
A schematic diagram of quasi-bound energy levels and associated wave functions squared for an injector-active region-injector section of the optimized structure is shown in Fig. 2. The layer sequence of one period, in nanometers, starting from the injection barrier is:4.1, 8.6, 1.5, 5.7, 2.6, 4.1,2.1, 3.9, 2.3, 3.7, 2.5, 3.5, 2.6, and 3.3, where normal scripts denote the wells and bold the barriers. The injector and collector regions are represented with five energy levels each, as given in the previous paragraph. The pump radiation at the fundamental frequency is generated between levels 9 and 6. Nonlinear cascades are formed by levels 6–9–12 and 9–12–14. The first cascade coincides with the laser transi-tion, while the resonance of the second cascade can be achieved by relative thickness variations of the two QWs and the barrier between them. At the applied bias field of 38 kV/cm, for which the optimization was performed, the lasing wavelength amounts tok¼9.08lm.
By applying the self consistent procedure described Sec. II on both, the reference, Ref. 19, and the optimized structure for T¼10 K and external field values from 30 to 55 kV/cm, the output characteristics were derived and com-pared. The electric field/current density characteristics are shown in Fig. 3. It can be seen that the optimized structure demonstrates a considerable improvement in that, in a nota-bly wide range of applied fields (above 40 kV/cm), higher current densities can be achieved with lower bias fields.
By using Eq.(12)and adopting the parameters given in Ref.19, we can estimate the nonlinear conversion efficiency
g¼P2x/Px2of 272lW/W2for the reference structure, which
is in good agreement with the experimentally obtained val-ues of100lW/W2given in Ref.19. The calculated value for the second order nonlinear susceptibility of
jv(2)j ¼2.58104pm/V is in accordance with the calculated values of 2104pm/V given for the reference structure in Ref. 19. However, the optimized structure shows a noticea-ble improvement regarding these parameters, and the calcu-lated values for the nonlinear to linear conversion efficiency and the second order nonlinear susceptibility are 349lW/W2 and 2.71104pm/V, respectively. We can notice that the relative increase of the nonlinear conversion efficiency is larger than the relative increase of the nonlinear susceptibil-ity. The reason for this lies in the fact thatgis not dependent solely on jv(2)j, but on other variables as well. When calcu-lating g, we must take into account the value of the expres-sion given in the square brackets in Eq.(12), which is not the same for the optimized and reference structure, as well as the value ofjv(2)jand the calculated wavelength. The differences are not significant, but can still lead to an evident difference of the nonlinear conversion efficiencies.
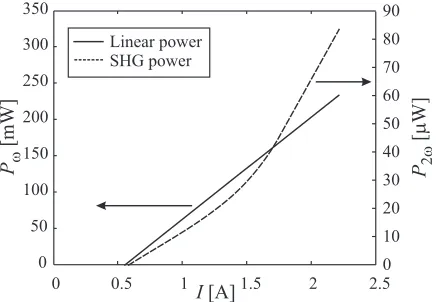
Figs.4and5represent the linear and nonlinear output for both the reference and optimized structure. The threshold current estimated for the optimized structure is close to 0.5 A, while the calculated value for the reference structure is about 2 A, which is in good accordance with the experi-mentally obtained values given in Ref.19. It can be seen that
the optimized structure shows higher linear output powers at lower currents.
As can be seen from Eq.(12), the phase mismatch factor
Dk plays a significant role in the nonlinear conversion effi-ciency estimation. In our calculations, the phase mismatch factor is about 100 times larger than the loss a2x. Even
though the phase mismatch did not degrade the increase of SHG achieved by the optimization process and the calculated values for the nonlinear conversion efficiency were rather high, they could be additionally enhanced by making the phase mismatch factor comparable to the optical losses, or by decreasing the effective interaction areaIR. Our optimiza-tion technique was, however, focused on the improvement of the nonlinearity of the laser medium, leaving the enhance-ment of the phase matching conditions subject of further work.
IV. CONCLUSION
We have described a procedure for the design of a GaInAs-AlInAs-based QCL with optimized optical nonli-nearity capability. The technique has no restrictions regard-ing the number of the optimization parameters or material composition, and demonstrates high optimization abilities.
The designs were evaluated by modeling the carrier dynam-ics using the full self-consistent approach extended with pho-ton density equations, and the reference design calculations show excellent agreement with experimental results. At the same time, the optimized structure predicts a significant improvement of the nonlinear to linear conversion efficiency and the second order nonlinear susceptibility, as intended. The described procedure is applicable to various active region designs and will be used in further work for other wavelength ranges. The developed method will also be an excellent ground for proper modeling of other higher-order effects in QCLs very relevant for current applications in imaging, spectroscopy, and material characterization.
ACKNOWLEDGMENTS
This work was supported by the Ministry of Education, Science and Technological Development (Republic of Serbia), ev. No. III 45010, NATO SfP Grant, Ref. No. 984068, and COST Actions BM1205 and MP1204.
1
J. Radovanovic´, A. Mircˇetic´, V. Milanovic´, Z. Ikonic´, D. Indjin, P. Harrison, and R. W. Kelsall,Semicond. Sci. Technol.21, 215 (2006).
2S. H€ofling, V. D. Jovanovic´, D. Indjin, J. P. Reithmaier, A. Forchel, Z.
Ikonic´, N. Vukmirovic´, P. Harrison, A. Mircˇetic´, and V. Milanovic´,Appl. Phys. Lett.88, 251109 (2006).
3B. S. Wlliams,Nat. Photonics1, 517 (2007).
4Y. Yao, A. J. Hoffman, and C. F. Gmachl,Nat. Photonics
6, 432 (2012).
5
J. Radovanovic´ and V. Milanovic´,Nucl. Technol. Radiat.24, 75 (2009).
6
F. Capasso, R. Paiella, R. Martini, R. Colombelli, C. Gmachl, T. L. Myers, M. S. Taubman, R. M. Williams, C. G. Bethea, K. Unterrainer, H. Y. Hwang, D. L. Sivco, A. Y. Cho, A. M. Sergent, H. C. Liu, and E. A. Whittaker,IEEE J. Quantum Electron.38, 511 (2002).
7
C. Sirtori, P. Kruck, S. Barbieri, P. Collot, J. Nagle, M. Beck, J. Faist, and U. Oesterle,Appl. Phys. Lett.73, 3486 (1998).
8C. Sirtori, H. Page, and C. Becker,Proc. R. Soc. London, Ser. A
359, 505 (2001).
9
S.-C. Lee and A. Wacker,Phys. Rev. B66, 245314 (2002).
10M. A. Belkin, F. Capasso, F. Xie, A. Belyanin, M. Fischer, A. Wittmann,
and J. Faist,Appl. Phys. Lett.92, 201101 (2008).
11
J.-Y. Bengloan, A. De Rossi, V. Ortiz, X. Marcadet, M. Calligaro, I. Maurin, and C. Sirtori,Appl. Phys. Lett.84, 2019 (2004).
12Y. R. Shen,The Principles of Nonlinear Optics(Wiley, New York, 1984). 13M. A. Belkin, F. Capasso, A. Belyanin, D. L. Sivco, A. Y. Cho, D. C.
Oakley, C. J. Vineis, and G. W. Turner,Nat. Photonics1, 288 (2007).
14
O. Malis, A. Belyanin, C. Gmachl, D. L. Sivco, M. L. Peabody, A. M. Sergent, and A. Y. Cho,Appl. Phys. Lett.84, 2721 (2004).
15J. Smiljanic´, J. Zezelj, V. Milanovic´, J. Radovanovic´, and I. Stankovic´, Comput. Phys. Commun.185, 998 (2014).
16
A. Danicˇic´, J. Radovanovic´, V. Milanovic´, D. Indjin, and Z. Ikonic´,
J. Phys. D43, 045101 (2010).
17A. Mircˇetic´, D. Indjin, Z. Ikonic´, P. Harrison, V. Milanovic´, and R. W.
Kelsall,J. Appl. Phys.97, 084506 (2005).
18
B. Novakovic´, J. Radovanovic´, A. Mircˇetic´, V. Milanovic´, Z. Ikonic´, and D. Indjin,Opt. Commun.279, 330 (2007).
19C. Gmachl, A. Belyanin, D. L. Sivco, M. L. Peabody, N. Owschimikow,
A. M. Sergent, F. Capasso, and A. Y. Cho,IEEE J. Quantum Electron.39, 1345 (2003).
20A. Hugi, R. Maulini, and J. Faist, Semicond. Sci. Technol.25, 083001
(2010).
21
Y. Petitjen, F. Destic, J.-C. Mollier, and C. Sirtori, IEEE J. Sel. Top. Quantum Electron.17, 22 (2011).
22D. E. Goldberg,Genetic Algorithms in Search, Optimization and Machine
Learning(Addison-Wesley, Boston, 1989).
23
[image:6.612.65.282.62.219.2]Free Fortran Genetic Algorithm (GA) Driver by David L. Carroll, CU Aerospace 301 North Neil Street Suite 400 Champaign, IL 61820-3169, [email protected], downloaded fromhttp://www.cuaerospace.com/ Technology/GeneticAlgorithm/GADriverFreeVersion.aspx.
FIG. 4. Fundamental power (straight line) and the nonlinear power (dashed line) under different pump currents for the reference structure. The lines rep-resent interpolated values of the calculated data.
[image:6.612.66.285.273.424.2]24C. Gmachl, F. Capasso, D. L. Sivco, and A. Y. Cho,Rep. Prog. Phys.64,
1533 (2001).
25
J. Bai and D. S. Citrin,Opt. Express14, 4043 (2006).
26
P. Dean, Y. L. Lim, A. Valavanis, A. R. Kliese, M. Nikolic´, S. P. Khanna, M. Lachab, D. Indjin, Z. Ikonic´, P. Harrison, A. D. Rakic´, E. H. Linfield, and A. G. Davies,Opt. Lett.36, 2587 (2011).
27
A. Danicˇic´, J. Radovanovic´, V. Milanovic´, D. Indjin, and Z. Ikonic´,
J. Phys. D: Appl. Phys.43, 045101 (2010).
28Y. L. Lim, P. Dean, M. Nikoli, R. Kliese, S. P. Khanna, M. Lachab, A.
Valavanis, D. Indjin, Z. Ikonic´, P. Harrison, E. H. Linfield, A. G. Davies, S. J. Wilson, and A. D. Rakic´,Appl. Phys. Lett.99, 081108 (2011).
29
D. Indjin, P. Harrison, R. W. Kelsall, and Z. Ikonic´,J. Appl. Phys. 91, 9019 (2002).
30V. D. Jovanovic´, S. H€ofling, D. Indjin, N. Vukmirovic´, Z. Ikonic´, P. Harrison,
J. P. Reithmaier, and A. Forchel,J. Appl. Phys.99, 103106 (2006).
31
J. Bai and D. S. Citrin,J. Quantum Electron.43, 391 (2007).
32
R. W. Boyd,Nonlinear Optics, 2nd ed. (Academic, San Diego, CA, 2003), p. 528.
33G. Beji, Z. Ikonic´, C. A. Evans, D. Indjin, and P. Harrison,J. Appl. Phys.
109, 013111 (2011).
34
E. Dupont, S. Fathololoumi, and H. C. Liu, Phys. Rev. B81, 205311 (2010).
35N. Vukmirovic´, D. Indjin, Z. Ikonic´, and P. Harrison, IEEE Photon. Technol. Lett.20, 129 (2008).
36