Engagement Affect Resumption Of Control?.
White Rose Research Online URL for this paper:
http://eprints.whiterose.ac.uk/91858/
Version: Published Version
Proceedings Paper:
Louw, T, Kountouriotis, G, Carsten, O et al. (1 more author) (2015) Driver Inattention
During Vehicle Automation: How Does Driver Engagement Affect Resumption Of Control?
In: 4th International Conference on Driver Distraction and Inattention (DDI2015), Sydney:
proceedings. 4th International Driver Distraction and Inattention Conference, 09-11 Nov
2015, Sydney, New South Wales, Australia. ARRB Group .
© 2015, ARRB Group Ltd and Authors.
eprints@whiterose.ac.uk https://eprints.whiterose.ac.uk/ Reuse
Unless indicated otherwise, fulltext items are protected by copyright with all rights reserved. The copyright exception in section 29 of the Copyright, Designs and Patents Act 1988 allows the making of a single copy solely for the purpose of non-commercial research or private study within the limits of fair dealing. The publisher or other rights-holder may allow further reproduction and re-use of this version - refer to the White Rose Research Online record for this item. Where records identify the publisher as the copyright holder, users can verify any specific terms of use on the publisher’s website.
Takedown
If you consider content in White Rose Research Online to be in breach of UK law, please notify us by
© ARRB Group Ltd and Authors 2015 1
DRIVER INATTENTION DURING VEHICLE
AUTOMATION: HOW DOES DRIVER ENGAGEMENT
AFFECT RESUMPTION OF CONTROL?
Tyron Louw, Georgios Kountouriotis, Oliver Carsten, and Natasha
Merat*, Institute for Transport Studies, University of Leeds, Leeds,
U.K.
ABSTRACT
This driving simulator study, conducted as part of the EC-funded AdaptIVe project, investigated
the effect of level of distraction during automation (Level 2 SAE) on drivers’ ability to assess automation uncertainty and react to a potential collision scenario. Drivers’ attention to the road was varied during automation in one of two driving screen manipulation conditions: occlusion by
light fog and occlusion by heavy fog. Vehicle-based measures, drivers’ eye movements and
response profiles to events after an automation uncertainty period were measured during a highly automated drive containing one of these manipulations, and compared to manual driving. In two of seven uncertainty events, a lead vehicle braked, causing a critical situation. Drivers' reactions to these critical events were compared in a between-subjects design, where the
driving scene was manipulated for 1.5 minutes. Results showed that, during automation, drivers’ response profile to a potential collision scenario was less controlled and more aggressive immediately after the transition, compared to when they were in manual control. With respect to screen manipulation in particular, drivers in the heavy fog condition collided with the lead vehicle more often and also had a lower minimum headway compared to those in the light fog condition.
INTRODUCTION
The emergence of vehicle automation presents a radical shift in the way that drivers interact with their vehicles and the driving task itself. Extensive research has been carried out on the human factors issues relating to lower levels (SAE Level 1 and 2) of vehicle automation (such as Adaptive Cruise Control (ACC); for a review see De Winter, Happee, Martens & Stanton, 2014). However, investigating the human factors implications of higher levels of automation up to SAE Level 5 has been somewhat constrained by the fact that the development and
implementation of this technology is still some way off. It is argued that as automation
advances, it will increasingly relieve drivers of the moment-to-moment demands of driving (Lee,
2013). However, as these systems will likely be fallible for some time to come, the driver will, on occasions, be required to intervene and resume control from automation.
Understanding the factors that influence driver distraction is underpinned by a strong theoretical orientation with multiple definitions. Amongst these, Lee, Regan & Young’s (2008, p. 38) is widely used: “Driver distraction is a diversion of attention away from activities critical for safe driving towards a competing activity.” A key assumption here is the competition for attentional resources between the driving task and another - secondary - activity. For the early generations
of automation (Level 1-3; SAE, 2014), however, the “activities critical for safedriving” will be
some combination of the driver monitoring the environment and being the fall-back operator.
However, increasing automation is likely to encourage driver engagement in secondary tasks, because drivers are no longer required to participate in the driving task at all times (Merat & Lee, 2012). Indeed, previous work conducted in our laboratories has found that during Highly Automated Driving (HAD), drivers are more likely to engage in tasks unrelated to driving
(Carsten, Barnard, Jamson & Merat, 2012). The nature of this distraction during automation can be both driver-initiated and stimulus-oriented, whilst drivers are also susceptible to stimulus
-independent thought or mind-wandering. Such shifts in attention can interfere with processing of
© ARRB Group Ltd and Authors 2015 2
2012). As the level of vehicle automation increases, drivers are likely to further disengage from driving (Carsten et al., 2012) and may, for example, fail to recognise and act upon a hazard when faced with a take-over-request (TOR, Gold, Damböck, Lorenz & Bengler, 2013).
Therefore, worse driving performance after the transition is likely unless drivers are given the correct information for resumption of control in an appropriate and timely manner. For example, drivers’ reaction time to critical events can be markedly reduced during distraction with a secondary task (Merat, Jamson, Lai, & Carsten, 2012). Driver distraction research has traditionally employed a dual-task paradigm to explain performance via competition for
attentional resources where driving is the primary task (Strayer & Johnston, 2001). During automation, however, the driver is not in control of the vehicle, which means that a dual-task
paradigm is not possible in the study of transitions. Therefore, to study the effects of stimulus
-independent thought that may occur before, during and/or after a transition, there is need for the development of a suitable methodology to establish what mechanisms contribute to how a driver might go from being engaged with the driving task during automation to being disengaged, or prone to mind-wandering, a process also referred to as passive fatigue (see Neubauer,
Langheim, Matthews & Saxby, 2011). It is also important to establish whether and how the effect of such states can be easily measured.
Many of the studies on transitions have rather loosely attributed less effective driving after return-to-manual control to phenomena such as out-of-the-loop (OOTL) or having lost situation
awareness (SA). Unhelpfully, however, there is some confusion around the distinction between the OOTL state and SA in terms of what the two concepts encompass; for example, whether they engage specific attentional domains or whether they are somewhat analogous. From a purely theoretical perspective, Endsley (1995) suggests a loss of SA is related to elements within the environment while being OOTL is specifically linked to elements of the automation status itself. To further complicate the matter, there is some debate around the usefulness or validity of each concept (Carsten & Vanderhaegen, 2015). One could draw a distinction between attentional aspects and physical aspects of control. For example, in a recent driving simulator study, we attempted to isolate the effects of the attentional and physical aspects of driving on a driver’s ability to resume manual control and respond to an impending collision scenario after 60s of automation (Louw, Merat & Jamson, 2015). In the first automation condition, participants were asked to keep their eyes on the road, while in the second they were distracted by a secondary task (reading on a PDA, which forced their visual attention away from the driving scene).
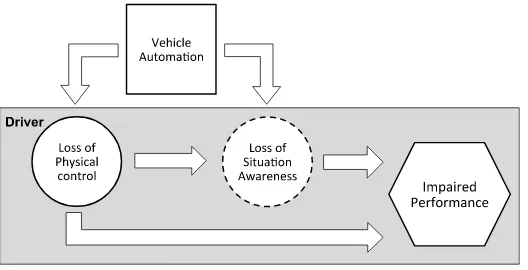
To assess the physical aspect of resuming control, we compared driver responses in both automation conditions to a manual condition. Our results showed that simply having to regain physical control is an important factor in these contexts, but the extent to which cognitive disengagement alone influences performance is yet to be established. It seems, therefore, that the difference between a driver who has lost SA and a driver who is OOTL is that the latter state also accounts for the effect of not being in physical control of performance. In addition, the definition of the OOTL concept is more descriptive about how the loss of SA arises. Endsley (1995) argues that the passive monitoring of automation, as a result of not being in physical control, leads to decreased vigilance and a lower understanding, which leads to a loss of SA. Our proposed schematic representation of the OOTL phenomenon, shown in Figure 1, suggests that the loss of physical control and the loss of SA can arise independently as a result of vehicle automation and can lead to less effective return-to-manual performance. Importantly, the loss of
© ARRB Group Ltd and Authors 2015 3 Figure 1. Schematic representation of the out-of-the-loop (OOTL) phenomenon.
Based on studies of OOTL problems in human-automation-interaction in cognate domains, such
as aviation (Molloy & Parasuraman, 1996), it can be argued that the further drivers are removed from the driving loop, the worse their return-to-manual performance. This stresses the need to
investigate the effect of automation as a distraction, and in particular how stimulus-independent
thought brought about by automation affects drivers’ resumption of manual control. However, while investigating the effects of stimulus-oriented thought simply requires engagement in a
secondary task, inducing stimulus-independent thought is more challenging. Therefore, the
main aim of this study was to develop a means of simulating various degrees of the driver OOTL state during HAD. To do this, we worked back from Endsley’s (1995) definition of SA and OOTL state. We argued that simply adding lateral and longitudinal assistance (Level2/3
automation) induced the physical aspect of being OOTL. To induce loss of SA, we progressively limited the driver’s ability to perceive information about the status of the automated system and the driving environment itself, by overlaying a fog-like occlusion screen onto the driving scene.
We reasoned that, by partially blocking the road scene (see methods section for experimental design), drivers would be somewhat aware of their surroundings, whilst blocking the road scene completely (heavy fog) would completely remove drivers’ awareness of their surroundings.
With a few notable exceptions (e.g. Beller et al., 2014), most previous studies on transitions (e.g. Gold & Bengler, 2014; Hergeth et al., 2015) have investigated responses to take-over
-requests (TOR) brought on by an automation system’s failure or limitation. These studies have mostly incorporated mandatory transitions (Goodrich & Boer, 1999) or TORs, which effectively instruct the driver to resume control. It is likely, therefore, that such methods simply assess drivers’ ability to react to an alarm or take over message. Although investigating how drivers perform when they take back control is an important consideration, understanding their ability to process information and make decisions in the face of an automated system with limited capabilities is also valuable. Therefore, in this study, we used the concept of automation uncertainty (or possible system limitation) not only to improve understanding of the driver
-automation-interaction, but also as a means of assessing whether drivers could recognise the
unfolding of a potentially critical event (which is an important element of SA). We argue that the more drivers were taken OOTL, the worse their ability to recognise and respond to road-related
hazards when the automation reaches its limitation.
While the driver’s role in monitoring the system varies according to the level of automation, the driver is largely removed from vehicle control when automation increases beyond SAE level 2 (SAE, 2014). Jamson, Merat, Carsten and Lai (2013) suggest that this then limits the usefulness of many of the metrics traditionally used to assess driver behaviour, such as Standard Deviation of Lateral Position (SDLP). There is, therefore, a need to develop a set of objective, formative measures of the quality and safety implications of the transition (Louw et al., 2015), rather than relying on system-dependant evaluative measures. Therefore, another aim of this study was to
© ARRB Group Ltd and Authors 2015 4
METHODS
Participants
Following approval from the University of Leeds Research Ethics Committee, 30 participants (20 male) between the ages of 22 and 69 (M=39.2, SD=14.45) were recruited via the driving
simulator database and were paid £20 for taking part. Participants had normal or corrected-to
-normal vision, were required to have had a driving licence for at least five years (M=20.17 SD=15.26) and drive at least twice a week (mean annual mileage was 8,616 miles).
Design and Procedure
Materials
The experiment was conducted in the University of Leeds Driving Simulator, which consists of a Jaguar S-type cab with all driver controls operational. The vehicle is housed within a 4m
spherical projection dome and has a 300° field-of-view projection system. A v4.5 Seeing
Machines faceLAB eye-tracker was used to record eye movements at 60Hz.
Design
A repeated measures mixed design was used for this study, with a between-participant factor of
Condition (light fog, heavy fog) and within-participant factors of Drive (manual, automated) and
Event (critical event 1, critical event 2).
The experimental session consisted of two drives (manual and automated) lasting about 20 minutes each, and to alleviate symptoms of fatigue, participants were given a short break between drives. Participants drove exactly the same road in both drives, but a screen
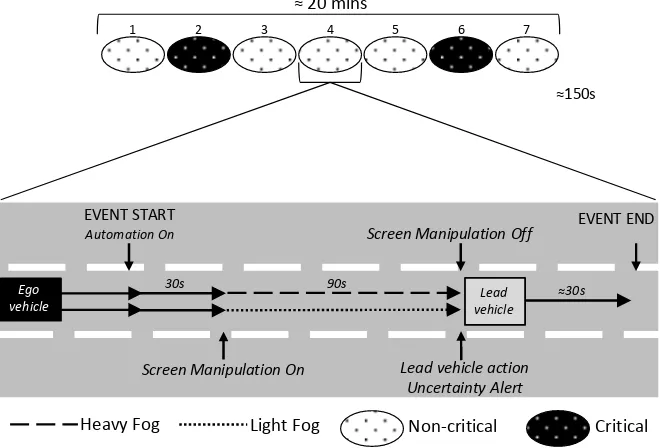
manipulation was applied to the automated drive only. The order of drives was counterbalanced across participants, with half of the participants performing the manual drive first and the automated drive second, or vice versa. As shown in Figure 2, within each drive there were seven discrete events, each lasting approximately 150s. Events 1,3,4,5 and 7 were non-critical
while events 2 and 6 were critical. During the non-critical events, the lead vehicle would either
speed up or change lane while in the critical events (2,6) the lead vehicle braked at time-to
[image:5.595.133.463.490.714.2]-collision (TTC) of 5s, resulting in an impending -collision scenario if the driver made no response.
Figure 2. Schematic representation of each discrete event, with events two and six shown as critical.
Light Fog Heavy Fog
30s Automation On
Lead vehicle action Uncertainty Alert
EVENT START
Lead vehicle Ego
vehicle
Screen Manipulation On 90s
EVENT END
Screen Manipulation Off
Non-critical Critical
1 2 3 4 5 6 7
© ARRB Group Ltd and Authors 2015 5
To induce the OOTL state during the automated drives, we employed two screen manipulation techniques. In the light fog condition, a translucent grey filter was overlaid onto the road scene. Here, drivers were able to distinguish elements of the road environment and movements of the surrounding vehicles, the aim of the manipulation was to simulate a process whereby limited visual attention was directed towards the screen, for example when drivers are engaged in reading an email but partly aware of the driving scene in their peripheral vision. In the heavy fog
condition, an opaque grey filter overlaid the road scene. This manipulation effectively blocked all visual information from the road environment. For both manipulations, drivers were also unable to see the HMI, which portrayed the status of the automated system.
Procedure
Upon arrival, participants were briefed on the description of the study and were asked to sign a consent form, with an opportunity to ask any questions, if required. They were then given the opportunity to practice manual driving and Highly Automated Driving (HAD) within a free-flowing
3-lane motorway. During the practice session, participants were talked through the various
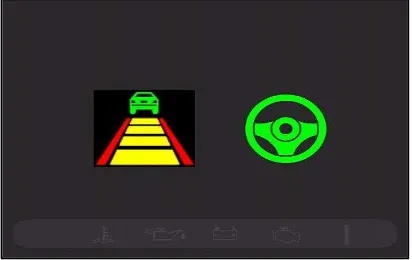
aspects of the vehicle HMI (Figure 3) were shown how to engage and disengage the automation and were also shown the screen manipulation they would encounter during the experimental automated drive. The road contained ambient traffic, but participants did not experience the critical events during the practice drives.
In terms of automation uncertainty, participants were told that, should the automation become uncertain during the drive (see below for how this was portrayed); they should monitor the driving environment and determine for themselves whether or not to intervene. Participants were instructed to stay in lane 2 of the motorway for the duration of the drive but were permitted to change lane in critical situations, and were told to move back into lane 2 as soon as possible. Drivers were asked to obey the normal rules of the road and to ensure safe operation of the vehicle.
To engage the highly automated driving system, participants pressed a button on the steering wheel. To disengage automation, participants would press the same button, turn the steering wheel more than 2° or press the brake pedal. During the automated drive, participants were asked to move to the centre of the middle lane as soon as convenient and then activate automated driving as soon as it was available (see Figure 2) which typically occurred 30s after the drive began. If drivers did not engage automation, after 60s the system engaged
automatically. The activation of automation constituted the start of an event. After 30s of automated driving, one of two 90s screen manipulations began. It is important to note that the vehicle dynamics, as well as all auditory cues, remained active during the screen manipulations. To ensure drivers were able to disengage from the driving task during automation without experiencing a high level of fatigue, we chose a screen manipulation duration of 90s. After each screen manipulation, the presence of a lead vehicle triggered an uncertainty scenario. At this point, the screen manipulation concluded, the driving scene was again visible, and
simultaneously the automation status changed from “Engaged” to “Uncertain”. Drivers were notified of this change by an auditory ‘beep’ and the automation status symbol, which was now visible, changed from green to flashing yellow. The driver was then expected to monitor the situation and intervene if necessary. After 3s, the lead vehicle would make one of three manoeuvres: In the non-critical events (1,3,4,6) the lead vehicle either moved out of lane 2 or
sped up, while in the critical events (2,6) the lead vehicle braked sharply with a maximum deceleration of -5.0 m/s2.
Human
-
Machine Interface (HMI)
© ARRB Group Ltd and Authors 2015 6 Figure 3. Example of the in-vehicle HMI with the FCW symbol on the left and the
Automation Status Symbol on the right.
In addition to the automation status, a Forward Collision Warning (FCW) symbol was included in the left panel of the central display unit (Figure 3). Active only when automation was engaged, this system provided a visual approximation of the headway of the lead vehicle in seconds. A continuous alarm alerted drivers of an imminent collision whenever TTC with the lead vehicle was below a threshold of 2s. To further deprive drivers of system information during automation, the automation status (steering wheel) and the FCW status were also hidden. However,
[image:7.595.78.520.385.611.2]participants were able to reveal the HMI at any point by pulling the left indicator stick towards them. This action illuminated the HMI for 2s. Participants were able to do this as often as they wanted.
Table 1: Description of the automation status HMI
Steering Wheel
Symbol Colour Automation status Description
Grey Unavailable Indicates that automation is not available to be engaged by the driver. Appears during the first 30s of the automated drive and when the vehicle is not in the middle of the middle lane.
Flashing green Available Indicates that the driver is able to engage automation. Appears when the vehicle is in the middle of the middle lane.
Green Engaged Indicates that the vehicle is being controlled by the automated system, which manages gentle manoeuvres and is not designed to respond to critical and unexpected incidents.
Flashing
yellow Uncertain
Indicates that the automated system, while currently functioning normally, thinks that in the near future there may be a situation on the road that it cannot deal with and, therefore, requires the
driver to monitor the road and intervene where necessary.
© ARRB Group Ltd and Authors 2015 7
RESULTS AND DISCUSSION
In this experiment, we attempted to simulate the feeling of being OOTL during HAD by limiting system and environmental information, and examined drivers’ assessment of the criticality of automation uncertainty warnings and their ability to respond to critical situations. We
hypothesised that as drivers are further removed from the loop their ability to assess and respond to critical situations would be degraded, and that response in heavy fog conditions would be worse than light fog, which has some visibility of the driving environment. Additionally, we expected that drivers’ ability to recognise and respond to these critical situations would be worse in automation, compared to manual driving.
Validating the OOTL state
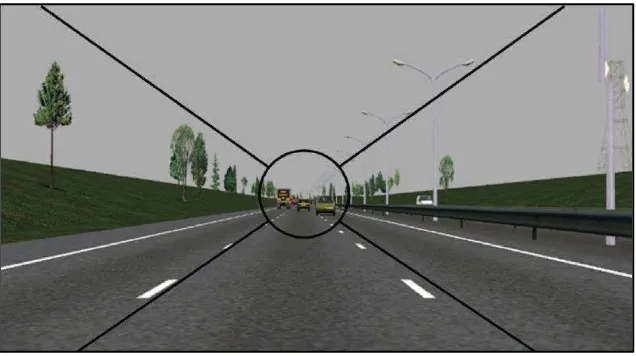
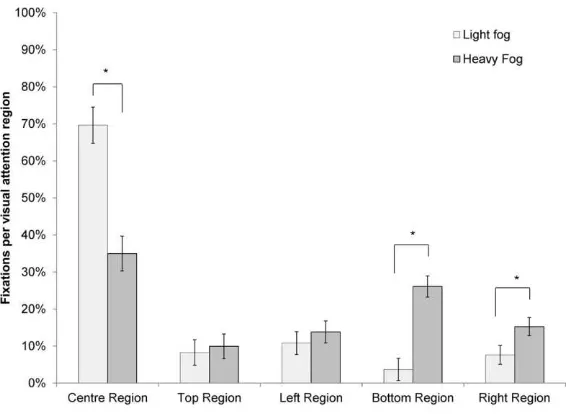
To assess the validity of the screen manipulation technique for inducing a state of being OOTL, we considered drivers’ visual attention to the road scene and driving task by observing its distribution across five spatial regions as illustrated in Figure 4, similar to a technique used by Hughes and Cole (1988) and Carsten et al., (2012). We used Percentage Road Centre (PRC; Victor, 2005) all seven events, and during both manual and automated driving. PRC was defined as the mode of gaze fixations that fell within the road centre area, a 6° circular region within a 60s moving window. As described in Carsten et al. (2012), the left region covered fixations to the centre console (e.g., radio controls) as well as the left side mirror, door window, and passing traffic in the adjacent lane. The right region covered the right side mirror, door window, and passing traffic in the adjacent lane. The bottom region covered mainly the
[image:8.595.139.457.371.549.2]dashboard, where the speedometer, automation HMI, and a variety of gauges were located. The top region covered mainly the sky. We reasoned that automation would reduce drivers’ attention to the road and, therefore, reduce PRC values in the central region, in particular.
Figure 4. Visual attention regions (Carsten et al., 2012).
To understand what information may be useful to drivers when they are required to re-engage in
the driving task, we also calculated the point of first fixation after each screen manipulation ended in the two automation conditions.
Finally, we counted the frequency of occasions drivers used the indicator stick to glimpse at the HMI, in order to understand whether and to what extent drivers were engaging with the driving task during the periods of screen manipulation, when automation was on.
Distribution of visual attention (Percentage Road Centre)
Drivers’ gaze behaviour was analysed across Screen Manipulation conditions. PRC during periods of Screen Manipulation for all seven periods of automation was compared using a one
-way Analysis of Variance (ANOVA), with Drive (automation, manual) as a within-subjects factor.
© ARRB Group Ltd and Authors 2015 8
sections of the driving environment (F(1,26) = 31.984, p<.001, p2= .417). These can be
compared to the central PRC values in the manual drive, which were 73.77% for the light fog
group and 73.50% for the heavy fog group. By the same token, for the same period, fewer fixations were observed towards the bottom of the screen (including the dashboard area) (F(1,26) = 4.792, p=.001, p2= .363) and the left and right of the screen (including the side
[image:9.595.90.373.128.335.2]mirrors) (F(1,26) = 4.480, p=.044, p2= .147).
Figure 5. Visual attention distribution during Light Fog and Heavy Fog automation drives. Error bars = SEM. * p<.05.
Engagement with the system
Figure 6: Average number of 'peeks' at the hidden automation status throughout the light fog and heavy fog automated drives across the experiment.
To assess engagement with the system during automation, the number of times participants pulled on the indicator stick to see the automation status were analysed using a mixed-design
ANOVA with a within-subjects factor of Events (1-7) and a between-subject factor of Condition
(light fog, heavy fog). Mauchly’s test indicated that the assumption of sphericity had been violated ( 2(20)=151.86, p< .001), and therefore degrees of freedom were corrected using
Greenhouse-Geisser estimates of sphericity ( =0.26). There was a main effect of Events
[F(1.557, 42.027) = 5.185, p=.015, p2=.161], where drivers looked at the automation status less
often as the drive progressed over the seven events (Figure 6). This suggests that, over time, participants were more disengaged from the driving task, possibly because they trusted the system more as time progressed.. There was no main effect of Condition, however, which
*
*
[image:9.595.177.421.424.607.2]© ARRB Group Ltd and Authors 2015 9
indicates that drivers’ engagement was not influenced by whether or not they could see what was happening in the road environment during light fog versus heavy fog conditions. There were no significant interactions between Condition and Event.
Point of first fixation
When the screen manipulation was turned off, more of the participants driving in the light fog
condition looked at the centre region first, compared to those in the heavy fog condition (M=76.53% vs. M=66.67%). By the same token, the light fog group also paid less attention to the bottom region, which contained the dashboard upon removal of the screen manipulation (M=8.16% vs. M=15.24%). However, a chi-squared test indicated that these differences were
not statistically significant.
Driver response to critical events
Driver response measures during the critical events included automation disengagement time, a count of the process by which participants disengaged automation, the number of lane changes and collisions.
Automation disengagement time was analysed with a mixed-design ANOVA, with Event (critical
event 1, critical event 2) as a within-subjects factor and Condition (light fog, heavy fog) as a
between-subjects factor. Chi-squared tests were conducted on lane change and collision
counts.
There was no effect of Condition on automation disengagement time [F(1,27) = .991, p=.328,
p2= .034], suggesting that being OOTL prior to the critical event did not impede drivers’ ability
to react to the lead vehicle braking. There was also no effect of Event and no interactions between Event and Condition. However, as argued earlier, drivers’ disengagement times might be considered less informative than whether and how they reacted. +
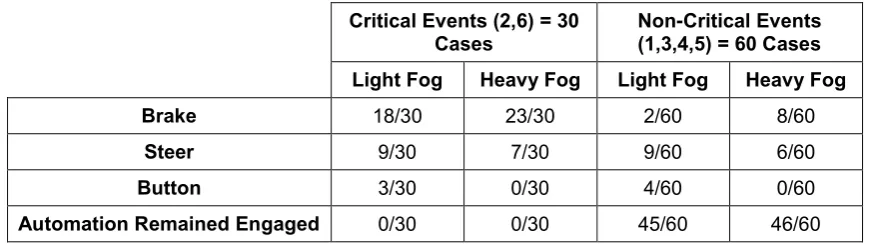
As a comparison, results from Table 2 show that, for the non-critical events, in both the light fog
[image:10.595.80.515.544.666.2]and heavy fog conditions, automation was only disengaged in a quarter of cases, while for the critical events automation was disengaged in all 60 cases. Importantly, only 8 of these critical event disengagements occurred before the lead vehicle braked, suggesting that during the automation uncertainty events drivers were able to recognise the criticality of the situation (lead vehicle braking, reduced TTC and the likelihood of a collision). Drivers were not explicitly told how the system would behave in a critical situation, which suggests that when drivers do not know the limitations of their automated systems, they trust their own abilities over those of the system or they could be suspicious until they trust it.
Table 2: Disengagement methods for all cases in the critical and non-critical events
Critical Events (2,6) = 30
Cases Non(1,3,4,5) = 60 Cases-Critical Events
Light Fog Heavy Fog Light Fog Heavy Fog
Brake 18/30 23/30 2/60 8/60
Steer 9/30 7/30 9/60 6/60
Button 3/30 0/30 4/60 0/60
Automation Remained Engaged 0/30 0/30 45/60 46/60
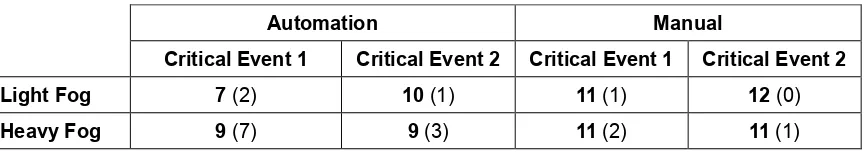
To test for associations of lane changes between the four conditions, a chi-squared analysis
was conducted. Table 3 shows that drivers made fewer lane changes in the automation
condition compared to manual driving. However, even though drivers were able to recognise the criticality of the event following automation, they were still unable to avoid a collision, with a chi
© ARRB Group Ltd and Authors 2015 10
[image:11.595.85.519.130.206.2]collisions when the heavy fog manipulation was on, compared to the light fog condition, with the trend more prominent in the first critical event. These results suggest that, compared to manual driving, automation reduced drivers’ ability to avoid a collision, and particularly so when drivers were further out of the loop in the heavy fog condition.
Table 3: Lane Changes and collision counts (in brackets)
Automation Manual
Critical Event 1 Critical Event 2 Critical Event 1 Critical Event 2
Light Fog 7 (2) 10 (1) 11 (1) 12 (0)
Heavy Fog 9 (7) 9 (3) 11 (2) 11 (1)
Vehicle measures
To examine driver’s overall vehicle control during the transition in critical events (2, 6),
longitudinal driving performance was measured using maximum deceleration from the point of resumption of manual control to the end of the critical event, which was 10 seconds after the lead vehicle’s brake light illuminated. Taken in the same time frame, lateral driving performance was measured using maximum lateral acceleration, which has also been used previously as a measure of vehicle control (Gold et al., 2014; Louw et al., 2015). Minimum distance headway as a measure of how close a driver came to the rear of the lead vehicle was also calculated. A mixed-design ANOVA was conducted on Drive (automation, manual) and Event (critical event 1,
critical event 2) as within-subjects factors and Condition (light fog, heavy fog) as a between
-subjects factor, for maximum lateral acceleration, maximum deceleration and minimum headway.
Maximum lateral acceleration
Maximum lateral acceleration was significantly higher in the automated drives, compared to the manual drives (M=1.99m/s2, SE=0.19 m/s2 vs. M=1.13 m/s2, SE=0.12 m/s2, respectively;
F(1,28) = 9.382, p=.005, p2= .251), suggesting that, following re-entry into manual control,
drivers displayed less stable vehicle control in response to a potential collision scenario, compared to manual driving. However, there was no effect of Condition or Event and also no interactions.
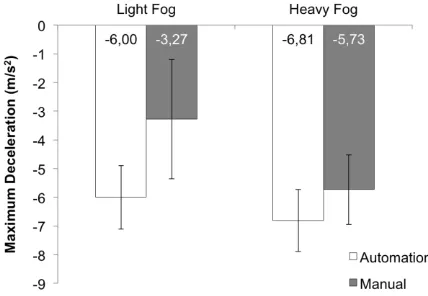
Maximum deceleration
There was a significant effect of Drive on maximum deceleration [F(1,25) = 13.774, p =.001,
p2= .355], with participants reducing their speed at a higher rate in the automated drive (M=
-5.94 m/s2, SE=0.45 m/s2 vs. M=-4.25 m/s2, SE=0.46 m/s2). As shown in Figure 7, this effect was
qualified by the interaction between Drive and Condition, [F(1,28) = 9.382, p=.005, p2= .251],
© ARRB Group Ltd and Authors 2015 11 Figure 7: Maximum deceleration for the two Drives and for the two Conditions. Error bars
= SEM.
Headway
There was a main effect of Drive on minimum headway [F(1,28) = 7.343, p=.011, p2= .208],
being significantly shorter in the automated drive (M=15.27m, SE=2.72) than in the manual drive (M=22.75m, SE=3.47m). The result of this lower headway is also demonstrated by the higher collision count in the automated drives (Table 3). There was an effect of Condition for headway [F(1,28) = 5.679, p=.024, p2= .169], with drivers in the heavy fog condition having a significantly
shorter headway (M=12.96, SE=2.63m) compared to the light fog condition (M=17.66m, SE=2.81m), but this result needs to be interpreted cautiously because of the inter-group
variance in headway in this between-subjects design. This is further supported by the
differences in collision counts between the light fog and heavy fog conditions. There was a significant effect of Event for headway [F(1,28) = 10.513, p=.003, p2= .273] with shorter
headway in the second critical event (M=15.27m, SE=2.98m), compared to the first (M=22.75m, SE=3.20m).
SUMMARY AND CONCLUSIONS
Previous studies on the human factors of the transition from HAD to manual driving have attributed less effective return-to-manual performance to the rather poorly understood human
OOTL problem. To investigate the relative contribution of the driver OOTL state to driving performance during this transition, the current study attempted to simulate the driver OOTL state, and to examine whether it affected drivers’ ability to recognise and respond to a critical situation.
We hypothesised that, by limiting system and environmental information during automation and prior to an automation uncertainty event, drivers would have a reduced ability to recognise and respond to a critical scenario. Eye glance data showed that during automation, when the screen was manipulated by a heavy fog condition, drivers were less engaged with the driving task and reduced their attention to the road centre. However, drivers were able to determine the criticality of the impending collision (critical events), disengaging automation after the lead vehicle braked in all but 8 of 60 cases. Yet, simply recognising the hazard did not seem sufficient, as drivers collided with the lead vehicle in 13 of 60 critical event cases. Drivers seemed to be more out of the loop in the heavy fog condition, with more collisions after this manipulation than the light fog
condition (although differences were not significantly different).
In the study reported by Beller et al., (2013), communicating automation uncertainty was found to improve driver-automation interaction, such as an improved time to collision in the case of
© ARRB Group Ltd and Authors 2015 12
We found that when drivers were not in physical control of the vehicle and had an artificially reduced situation awareness during automated driving, their response to an impending collision after an uncertainty message in critical events involved greater maximum deceleration and higher maximum lateral accelerations, whilst they also maintained a shorter headway with the lead vehicle, when results were compared to manual driving performance. The response profile of drivers to a potential collision scenario was, therefore, less controlled and more aggressive immediately after the transition. Given that the uncertainty alarm was not a take-over-request
but rather a request to monitor the system and intervene if they deemed necessary, it is difficult to accurately assess response time to an event. Nevertheless, taken together these differences suggest that following automation, drivers have a diminished capacity to respond as they would under normal manual control. Apart from the higher collision count in the heavy fog automation drive, driver response after the transition was found to be similar between the two screen manipulation conditions. However, it is not currently clear whether this lack of difference between the two levels of screen manipulation, aimed at taking drivers further OOTL, was an inappropriate application of the methodology, or whether the vehicle-based measures used to
test this hypothesis were not robust enough to highlight any possible differences.
One of the challenges of using the screen manipulation technique to induce the OOTL state is that drivers are likely aware that they are losing information. In reality, when drivers are OOTL as a result of a distracting non-driving task or, indeed, vehicle automation, they may not know
the extent to which they are OOTL. Therefore, the technique used in this study, may well be underestimating the effects of being OOTL in automation, on a driver’s ability to respond in critical situations. In addition, as Dekker (2004) points out, the loss of situation awareness or deficient situation awareness is explained by reference to an “ideal”, potential state of situation awareness, where one notices things that turn out to be critical. In the context of vehicle automation, this “ideal” is likely closely linked to drivers’ understanding of the functionality and behaviour of the automated system. Before higher levels of vehicle automation become
ubiquitous it is important for us to understand how drivers interact with their vehicle’s automation system in dynamic environments, such that the design of these systems augment the limitations of the driver in this new context. Future studies on driver-automation interaction should,
therefore, strive to integrate deeper context and meaning into the design of experiments and scenarios.
It is also pertinent to acknowledge that the measures used may be more meaningful when analysed according to the nature of the driver’s response to a critical event. For example, measures of lateral acceleration will be different for those who steer compared to those who only brake. Further studies are currently in progress in our laboratories to investigate these ideas in more detail by comparing the results from this study with other types of screen manipulation including the use of distracting tasks.
ACKNOWLEDGEMENTS
This research was conducted as part of the EU-funded AdaptIVe project. The authors would like
© ARRB Group Ltd and Authors 2015 13
REFERENCES
Beller, J., Heesen, M. and Vollrath, M. (2013). Improving the Driver–Automation Interaction: An Approach Using Automation Uncertainty. Human Factors, 55(6), 1130-1141.
Carsten, O. and Vanderhaegen, F. (2015). Situation awareness: Valid or fallacious? Cognition, Technology & Work, 17 (2), 157-158.
Carsten, O., Lai, F. C. H., Barnard, Y., Jamson, A. H. and Merat, N. (2012). Control task substitution in semi-automated driving: Does it matter what aspects are automated? Human
Factors, 54, 747–761.
De Winter, J. C. F., Happee, R., Martens, M. H. and Stanton, N. A. (2014). Effects of adaptive cruise control and highly automated driving on workload and situation awareness: A review of the empirical evidence. Transportation Research Part F, 27 Part B, 196-217.
Dekker, S.W.A. (2005). Ten Questions about Human Error. A New View of Human Factors and System Safety. Lawrence Erlbaum, New Jersey.
Endsley, M. R. (1995). Toward a theory of situation awareness in dynamic systems. Human Factors, 37, 65–84.
Gold, C. and Bengler, K. (2014). Taking Over Control from Highly Automated Vehicles.
Proceedings of the 5th International Conference on Applied Human Factors and Ergonomics AHFE 2014, Kraków, Poland 19-23 July.
Gold, C., Damböck, D., Lorenz, L. and Bengler, K. (2013). “Take over!” How long does it take to get the driver back into the loop?” Proceedings of the Human Factors and Ergonomics Society Annual Meeting September 2013, 57, 1938-1942.
Goodrich M.A. and Boer E.R. (1999). Multiple mental models, automation strategies, and intelligent vehicle systems. Proceedings IEEE/ IEEJ/JSAI conference on intelligent transportation systems: October 5–8, 1999, Tokyo, Japan.
Hergeth, S., Lorenz, L., Krems, J. and Toenert, L. (2015). Effects of Take-Over Requests and
Cultural Background on Automation Trust in Highly Automated Driving. In Proceedings of the 8th International Driving Symposium on Human Factors in Driver Assessment, Training and Vehicle Design(pp. 331-337). Snowbird, Utah.
Hughes, P. K. and Cole, B. L. (1988). The effect of attentional demand on eye movement behaviour when driving. In A. G. Gale, M. H. Freeman, C. M. Haslegrave, P. Smith, & S. P. Taylor (Eds.), Vision in vehicles II (pp. 221–230). Amsterdam, Netherlands: North-Holland.
Jamson, A. H., Merat, N., Carsten, O. M. J. and Lai, F. C. H. (2013). Behavioural changes in drivers experiencing highly-automated vehicle control in varying traffic conditions.
Transportation Research Part C: Emerging Technologies, 116–125.
Lee, J. D. (2014). Dynamics of Driver Distraction: The process of engaging and disengaging.
Annals of Advances in Automotive Medicine, 58: 24–32.
Lee, J. D., Regan, M. A. and Young, K. L. (2008). Defining driver distraction. In M. A. Regan, J. D. Lee, and K. L. Young (Eds.), Driver Distraction: Theory, Effects, and Mitigation (pp. 31–40). Boca Raton, FL: CRC Press.
Li, S. Y. W., Magrabi, F. and Coiera, E. (2012). A systematic review of the psychological literature on interruption and its patient safety implications. Journal of the American Medical Informatics Association: JAMIA, 19(1), 6–12. doi:10.1136/amiajnl-2010-000024
Louw, T., Merat, N. and Jamson A. H. (2015). Engaging with Highly Automated Driving: To be or not to be in the loop? In Proceedings of the 8th International Driving Symposium on Human Factors in Driver Assessment, Training and Vehicle Design (pp. 190-196). Snowbird, Utah.
doi:10.13140/RG.2.1.2788.9760
© ARRB Group Ltd and Authors 2015 14
Merat, N., Jamson, A. H., Lai, F. C. and Carsten, O. (2012). Highly automated driving, secondary task performance, and driver state. Human Factors: The Journal of the Human Factors and Ergonomics Society, 54(5), 762-771.
Molloy, R. and Parasuraman, R. (1996). Monitoring an automated system for a single failure: Vigilance and task complexity effects. Human Factors, 38(2), 311-322.
Neubauer, C., Matthews, G., Langheim, L. and Saxby, D. (2011). Fatigue and voluntary utilization of automation in simulated driving. Human Factors, 54(5), 734-746.
SAE J3016 (2014). Taxonomy and Definitions for Terms Related to On-Road Motor Vehicle
Automated Driving Systems. Society of Automotive Engineers.
Strayer, D. L. and Johnston, W. A. (2001). Driven to distraction: Dual-task studies of simulated
driving and conversing on a cellular phone. Psychological Science, 12, 462–466.
© ARRB Group Ltd and Authors 2015 15
AUTHOR BIOGRAPHIES
Tyron Louw is a PhD student at the Institute for Transport Studies, University of Leeds. He obtained BSc (Hons) and MSc (Research) degrees in Ergonomics from Rhodes University, South Africa. His main research area is in driver behaviour and his PhD research focuses on the human factors of transitions in highly automated driving. He is also a Research Assistant on the EU-funded projects CityMobil2 and AdaptIVe, where he investigates road users' interactions
with automated road transport systems and tries to understand how drivers can safely interact with automated vehicles.
Georgios Kountouriotis is a Postdoctoral Research Fellow at the Institute for Transport Studies, University of Leeds. His background is in Psychology (Perception/Action) and his main research interests are how humans use visual information and eye-movements to enable successful
locomotion under various conditions including cognitive load, as well as how humans are able to resume control of a vehicle after a hiatus.
Oliver Carsten is Professor of Transport Safety at the Institute for Transport Studies, University of Leeds. His major research focus is on driver interaction and safety with new driver support systems. He led the UK national project on Intelligent Speed Adaptation and chairs the Road User Behaviour Working Party of PACTS, the Parliamentary Advisory Council for Transport Safety. He has provided advice on safety policy to the UK Department for Transport and the European Transport Safety Council. He is editor-in-chief of the academic journal Cognition,
Technology and Work.
Natasha Merat is an Associate Professor at the Institute for Transport Studies, University of Leeds. She has a background in Psychology and her research interests relate to understanding the interaction of drivers with new technologies in and out of the vehicle. She uses the
University of Leeds Driving Simulator for most of her research and is particularly interested in understanding how driver distraction affects driving performance and also in studying the human factors implications of vehicle automation.
Copyright Licence Agreement
The Author allows ARRB Group Ltd to publish the work/s submitted for the 9th Austroads Bridge Conference, granting ARRB the non-exclusive right to:
• publish the work in printed format • publish the work in electronic format • publish the work online.
The Author retains the right to use their work, illustrations (line art, photographs, figures, plates) and research data in their own future works