This is a repository copy of Thermal degradation of real-world waste plastics and simulated mixed plastics in a two-stage pyrolysis-catalysis reactor for fuel production. White Rose Research Online URL for this paper:
http://eprints.whiterose.ac.uk/87466/ Version: Accepted Version
Article:
Muhammad, C, Onwudili, JA and Williams, PT (2015) Thermal degradation of real-world waste plastics and simulated mixed plastics in a two-stage pyrolysis-catalysis reactor for fuel production. Energy and Fuels, 29 (4). 2601 - 2609. ISSN 0887-0624
https://doi.org/10.1021/ef502749h
eprints@whiterose.ac.uk https://eprints.whiterose.ac.uk/ Reuse
Unless indicated otherwise, fulltext items are protected by copyright with all rights reserved. The copyright exception in section 29 of the Copyright, Designs and Patents Act 1988 allows the making of a single copy solely for the purpose of non-commercial research or private study within the limits of fair dealing. The publisher or other rights-holder may allow further reproduction and re-use of this version - refer to the White Rose Research Online record for this item. Where records identify the publisher as the copyright holder, users can verify any specific terms of use on the publisher’s website.
Takedown
If you consider content in White Rose Research Online to be in breach of UK law, please notify us by
1
Thermal Degradation of Real-World Waste Plastics and Simulated Mixed Plastics in a Two-Stage Pyrolysis-Catalytic Reactor for Fuel Production
Chika Muhammad,Jude A. Onwudili, Paul T. Williams* Energy Research Institute, Faculty of Engineering,
University of Leeds, Leeds, LS2 9JT, UK
ABSTRACT: Real-world post-consumer mixed plastics and a simulated mixture of plastics
were processed in a two-stage pyrolysis-catalysis fixed bed reactor in the presence of a
Zeolite HZSM-5 catalyst. In addition, single plastic polyethylene, polypropylene,
polystyrene and polyethylene terephthalate were also processed in the two-stage reactor. The
product yield, composition and hydrocarbon distribution of the product oil was obtained in
relation to plastic type. Non-catalytic pyrolysis of the plastics produced a high yield of an
oil\wax product in the range, 81-97 wt. %. Addition of the catalyst reduced the yield of oil to
between 44-51 wt.%, with an increase in gas yield from cracking of the oil volatiles.
However, the condensed oils produced from pyrolysis-catalysis were enriched with lower
molecular weight (C5-C15) hydrocarbons and were markedly more aromatic in composition
with a high proportion of single ring aromatic hydrocarbons. Comparison of the results from
pyrolysis and pyrolysis-catalysis of the simulated mixture of plastics with the data obtained
for the individual plastics showed that significant interaction between the plastics occurred in
the mixture with higher C2-C4 gas yield and higher aromatic content in the oils than expected
from the proportions of the individual plastics in the mixture.
Keywords: Waste; Plastic; Fuel; Catalysis
*
2
1.0 INTRODUCTION
Global energy use is expected to continue to rise over the next two decades, including an
increase in the demand for transport fuels.1 The production of transport fuels from biomass and wastes offers alternatives to the production of liquid fuels from petroleum. One such
source for liquid transport fuels is the processing of waste plastics, through „tertiary
recycling‟ which thermally process the waste plastics to produce fuels and chemicals from a
material that was originally produced from petroleum.
Post-consumer plastic waste generation in Europe is approximately 25 million tonnes
per year, of which 6.6 million tonnes are recycled mainly through mechanical recycling, 8.9
million tonnes are processed by energy recovery facilities and 9.6 million tonnes are disposed
to landfill.2 Municipal solid waste contains post-consumer plastics which consist of mainly, high-density polyethylene (HDPE), low density polyethylene (LDPE), polypropylene (PP),
polystyrene (PS), polyvinylchloride (PVC) and polyethylene terephthalate (PET).3
Pyrolysis is a form of tertiary recycling undertaken in the absence of oxygen and leads
to the thermal degradation of the plastic. The process of pyrolysis produces cracking of the
high molecular weight polymer chain to low molecular weight hydrocarbon oils and gases.
Tertiary recycling implies that the product oils and gases can be re-processed at a petroleum
refinery to produce liquid fuels, plastics and chemicals.4 The pyrolysis process for the treatment of waste plastics has been described as one of the most suitable options for the
preservation of petroleum resources and an environmentally acceptable treatment of waste.3,5 The pyrolysis of waste plastics has been carried out in reactors ranging from
laboratory scale to commercial scale, using a range of different reactors.4-9 For example,
laboratory-scale pyrolysis of waste plastics has been researched using a fixed-bed, batch
process to treat a range of plastic wastes. 7 Larger scale ~1 tonne per day batch reactors have
3
produce fuel oils. 9 Pilot scale fluidised bed reactors have been employed for the pyrolysis of plastic waste with throughputs of ~30 kg hr-1 and temperatures typically between 500 and 780
°C. 8 Commercial scale pyrolysis of waste plastics produced from municipal solid waste has been developed with throughputs of ~ 14,000 tonnes per annum using rotary kiln technology
as the main reactor to produce heavy oil, a medium oil and a light oil fractions. 10
To improve the quality of the product oil, catalysts have been added to the process.
11-13
Recent reviews of the use of catalysts in the thermal treatment of waste plastics have been
undertaken by Serrano et al., 13 and Aguado et al. 14 which highlight Zeolites as effective catalysts for upgrading the quality of the product pyrolysis oil derived from waste plastics.
Zeolite catalysts show advantages of high catalytic activity, shape selectivity, strong acidity
and stability at elevated temperatures. They are used for a variety of reactions such as
cracking, alkylation, aromatization, isomerization of hydrocarbons.15, 16
It has been suggested that an optimum reactor configuration for catalytic pyrolysis of
waste plastics is a two-stage reactor with a first stage of pyrolysis followed by catalysis in a
second stage reactor.13 The stated advantages included; greater control and optimisation of temperature for each stage of the process; particular suitability for mixed plastic wastes
where any residue or dirt remains in the first pyrolysis stage; protection of the catalyst from
carry-over of particulates which may deactivate the catalyst; improvement of contact between
pyrolysis products and catalyst; ease of recycling of the used catalyst. There have been
several studies of the two-stage, pyrolysis-catalysis of plastics reported in the literature. For
example, Bagri and Williams 11 investigated the catalytic pyrolysis of polyethylene in a fixed bed, two stage pyrolysis-catalysis reactor using Zeolite ZSM-5 and Y zeolite catalysts. The
pyrolysis of the plastics was carried out at 500 °C and the influence of catalyst bed
temperature between 400-600 °C was investigated. Aguado et al. 17 also used a two-stage,
4
Zeolite catalysts at temperatures between 425-475 °C. However, the large majority of studies
of coupled pyrolysis-catalysis of plastics has been with single pure polymer plastics; there are
fewer studies on the pyrolysis-catalysis process using real-world post-consumer mixed plastic
waste.
In this paper, real-world, post-consumer plastic waste has been processed using a
two-stage, pyrolysis-catalysis reactor with Zeolite HZSM-5 catalyst to produce a high quality
liquid fuel containing fuel range hydrocarbons. In addition, pure, single polymer plastics in
the form of polyethylene, polypropylene, polystyrene and polyethylene terephthalate were
also processed in the pyrolysis-catalysis reactor system. A simulated mixture of the four
plastics was also processed to determine if there was any interaction between the plastic
products during the process which might influence the composition of the product oils and
gases.
2.0EXPERIMENTAL SECTION
2.1 Materials: The “real-world”, post-consumer, municipal solid waste mixed plastic
(MP) sample was obtained from Fost Plus, Belgium. The collected plastic waste fraction was
flaked and air separated to produce a sample containing mainly, PE, PP and PET with a
sample size of ~5mm. This ash content of the waste plastic was determined at <0.1 wt.%,
reflecting the lack of any contamination dirt or detritus in the sample. The elemental
composition of the Fost Plus sample was determined using a CE Instruments (Wigan, UK)
CHNS-O analyser, as 77.1 wt.% carbon, 11.5 wt.% hydrogen, 11.2 wt.% oxygen, 0.2 wt.%
nitrogen and 0 wt.% sulphur. PE, PP, PS and PET were supplied as virgin polymer by Good
Fellow Ltd., Cambridge, UK. A simulated mixture of plastics (SMP) was prepared consisting
of a blended mixture of virgin plastics and consisted of 60 wt% polyethylene, 13wt%
5
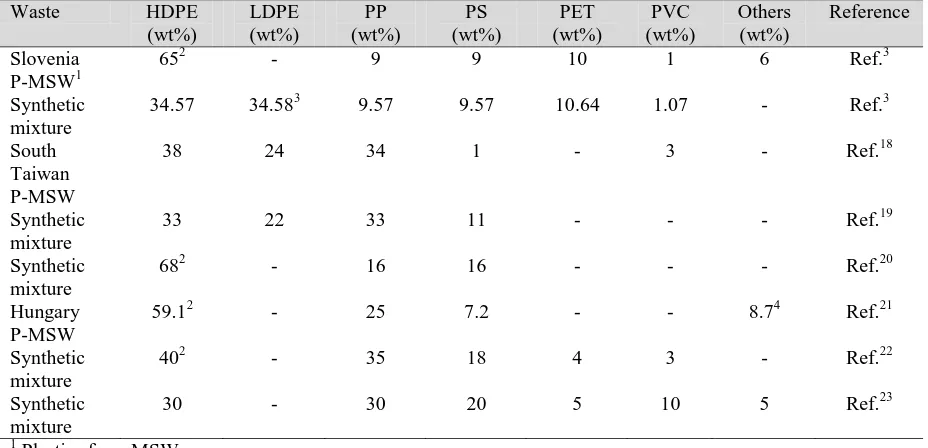
review of the literature (Table 1) in regard to the range of waste plastics used in pyrolysis
studies and were selected to reflect the range of the main plastic polymers found or
researched in municipal solid waste plastics.3, 18-23
Thermo gravimetric analysis (TGA) of the individual plastics, real-world post consumer
plastic and the synthetic mixture of the plastics used a Shimadzu 50A TGA to determine the
thermal degradation characteristics of the plastics via weight loss of the sample in relation to
increasing temperature. The procedure involved heating ~15 mg of the plastic sample (in N2)
at 10°C min-1 to a final temperature of 500°C and kept constant at that temperature for 30 minutes. For the TGA, the plastic samples were pulverized into ~500 nm sized particles in a
cryogenic mill, to ensure a representative, homogeneous sample was presented to the TGA.
The catalyst used for the investigation was a Zeolite HZSM-5 catalyst supplied by Alfa
Aesar Ltd., UK. The catalyst had a surface area of 452 m2 g-1, micropore volume of 0.167
cm3 g-1, mesopore volume of 0.134 cm3 g-1 and average pore diameter of 7.4 Å. The silica: alumina ratio was 50:1.
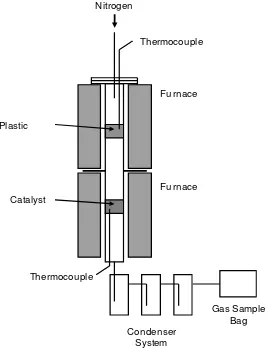
2.2 Two-stage pyrolysis-catalytic reactor: The pyrolysis-catalysis experimental
reactor system consisted of a two-stage fixed bed reactor with oil condensers and gas
collection sample bag (Figure 1). The pyrolysis reactor was a stainless steel fixed bed reactor
of 480 mm length with an internal diameter 40 mm, electrically heated by two separately
controlled 1.5 Kw tube furnaces. Pyrolysis of the plastic (2 g) took place in the first stage,
heating the plastic at 10 °C min-1 from room temperature to 500 °C and held at 500 °C for 30 minutes. The evolved pyrolysis volatiles were passed directly to the second stage reactor
containing 2 g of the Zeolite catalyst mixed with 2 g of quartz sand previously heated to 500
°C. For comparison, where no catalyst was used, quartz sand (4g) was substituted for the
catalyst. The ratio of plastic to catalyst mass was maintained at 1:1. The condenser system
6
Tedlar™ gas sample bag for collection of non-condensable gases. After the experiment, the
condensers were immediately sealed to prevent evaporation of highly volatile products and
weighed The liquid products were dissolved in dichloromethane (DCM) and stored in a
freezer, prior to analysis.
2.3 Gas Analysis: Gases collected in the Tedlar™ gas sample bag were analysed
immediately after each experiment by packed column gas chromatography (GC). A Varian
CP 3380 GC analysed hydrocarbons from C1 to C4 on a 2 m x 2 mm GC column with 80-100
mesh size HayeSep packing and flame ionization detector. Injector temperature was 150 °C
and detector temperature was 200 °C. A separate Varian CP-3380 GC analysed H2, N2, and
CO on a 2 m x 2 mm GC column with 60-80 mesh molecular sieve and a thermal
conductivity detector (TCD). CO2 was analysed using the same Varian GC but on a separate
HayeSep 80–100 mesh GC column and TCD.
2.4 Oil analysis: The product oil collected in the condenser system were combined and
analysed using a Varian 430 GC with a ZB-1 30 m x 0.53 mm capillary column,
split/splitless injection, H2 mobile phase and FID. Injection volume was 2.0 L. The
temperature programme was from 40 °C to 310 °C at 5 °C min–1 heating rate. The system was calibrated with aromatic and polycyclic aromatic hydrocarbon standards. The product oil
samples were diluted in dichloromethane (analytical reagent grade) prior to injection into the
gas chromatograph. The confirmation of the identification of the aromatic components in the
oil used relative retention indices and additionally GC/mass spectrometry (GC/MS). The
GC/MS was a Varian CP-3800 GC/Varian Saturn 2200 MS fitted with a 30m × 0.25 m DB-5
capillary column.
The product oils were analysed for their boiling point range distribution using gas
7
D2887). The analysis used the Varian 430 GC with the ZB-1 column and FID used for the
detailed oil analysis.
2.5 Characterization of reacted catalysts: The used catalysts were analysed by
temperature-programmed oxidation (TPO) used a Shimadzu 50A thermo gravimetric analyser
(TGA) to determine the amount of carbon (coke) on the catalyst. The procedure comprised
~15 mg of the used catalyst, heated in air at 15 °C min-1 to a temperature of 800 °C and held at 800 °C for 10 min. Scanning electron microscopy (SEM) with energy dispersive X-ray
spectrometry (EDXS) characterised the deposits on the reacted catalyst.
3.0 RESULTS AND DISCUSSION
3.1 Mixed plastic Characterization: The plastic samples were characterised using
thermogravimetric analysis (TGA) to characterise the thermal degradation of the plastics with
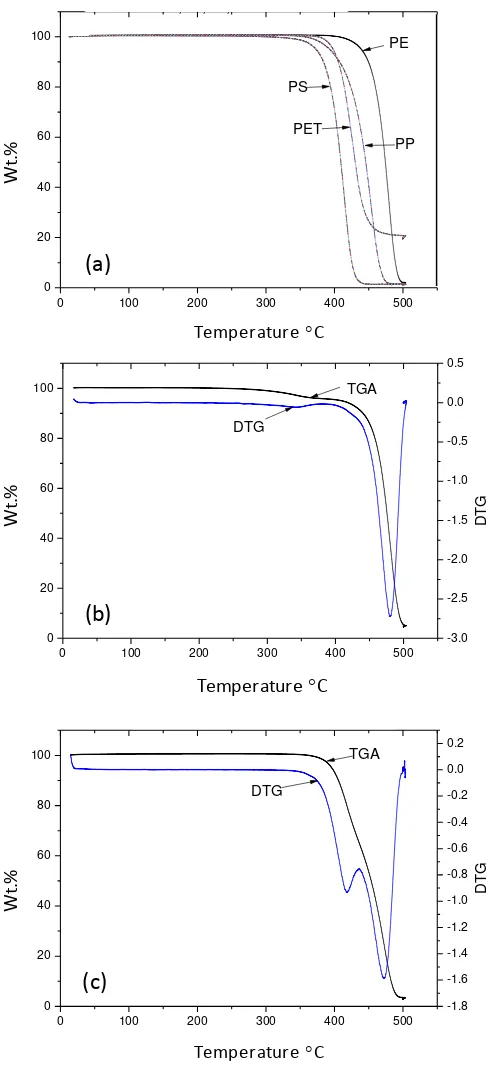
increasing temperature of pyrolysis. Figure 2(a) shows the TGA and thermograms of the
individual virgin plastics, Figure 2(b) the TGA and DTG of the real-world mixed plastic
(MP) and Figure 2(c) the TGA and DTG of the simulated mixture of plastic (SMP).
The TGA thermograms of the individual plastic polymers showed that polystyrene
showed the main degradation peak at a lower temperature (~420 °C) than the other polymers
and polyethylene had the highest degradation temperature (~480 °C). The order of thermal
degradation was PS<PET<PP<PP. The mass loss thermograms for the real-world mixed
plastic waste showed a DTG single peak at 480 °C which is consistent with its reported
composition of mainly polyalkene plastics. The simulated mixture of plastics showed two
areas of weight loss on the TGA as shown by the two DTG peaks indicating weight loss
attributed to the PS and PET composition at the lower temperature (~420 °C) and the PE and
8
3.2 Product Yield: Figure 3(a) and 3(b) show the product yield obtained from the
un-catalysed and un-catalysed pyrolysis of the real-world mixed plastic, the simulated plastic
mixture and the four virgin plastics respectively. Virgin plastic polystyrene gave a maximum
oil yield of ~97.0 wt% for uncatalysed pyrolysis with catalysed PET producing the lowest oil
yield (38.50 wt.%), with a significant production of char. Park et al. 24 investigated the pyrolysis and catalytic pyrolysis of polystyrene in a semi-batch reactor and reported an oil
yield of 96.7 wt.% at a reaction temperature of 480 °C for non-catalytic, thermal pyrolysis.
Similarly, Achilias et al. 25 reported an oil yield of 91.8 wt.% for the pyrolysis of polystyrene in a fixed bed reactor at 510 °C. Polyethylene and polypropylene, gave high wax yields of
over 80 wt.%, similar results have been reported before for the thermal pyrolysis of
polyalkene plastics. 7 The liquid products for the uncatalysed pyrolysis of real world mixed plastic (MP) and the simulated mixture of plastics gave similar product yields to that found
for polyethylene and polypropylene, reflecting the dominance of these polymers in the plastic
mixtures investigated. However, the mixed plastics also produced some char which reflects
the content of PET in the mixtures. The overall mass balances for the experiments is shown
in Figure 3 and shows that excellent mass closures were achieved.
The addition of the Zeolite HZSM-5 catalyst to the second stage catalytic reactor
produced a marked increase in gas production from the pyrolysis-catalysis of the plastics with
a resultant reduction in oil yield. The exception was for the polystyrene which maintained a
high yield of oil (91.5 wt %) in the presence of the catalyst. Similar observations on the
influence of catalysts on plastic pyrolysis were reported by Aguado et al.,14 and Lopez et al.
22,26
. For example, Lopez et al., 22 investigated the catalytic pyrolysis of packaging plastic
waste in a semi-batch reactor at 400 °C using a Zeolite HZSM-5 catalyst. They obtained a
product yield for the non-catalytic experiment of 79.3 wt% liquid, 17.7 wt% gas and 3.0 wt%
9
the catalyst. Ateş et al., 21 also reported a reduction in the oil produced in the catalytic pyrolysis of municipal solid waste derived plastics when Zeolite HZSM-5 catalyst was added
to the process of catalytic pyrolysis.
The mass of carbon deposited on the catalyst during pyrolysis determined by TPO
showed that the carbon deposition was only 0.48 wt.% of the mass of reacted catalyst.
Similarly, scanning electron microscopy observation of the reacted catalyst after the
pyrolysis-catalysis experiments did not reveal any significant carbon deposition on the
catalyst surface. Kumar et al. 27 have reported that low acidity Zeolite catalysts, with a high Si:Al ratio (such as that used in this work), would produce lower coke formation than a high
acidity, low Si:Al ratio catalyst, but with the disadvantage that the lower acidity means that
the catalyst is less effective in cracking hydrocarbons compared to a high acidity catalyst.
3.3 Gas Composition: Figure 3 showed that the addition of the Zeolite HZMS-5 catalyst
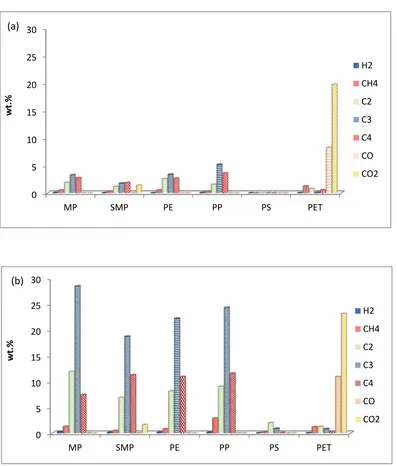
to the second stage of the reactor system produced a marked rise in gas yield. Figure 4 shows
the concentration of the product gases with and without the presence of the Zeolite catalyst
for the pyrolysis and pyrolysis-catalysis of the real world plastics (MP) the simulated mixture
of plastics (SMP) and the virgin plastics (PE, PP, PS, PET). Figure 3(a) shows that the main
gases produced during the thermal pyrolysis of MP, SMP, PE and PP in the absence of the
catalyst were C2 (mainly ethene with lower concentrations of ethane), C3 (mainly propene)
and C4 gases (mainly butene). These plastic samples consisted of mainly polyalkene polymer
structures. The polyalkene plastics are thermal degraded via a random scission process to
produce mainly alkene gases, C2H4, C3H6, and C4H8 and to a lesser extent the alkane gases,
C2H6, C3H8 and C4H10. 28 The pyrolysis of polystyrene produced little gas. For PET, the
main gases were CO2, formed from the decarboxylation of the polymer and CO also formed
10
The addition of the Zeolite HZSM-5 catalyst showed a marked rise in the yield of the C2 – C4 hydrocarbon gases, but particularly C3 hydrocarbons for the pyrolysis-catalysis of the
MP, SMP, PE and PP plastics (Figure 4(b)). The yield and composition of the product gases
from the pyrolysis-catalysis of PS and PET (Figure 3(b) and Figure 4(b)) showed only a
small influence when the Zeolite catalysts was introduced to the process. The enhanced
production of hydrocarbon gases with the introduction of a Zeolite catalyst has been reported
by other researchers.13, 17, 26, 27 For example, Lopez et al., 26 also reported that the main gases
derived from the thermal processing of a mixture of plastics (PE, PP, PS, PET, PVC) was
methane, ethene, ethane, and C3-C4 gases. The C3-C4 hydrocarbons were the highest product
gases. They also reported the presence of CO and CO2 derived from the PET in the plastic
mixture. The introduction of a Zeolite HZSM-5 catalyst to their process produced an overall
increase in gas yield, including C3-C4 hydrocarbon gases.
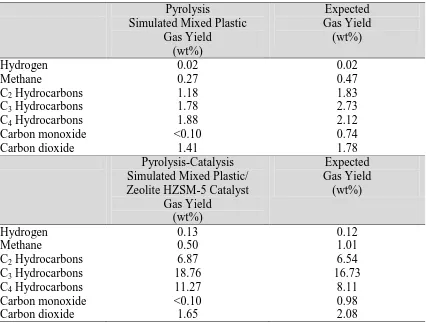
Table 2 shows the concentration of the gases produced from the pyrolysis and
pyrolysis-catalysis of the simulated mixture of plastics compared with the expected gas composition
based on the proportions of the individual plastics. The gas composition for the simulated
mixture of plastics showed a higher yield of the C2, C3 and C4 gases than expected, based on
the proportions of each gas generated by the individual virgin polymers which suggests some
interaction between the individual virgin plastics in the mixture. Carbon monoxide and
carbon dioxide yield from the pyrolysis and pyrolysis-catalysis was lower than would be
expected, suggesting interaction of the mixture of plastics.
Jing et al. 29 used a closed batch reactor to investigate the pyrolysis of a 50:50 ratio
mixture of LDPE and PP and also reported interaction between the polymers. The yield of
alkane gases, C2H6, C3H8 and C4H10 was increased compared to that expected from the
11
also showed that for several different plastics, mixing the individual plastic with polystyrene
produced a clear interaction between the plastics, resulting in increased yield of alkene gases.
3.4 Oil Composition: The product yield from the pyrolysis-catalysis of the plastics
shown in Figure 3 showed a reduction in oil yield when the Zeolite catalyst was introduced to
the second stage of the pyrolysis-catalysis process. However, the composition of the oils was
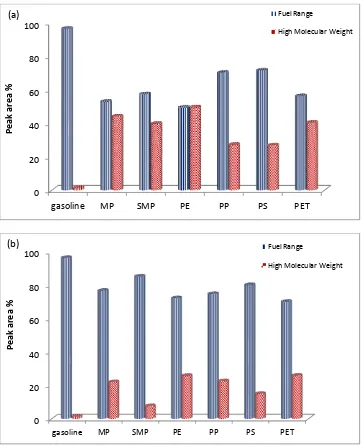
greatly influenced by the presence of the catalyst. Figure 5 shows the influence of the
addition of the Zeolite HZSM-5 catalyst on the fuel range hydrocarbons, i.e. C5-C15 and the
high molecular weight, i.e. C16+ compounds, for the uncatalysed (Figure 5(a)) and catalysed
(Figure 5(b)) product oils respectively. The results are compared to gasoline hydrocarbons.
The uncatalysed pyrolysis of the plastic samples showed a high proportion of fuel range
hydrocarbons, but also significantly a high content of the high molecular weight
hydrocarbons from C16 and above. However, in the presence of the catalyst the fuel range
hydrocarbons dominate the composition of the product oil. Sakata et al. 30 investigated the pyrolysis and catalytic pyrolysis of polyethylene and polypropylene for several different
catalysts, including Zeolite ZSM-5. For processing of polyethylene they reported a pyrolysis
oil yield of 69.3 wt.% which decreased to 49.8 wt.% when Zeolite ZSM-5 catalyst was
present, with a corresponding rise in gas yield from 9.6 wt.% to 44.3 wt.%. They also
reported for polypropylene, an oil yield of 80.1 wt.% for thermal pyrolysis was obtained
which decreased to 47.0 wt.% with the Zeolite catalyst and gas yield increased from 6.6 wt.%
to 50.0 wt.%. They attributed the changes as due to the strong surface acidity of the Zeolite
ZSM-5 catalyst which promotes the degradation and/or cracking of the heavier hydrocarbons
into lighter hydrocarbons. Although the oil yield was reduced with the catalyst, Sakata et al.
30
showed that the majority of the hydrocarbons in the product oil had a carbon number
distribution in the gasoline range compared to the uncatalysed pyrolysis oil with a
12
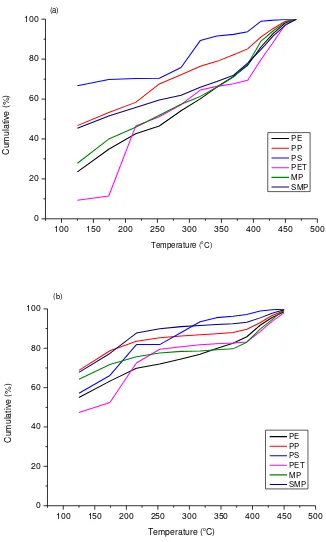
The product oils from the thermal pyrolysis and catalytic pyrolysis of the plastic samples
were analysed for their fuel properties, by way of simulated distillation using gas
chromatography to determine the boiling range distribution of the oils. The results are shown
in Figure 6. The uncatalysed oils showed a significant fraction of the oils have a boiling
point range of greater than 250 °C, however, the catalytic pyrolysis product oils show a shift
to lower boiling points, reflecting the shift in molecular weight range as shown in Figure 5.
Although, there was an improvement in the properties of the product oils in the presence of
the catalyst, boiling range distributions for gasoline would be >95% below 150 °C. However,
for the pyrolysis-catalysis product oils, the boiling range fraction below 150 °C was between
50 % and 70%.
The hydrocarbon composition of the oils produced from the pyrolysis and
pyrolysis-catalysis of the plastic samples presented as fuel range (C5-C15) and the high molecular
weight (C16+) hydrocarbons shown in Figure 5 may also be presented in terms of their
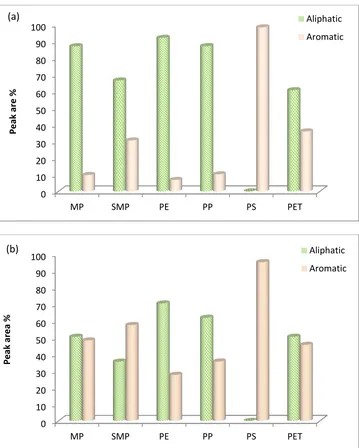
aromatic and aliphatic content. Figure 7 shows the composition of the product oils from
pyrolysis (Figure 7(a)) and also the pyrolysis-catalysis (Figure 7(b)) of the real world plastics
(MP) the simulated mixture of plastics (SMP) and virgin plastics (PE, PP, PS, PET). For the
plastic samples containing the polyalkene polymers (MP, SMP, PE, PP) the oil produced
from pyrolysis was mainly aliphatic in nature, however, the polystyrene and polyethylene
terephthalate produced an aromatic oil derived from the aromatic nature of the polymer
structure. The polyethylene and polypropylene pyrolysis oil would be expected to be almost
wholly aliphatic in content, but there was some aromatic content, which may be due to the
cracking reactions over the sand placed in the second stage reactor (for the uncatalysed
experiments) also resulting in an extended time in the hot zone of the reactor. Abbas-Abadi et
al. 31 have reported an aromatic content of 10% in the pyrolysis oil from pyrolysis of
13
wt.% for the pyrolysis of polypropylene using a fluidised bed reactor, at 668 °C (a higher
temperature than used in this work). Both Abas-Abadi et al. 31 and Jung et al. 32 reported
increasing aromatic content in the product oils with increasing temperature. The PET
produced an oil which consisted of a mainly aromatic content with benzoic acid detected in
large quantities (~30 wt.%).
When the Zeolite HZSM-5 catalyst was introduced into the process, the aromatic content
of the product oils increased significantly with a decline in the aliphatic content of the oils.
The polyalkene plastics, PE and PP and the MP and SMP plastic mixtures, (both of which
were dominated by PE and PP), produced oils with a marked rise in aromatic content in the
presence of the Zeolite ZSM-5 catalyst. For the aromatic-containing polymers, PS and PET,
the product oils from thermal pyrolysis had a high aromatic content which further increased
when the catalyst was present in the process. The benzoic acid found in the oil from the
thermal pyrolysis of PET was reduced in the presence of the Zeolite catalyst being cracked to
mainly toluene. Zeolite catalysts are known to produce aromatic hydrocarbons during
catalytic pyrolysis of plastics due to the properties of surface area, porosity and silica:alumina
ratio of the catalyst. The silica:alumina ratio influences the surface acidity of the catalyst
with lower ratios (higher relative surface alumina concentration) producing an increase in the
surface acidity of the catalyst.33 For Zeolite catalyst, surface acidity equates with catalytic activity and the manipulation of the pore size of the Zeolite structure enables reaction
selectivity. It has been shown that low silica:alumina ratio catalysts with consequently higher
surface acidity and surface catalytic activity produce oils with increased content of aromatic
compounds from the pyrolysis-catalysis of PE using different Zeolite catalysts.5,20 The
Zeolite HZSM-5 catalyst used in this work had a Si:Al ratio of 50, which is relatively high
and consequently the catalysts had a relatively lower surface acidity and catalyst activity for
14
through the restriction of the size of the hydrocarbon molecule which can enter the pore
structure and participate in catalytic reactions of cracking and reformation which produce the
aromatic hydrocarbons. 33 Therefore, any large molecular weight material which are formed from pyrolysis of the plastic would have to be thermally decomposed on the catalyst surface
before they could enter the controlled pore size of the catalyst. Kumar et al. 27 have discussed, in detail, the role of catalysts, including Zeolite catalysts, in the mechanism of catalytic
thermal degradation of plastics. They summarised the main steps of catalytic pyrolysis as,
diffusion on the catalyst surface, adsorption, chemical reaction, desorption from the catalyst
and diffusion in the liquid phase.
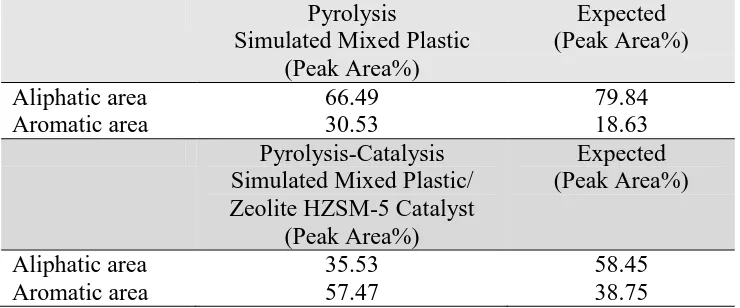
Table 3 shows the aliphatic and aromatic hydrocarbon content of the product oil for the
pyrolysis and pyrolysis-catalysis of the simulated mixed plastics (SMP) compared with the
expected content based on the proportions of the individual plastics. The aromatic
hydrocarbon content in the oils from the pyrolysis and pyrolysis-catalysis of the simulated
mixed plastics was significantly higher than expected from the proportions derived from the
individual virgin plastics. This increase in aromatic content in the product oils suggests there
is some interaction of the individual virgin plastic that composed the SMP. Jing et al. 29 reported that for pyrolysis of a 30:70 mixture ratio of PE and PP, there was an increase in
aromatic content of the product oil compared to the expected concentration of aromatics
derived from the proportions of the individual plastics, suggesting significant interaction.
Williams and Williams 7 mixed polystyrene in binary mixtures with HDPE, LDPE, PP, PVC and PET and analysed the product oil from pyrolysis of the mixtures. It was reported that the
concentration of single, two and three ring aromatic hydrocarbons in the product oil were
influenced by the interaction of each plastic with the polystyrene.
The aromatic hydrocarbons in the product oils from the pyrolysis and pyrolysis-catalysis
15
are shown in Figure 8 (a) and 8(b). The results are expressed in terms of the peak area in
relation to the gas chromatogram obtained from analysis. The results show that the
uncatalysed pyrolysis oil (Figure 8(a)) for the polystyrene contained mainly styrene, derived
from the polystyrene polymer. Park et al. 24 have also reported high concentrations of styrene
for thermal pyrolysis of polystyrene, for example 76.31 wt.% styrene was reported at a
pyrolysis temperature of 450 °C. The simulated plastic mixture also contained significant
amounts of styrene, but more than would be expected based on the simulated composition,
suggesting that there was some interaction between the plastics. Lopez et al. 26 investigated the pyrolysis and pyrolysis-catalysis of a mixture of plastics and reported a higher than
expected content of styrene, as also reported here for the simulated mixture of plastics.
Lopez et al. 26 also suggests that other mechanisms such as secondary reactions result in the higher styrene content.
The main aromatic compounds produced from catalytic pyrolysis of the plastic samples
with Zeolite HZSM-5 catalyst shows (Figure 8(b)) they are mainly single ring aromatic
compounds with benzene, toluene, ethyl benzene, xylenes and styrene accounting for a
significant proportion as reported by others. 11, 13, 26 Benzene is produced in high yield for the pyrolysis-catalysis of the plastic samples, but particularly for PET and for SMP as the
catalyst is introduced, while styrene yields are reduced. The reduction of styrene
concentration in the presence of a Zeolite catalyst has been attributed to the carbenium nature
of the acid catalysed decomposition of polystyrene leads to the formation of aromatic
products other than styrene.12 Lopez et al. 26 for a simulated mixture of plastics processed at 500 °C, reported toluene concentrations (% peak area) of 8.1% for pyrolysis which increased
to 17.5% in the presence of a Zeolite ZSM-5 catalyst, ethylbenzene increased from 5.0% to
9.6% and xylenes increased from <3.0% to 13.8%. Bagri and Williams34 investigated the
16
ZSM-5 catalyst. The uncatalysed pyrolysis oils were found to contain large amounts of
styrene. However, the addition of Zeolite catalyst resulted in a marked decrease in styrene
concentration in the product oils and increased concentrations of mono aromatic compounds.
Lin and White 35 have also reported that the thermal degradation of polystyrene produces
high yields of styrene, but catalytic pyrolysis with ZSM-5 catalyst, markedly reduced styrene
concentration and increased the production of benzene, in addition, ethylbenzene and toluene
were also formed at lower concentrations.
4.0 CONCLUSIONS
A two-stage pyrolysis-catalysis fixed bed reactor was used to investigate the product yield,
composition and hydrocarbon distribution from the pyrolysis and the pyrolysis-catalysis of
real-world mixed plastics, simulated mixed plastic and four virgin plastics in the presence of
a Zeolite HZSM-5 catalyst. For the uncatalysed pyrolysis of the plastics, a high yield of
oil/wax was obtained for the plastic material in the range of 81-97 wt.%. The yield of
oil/wax decreased with addition of catalyst to between 44-51 wt.%, depending on the plastic
with a resultant increase in gas yield. However, the composition of the pyrolysis-catalysis oils
was significantly increased in aromatic hydrocarbon content. In addition, the composition of
the oils was shifted from high molecular weight hydrocarbons (C16+) to fuel range
hydrocarbons (C5-C15), with a high content of single ring aromatic hydrocarbons such as
benzene, toluene, ethylbenzene, xylenes and styrene. The yield and composition of the
products obtained from the pyrolysis and pyrolysis-catalysis of the simulated mixture of
plastics (PE, PP, PS, PET) were compared with those obtained from the expected results
based on the individual plastic data. The results showed that there was interaction between
17
gases than expected, based on the proportions of each gas generated by the individual virgin
polymers. In addition, the aromatic hydrocarbon content in the oils from the simulated
mixture of plastics (SMP) was also higher than expected.
ACKNOWLEDGEMENTS
The financial support of a scholarship from the Petroleum Technology Development Fund of
18
REFERENCES
(1) Energy Outlook 2014. World Energy Investimate Outlook ,Special Report. International Energy Agency Publications, International Energy Agency, Paris, France. 2014
(2) Plastics Europe. Plastics: The Facts 2013. Plastic Europe:Association of Plastic Manufacturer, Brussels, 2014
(3) Bajus, M.; Hájeková, E. Petroleum & Coal, 2010, 52, 164-172.
(4) Schiers J.; Kaminsky W., Feedstock Recycling & Pyrolysis of waste Plastics, John Wiley & Sons Ltd, Chichester, pp 285-314, 2006
(5) Al-Salem, S.; Lettieri, P.; Baeyens, J.. Waste Manag., 2009, 29, 2625-2643.
(6) Marcilla, A.; Beltrán, M.; Navarro, R. Appl. Catal. B-Environ., 2009, 86, 78-86.
(7) Williams P.T.; Williams E.A., Energ. Fuels, 1999, 13, 188-196.
(8) Kaminsky, W.; Predel M.; Sadiki, A. Polym Degrad Stab, 2004, 85, 1045-1052.
(9) UNEP, United Nations Environmental Programme: Converting Waste Plastics into a Resources, International Environmental Technology Centre, Osaka, Japan, 2009
(10) Wu C.; Williams P.T., Chapter 1: Advanced Thermal Treatment of Wastes for Fuels, Chemicals and Materials Recovery. In, Waste as a Resource, Hester R.E.; Harrison R.M. (Eds), Royal Society of Chemistry Publishers, London, 1-43, 2013
(11) Bagri, R.; Williams, P.T. J. Anal. Appl. Pyrol., 2002, 63, 29-41.
(12) Serrano, D.; Aguado, J.; Escola, J. Appl. Catal. B- Environ., 2000, 25, 181-189.
(13) Serrano, D.P.; Aguado, J.; Escola, J.M. ACS Catalysis, 2012, 2, 1924-1941.
(14) Aguado, J.; Serrano, D.P.; Escola, J.M. Ind. Eng. Chem. Res., 2008, 47, 7982-7992.
(15) Rahimi, N.; Karimzadeh, R.. Appl. Catal. A-Gen., 2011, 398, 1-17.
(16) Creyghton, E.; Downing, R. J. Mol. Catal. A-Chem., 1998, 134, 47-61.
(17) Aguado, J.; Serrano, D.; San Miguel, G.; Castro, M.; Madrid, S. J. Anal. Appli. Pyrol., 2007, 79, 415-423.
(18) Lin, Y.H. Polym. Degrad. Stabil., 2009, 94, 1924-1931.
(19) Lee, K.H.; Shin, D.H. Waste Manag., 2007, 27, 168-176.
(20) Pinto, F.; Costa, P.; Gulyurtlu, I.; Cabrita, I.. J. Anal. Appl. Pyrol., 1999, 51, 39-55.
(21) Ateş, F.; Miskolczi, N.; Borsodi, N.. Bioresource Technol., 2013, 133, 443-454.
(22) Lopez, A.; De Marco, I.; Caballero, B.M.; Laresgoiti, M.F.; Adrados, A. J. Anal. Appl. Pyrol., 2012, 96, 54-62.
19
(24) Park, J.J.; Kim, J.S.; Maken S.; Song, H.; Shin H.; Park, J.W.; Choi M.J. Energ. Fuel., 2003, 17, 1576-1582.
(25) Achilias, D.S.; Kanellopoulou, I.; Megalokonomos, P.; Antonakou, E.; Lappas, A.A., Macromol. Mater. Eng. 2007, 292, 923-934.
(26) Lopez, A.; De Marco, I.; Caballero, B.; Laresgoiti, M.; Adrados, A; AranzabaL, A. Appl. Catal. B-Environ., 2011, 104, 211-219.
(27) Kumar, S.; Panda, A.K.; Singh, R.K. Resource., Conserv. Recycl., 2011, 55, 893-910.
(28) Williams P.T. Chapter 11, In, Schiers J.; Kaminsky W., Feedstock Recycling & Pyrolysis of waste Plastics, John Wiley & Sons Ltd, Chichester, pp 285-314, 2006
(29) Jing X.; Zhao Y.; Wen H.; Xu Z. Energ. Fuels, 2013, 27, 5841-5851.
(30) Sakata Y.; Uddin M.A.; Muto A., J. Anal. Appl. Pyrol., 1999, 51, 135-155.
(31) Abas-Abadi M.S.; Haghighi M.N.; Yeganeh H.; McDonald A.G., J. Anal. Appl. Pyrol., 2014, 109, 272-277.
(32) Jung S.H.; Cho M.H.; Kang B.S.; Kim J.S., Fuel Proc. Technol., 2010, 91, 277-284.
(33) Venuto P.B.; Habib T.E., Fluid catalytic cracking with zeolite catalysts. Marcel Dekker, New York, 1979.
(34) Bagri R.; Williams P.T., J. Energ. Instit, 2002, 75, 117-123.
20
Table 1. Composition of waste plastics used for research
Waste HDPE
(wt%) LDPE (wt%) PP (wt%) PS (wt%) PET (wt%) PVC (wt%) Others (wt%) Reference Slovenia P-MSW1
652 - 9 9 10 1 6 Ref.3
Synthetic mixture
34.57 34.583 9.57 9.57 10.64 1.07 - Ref.3
South Taiwan P-MSW
38 24 34 1 - 3 - Ref.18
Synthetic mixture
33 22 33 11 - - - Ref.19
Synthetic mixture
682 - 16 16 - - - Ref.20
Hungary P-MSW
59.12 - 25 7.2 - - 8.74 Ref.21
Synthetic mixture
402 - 35 18 4 3 - Ref.22
Synthetic mixture
30 - 30 20 5 10 5 Ref.23
1 Plastics from MSW 2
Comprises, HDPE & LDPE
21
Table 2. Interaction of plastics in relation to the gas composition for the pyrolysis and pyrolysis-catalysis of the simulated mixture of plastics compared with the expected gas composition based on the proportions of the individual plastics.
Pyrolysis
Simulated Mixed Plastic Gas Yield
(wt%)
Expected Gas Yield
(wt%)
Hydrogen 0.02 0.02
Methane 0.27 0.47
C2 Hydrocarbons 1.18 1.83
C3 Hydrocarbons 1.78 2.73
C4 Hydrocarbons 1.88 2.12
Carbon monoxide <0.10 0.74
Carbon dioxide 1.41 1.78
Pyrolysis-Catalysis
Simulated Mixed Plastic/ Zeolite HZSM-5 Catalyst
Gas Yield (wt%)
Expected Gas Yield
(wt%)
Hydrogen 0.13 0.12
Methane 0.50 1.01
C2 Hydrocarbons 6.87 6.54
C3 Hydrocarbons 18.76 16.73
C4 Hydrocarbons 11.27 8.11
Carbon monoxide <0.10 0.98
22
Table 3. Interaction of plastics in relation to the aliphatic and aromatic content of the product oil for the pyrolysis and pyrolysis-catalysis of the simulated mixture of plastics compared with the expected content based on the proportions of the individual plastics.
Pyrolysis
Simulated Mixed Plastic (Peak Area%)
Expected (Peak Area%)
Aliphatic area 66.49 79.84
Aromatic area 30.53 18.63
Pyrolysis-Catalysis Simulated Mixed Plastic/ Zeolite HZSM-5 Catalyst
(Peak Area%)
Expected (Peak Area%)
Aliphatic area 35.53 58.45
23
Figure Captions
Figure 1. Schematic diagram of the two-stage pyrolysis-catalysis reactor system
Figure 2. Themogravimetric Analysis for (a) individual virgin plastics, (b) real-world mixed plastics (MP) and (c) simulated mixed plastic (SMP)
Figure 3. Product yield and mass balance (MB) for non-catalytic 3(a) and catalytic 3(b) pyrolysis of real world plastics (MP) the simulated mixture of plastics (SMP) and virgin plastics (PE, PP, PS, PET).
Figure 4. Gases produced from 4(a) non-catalytic 4(b) catalytic pyrolysis of real world plastics (MP) the simulated mixture of plastics (SMP) and virgin plastics (PE, PP, PS, PET).
Figure 5. Influence of HZSM-5 on the distribution of fuel range (F.R.) and high molecular weight (HMWt) compounds in non-catalysed (5a) and catalysed (5b) product oil from processing of real world plastics (MP) the simulated mixture of plastics (SMP) and virgin plastics (PE, PP, PS, PET) in comparison to gasoline.
Figure 6. Simulated distillation of (a) the uncatalysed pyrolysis oil and (b) the pyrolysis-catalysis product oils.
Figure 7. Distribution of aliphatic and aromatics hydrocarbons in 6(a) non-catalysed and 6(b) catalysed (b) product oil from processing of real world plastics (MP) the simulated mixture of plastics (SMP) and virgin plastics (PE, PP, PS, PET).
Figure 8. Yields of some selected aromatic compounds in 7(a) non-catalysed and 7(b)
24
Figure 1 Schematic diagram of the two-stage pyrolysis-catalysis reactor system Furnace
Furnace Thermocouple
Plastic
Nitrogen
Catalyst
Condenser System
25
Figure 2 Themogravimetric Analysis for (a) individual virgin plastics, (b) real-world mixed plastics (MP) and (c) simulated mixed plastic (SMP)
0 100 200 300 400 500
0 20 40 60 80 100
Temp. oC
Wt.% TGA DTG (a) -1.8 -1.6 -1.4 -1.2 -1.0 -0.8 -0.6 -0.4 -0.2 0.0 0.2 DTG
Sim. Mixed Plastic TGA DTG plot
0 100 200 300 400 500
0 20 40 60 80 100
Temperature o
C
wt.%
Mixed plastic TGA DTG plot
TGA DTG (b) -3.0 -2.5 -2.0 -1.5 -1.0 -0.5 0.0 0.5 DTG
0 100 200 300 400 500
0 20 40 60 80 100 Temp(oC) wt.% PE PS PP PET (c)
TGA of PE,PP,PS,PET
Temperature C
Temperature C
Temperature C
26
Figure 3. Product yield and mass balance (MB) for non-catalytic (a) and catalytic (b) pyrolysis of real world plastics (MP) the simulated mixture of plastics (SMP) and virgin plastics (PE, PP, PS, PET).
0 20 40 60 80 100 120
MP SMP PE PP PS PET
Gas
Oil
Char
MB
(a)
0 20 40 60 80 100 120
MP SMP PE PP PS PET
Gas
Oil
Char
MB
27
Figure 4. Gases produced from (a) non-catalytic (b) catalytic pyrolysis of real world plastics (MP) the simulated mixture of plastics (SMP) and virgin plastics (PE, PP, PS, PET).
0 5 10 15 20 25 30
MP SMP PE PP PS PET
w
t
.%
H2
CH4
C2
C3
C4
CO
CO2
(a)
0 5 10 15 20 25 30
MP SMP PE PP PS PET
w
t
.%
H2
CH4
C2
C3
C4
CO
CO2
28
Figure 5. Influence of HZSM-5 on the distribution of fuel range and high molecular weight compounds in non-catalysed (a) and catalysed (b) product oil from processing of real world plastics (MP) the simulated mixture of plastics (SMP) and virgin plastics (PE, PP, PS, PET) in comparison to gasoline.
0 20 40 60 80 100
gasoline MP SMP PE PP PS PET
P
e
a
k
a
r
e
a
%
Fuel Range
High Molecular Weight
(a)
0 20 40 60 80 100
gasoline MP SMP PE PP PS PET
P
e
a
k
a
r
e
a
%
Fuel Range
High Molecular Weight
29
Figure 6. Simulated distillation of (a) the uncatalysed pyrolysis oil and (b) the pyrolysis-catalysis product oils.
100 150 200 250 300 350 400 450 500 0 20 40 60 80 100 Cum u la ti v e (% )
Temperature (oC)
PE PP PS PET MP SMP (a)
100 150 200 250 300 350 400 450 500
0 20 40 60 80 100 Cum u la ti v e (% )
Temperature (oC)
30
Figure 7. Distribution of aliphatic and aromatics hydrocarbons in (a) non-catalysed and (b) catalysed (b) product oil from processing of real world plastics (MP) the simulated mixture of plastics (SMP) and virgin plastics (PE, PP, PS, PET).
0 10 20 30 40 50 60 70 80 90 100
MP SMP PE PP PS PET
P e a k a r e % Aliphatic Aromatic (a) 0 10 20 30 40 50 60 70 80 90 100
MP SMP PE PP PS PET
31
Figure 8. Yields of some selected aromatic compounds in (a) non-catalysed and (b) catalysed product oil from processing of real world plastics (MP) the simulated mixture of plastics (SMP) and virgin plastics (PE, PP, PS, PET).
0 20 40 60 80
MP SMP PE PP PS PET
Benzene
Toluene
Ethylbenzene
Xylenes
Styrene
(a)
0 20 40 60 80
MP SMP PE PP PS PET
Benzene
Toluene
Ethylbenzene
Xylenes
Styrene
