ii
CONFIRMATION SUPERVISOR
‘I/We acknowledge that have read this thesis and in my/our opinion this thesis is sufficient in term of scope and quality for the award of Bachelor of
Technopreneurship with Honor’
Signature: ……….
Supervisor Name: ………. Date: ……….
iii
FACTORS INFLUENCING CUSTOMER PERCEPTION AND PURCHASE INTENTION ON GREEN PRODUCT
SYARIFAH NORATIQAH BT SY KAMARUZZAMAN
Report submitted in fulfilment of the requirement for the degree of Bachelor of Technopreneurship with Honor
Faculty of Technology Management and Technopreneurship Universiti Teknikal Malaysia Melaka
iv
“I declare that this project is the result of my own research except as cited in the references. The research project has not been for any degree and is not concurrently
submitted in candidature of any other degree.”
Signature:
Name: Syarifah Noratiqah bt Sy Kamaruzzaman
v
DEDICATION
vi
ACKNOWLEDGEMENT
First of all, I am grateful to Allah S.W.T for establishing me to complete this research. Without His consent, I would never complete my final year project.
Secondly, I would like to express my sincere gratitude and appreciation to my loyal supervisor Mr. Hasan bin Saleh for the continuous support of my research, patience, motivation, enthusiasm, and immense knowledge. His guidance helped me in all the time of research and writing of this report. I attribute the level of my Bachelor’s Degree because of his encouragement and effort and without his this project would not have been completed. I am deeply grateful for the guidance towards this project whereby his advice and encouragement played an important and major role for the success of project.
An honourable mention goes to my beloved parents, Syed Kamaruzzaman bin Syed Abdullah and Sharifah Aloyah bt Syed Ali for giving support and encouragement to pursue my study, and giving love completely from the uterus until now. Special thanks to Syed Muhammad Ismail bin Syed Hussein for giving trust, patience, understanding and encouragement.
My sincere thanks also goes to Mahsuri bt Baharu, Farhana bt Mohd Nazmi, Siti Nor Ariza bt Zaid, Rafizah bt Jamadin and Roslizawati bt Mat Jaafar for their love, support, advice, and the good laugh we had together. All the knowledge and happinest that you all give it to me, I will keep in my minds always.
Lastly, appreciation is also extended to my fellow course mate and all those involved either directly or indirectly help the success of this research project. Hopefully this report will be a reference to the other students in the future.
vii
ABSTRACT
The aim of the study is to identify the relation between customer perception and purchase intention on green product. In this, the purchase intention elements or the independent variables consist of green packaging, price promotion of green product, green advertising and green product value. Firstly the researcher will determine whether consumer perception on green product elements partially in relation with purchase intention. Second, the study will investigate factors of consumer purchase intention on green products. Thirdly, the scope is to identify influence of perception toward purchase intention on green product. The research method used to conduct the study is by quantitative approach where sample of 384 questionnaires will be distribute to consumer at shopping mall Melaka city. In findings of this study, all the independent variables will be analysis using Pearson Correlation simple Regression. To complete this study, researcher used Theory of Planned Behavior (TPB) to apply it.
viii
ABSTRAK
Tujuan kajian ini adalah untuk mengenal pasti hubungan antara persepsi pelanggan dan niat pembelian produk hijau. Dalam hal ini, unsur-unsur niat pembelian atau pembolehubah bebas terdiri daripada pembungkusan hijau, promosi harga produk hijau, pengiklanan hijau dan nilai produk hijau. Pada mulanya, penyelidik akan mengenalpasti sama ada persepsi pengguna mengenai unsur-unsur produk hijau sebahagiannya berhubung dengan hasrat pembelian. Kedua, kajian ini akan menyiasat faktor niat pembelian pengguna terhadap produk hijau. Ketiga, skop adalah untuk mengenal pasti pengaruh persepsi ke arah niat pembelian produk hijau. Kaedah kajian yang digunakan untuk menjalankan kajian ini ialah melalui pendekatan kuantitatif di mana sampel 384 soal selidik yang akan diedarkan kepada pengguna di pusat membeli belah bandar Dalam hasil kajian ini, semua pembolehubah bebas akan menggunakan analisis Korelasi Pearson Regresi mudah. Untuk melengkapkan kajian ini, penyelidik menggunakan Teori Tingkah Laku Terancang (TPB) untuk menggunakannya.
ix
TABLE OF CONTENTS
CHAPTERS CONTENTS PAGE NUMBER
CONFESSION ix
DEDICATION ix
ACKNOWLEDGEMENT ix
ABSTRACT ix
ABSTRAK ix
TABLE OF CONTENT ix
LIST OF TABLES ix
LIST OF FIGURES ix
Chapter 1 INTRODUCTION 1
1.1 Background of Research 1
1.2 Research Problem 2
1.3 Research Objective 3
1.4 Research Question 3
1.5 Scope of Research 4
1.6 Limitation of Research 4
1.7 Significant of Research 4
1.8 Summary 5
Chapter 2 LITERATURE REVIEW 6
2.1 Introduction 6
2.2 Definition 6
2.2.1 Green Product 6
2.2.2 Green Consumer 7
2.2.3 Green Purchase Intention 7
x
2.3.1. Green Packaging 10
2.3.2. Price Promotion of Green Product 10
2.3.3. Green Advertising 12
2.3.4 Green Product Value 13
2.5 Willingness to Pay More 15
2.6 Research Framework 16
2.7 Hypothesis of the Research 17
Chapter 3 RESEARCH METHODOLOGY 19
3.1 Research Design 19
3.2 Research Strategy 21
3.3 Data Collection 21
3.3.1 Quantitative Research 22
3.4 Analyzing Data 22
3.5 Research Population and Sample 23
3.6 Questionnaire Construction 25
3.7 Research Instrument 25
3.8 Data Analysis 26
3.8.1 Descriptive Analysis 26
3.8.2 Regression Analysis 27
3.9 Research Liability and Validity 28
3.9.1 Reliability 28
3.9.2 Validity 28
Chapter 4 DATA ANALYSIS 30
4.0 Introduction 30
4.1 Pilot Test 31
4.1.1 Reliability Testing 31
4.1.2 Validity Analysis of Each Question 32
4.2 Descriptive Statistic 39
4.2.1Section A: Respondents Demographic Profile
39
xi
4.2.3 Respondent’s Age 40
4.2.4 Respondent’s Race 42
4.2.5 Respondent’s Green Product Purchase 43 4.2.6 Types Of Green Product Purchase by
Respondent’s
44
4.3 Analysis Result Questionnaire 45
4.3.1 Green Packaging 45
4.3.2 Green Product Value 46
4.3.3 Green Advertisement 47
4.3.4 Eco-product Label 48
4.3.5 Green Purchase Intention 49
4.4 Result of Measurement 50
4.4.1 Test Validity 50
4.4.2 Validity test for 384 respondents 50
4.4.3 Reliability Test 53
4.4 Hypothesis Testing and Objective 55 4.4.1 Simple Regression Analysis 56 4.4.2 Multiple Regression Analysis 61
4.5 Summary 64
Chapter 5 CONCLUSION AND RECOMMENDATION 65
5.0 Introduction 65
5.1 Scale Measurement 66
5.1.1 Validity 66
5.1.2 Reliability 66
5.2 Discussion of Objective and Hypothesis Testing
67
5.2.1 Objective 1 67
5.2.2 Objective 2 69
5.2.3 Objective 3 70
5.3 Recommendation for Future Research 70
5.4 Conclusion 70
xii
APPENDIX 77
xiii
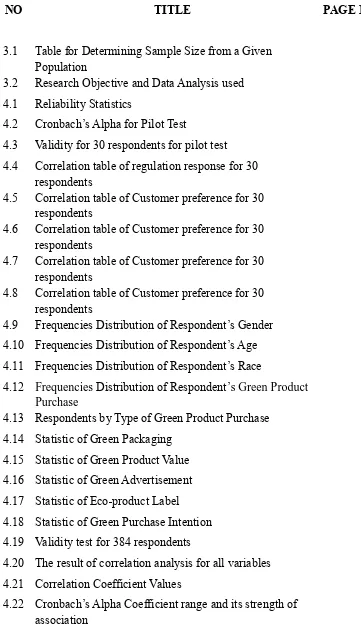
LIST OF TABLE
NO TITLE PAGE NUMBER
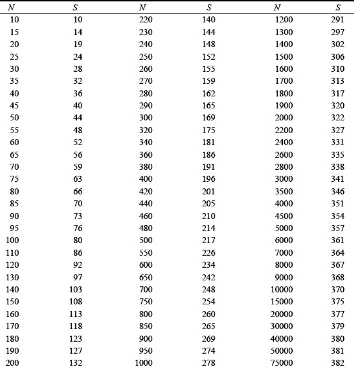
3.1 Table for Determining Sample Size from a Given
Population 23
3.2 Research Objective and Data Analysis used 25
4.1 Reliability Statistics 31
4.2 Cronbach’s Alpha for Pilot Test 32
4.3 Validity for 30 respondents for pilot test 33
4.4 Correlation table of regulation response for 30
respondents 34
4.5 Correlation table of Customer preference for 30
respondents 36
4.6 Correlation table of Customer preference for 30
respondents 37
4.7 Correlation table of Customer preference for 30
respondents 38
4.8 Correlation table of Customer preference for 30
respondents 39
4.9 Frequencies Distribution of Respondent’s Gender 39 4.10 Frequencies Distribution of Respondent’s Age 40 4.11 Frequencies Distribution of Respondent’s Race 42 4.12 Frequencies Distribution of Respondent’s Green Product
Purchase
43 4.13 Respondents by Type of Green Product Purchase 44
4.14 Statistic of Green Packaging 45
4.15 Statistic of Green Product Value 46
4.16 Statistic of Green Advertisement 47
4.17 Statistic of Eco-product Label 48
4.18 Statistic of Green Purchase Intention 49
4.19 Validity test for 384 respondents 50
4.20 The result of correlation analysis for all variables 52
4.21 Correlation Coefficient Values 52
4.22 Cronbach’s Alpha Coefficient range and its strength of
[image:12.595.110.471.123.761.2]xiv
4.23 Reliability Statistics for 384 respondents 55
4.24 Simple Regression Result for Hypothesis 1 56
4.25 Simple Regression Result for Hypothesis 2 58
4.26 Simple Regression Result for Hypothesis 3 59
4.27 Simple Regression Result for Hypothesis 4 60
4.28 Model Summary of multiple regressions 61
4.29 ANOVA Analysis 62
4.30 Table of coefficient 63
5.1 Summary of Hypothesis Results for Objective 1 67
xv
LIST OF FIGURES
NO TITLE PAGE NUMBER
2.1 Theory of Planned Behavior (TPB) Model 9
2.2 Research framework of factor of customer purchase intention on green product
16
3.1 Research Flow of Study 20
3.2 Table for Determining Sample Size from a Given Population
24
4.1 Frequencies Distribution of Respondent’s Gender 39
4.2 Frequencies Distribution of Respondent’s Age 40
4.3 Frequencies Distribution of Respondent’s Race 42
4.4 Respondent’s by Green Product Purchase 43
1 CHAPTER 1
INTRODUCTION
1.1 Background of Research
Unusual climate changes, global warming, health concern, and environmental
issues are the factors which have led consumers to behave “green‟ in their
purchasing decisions, (Do Paco and Raposo, 2009; Barber, 2010; Okada and Mais,
2010). The terms “green” or “sustainable” often refer to products, services or
practices that allow for economic development while conserving for future
generations, (Matthew Speer, 2011).
Interest in green products has grown in recent years, as indicated by increased
consumers demand, (Chen, 2008) including in Malaysia. Generally, Malaysian
consumers are more willing than before to favour green concepts, (Tan and Lau,
2010; Punitha and Azmawani Abd, 2011). Emerging markets for green products in
Malaysia means promising opportunities for green marketers. Importantly, Malaysia
has been ranked ninth for consumer awareness on the impact of air pollution and
global warming. Based on The Nielsen Global Online Environmental and
Sustainability Survey in 2011, nine out of ten Malaysians were aware of the impact
of the environmental issues, (The Edge, 2011).
The purpose of this study, green consumers are described as the ones who
take into consideration the environmental consequences of their consumption
patterns, and intend to modify their purchase and consumption behaviour for
reducing the environmental impact. Purchase decisions of green consumers are found
2
The purchase decisions are described in forms of supporting green companies,
purchasing green products (Albayrak et al., 2013; Schlegelmilch et al., 1996),
adopting sustainable consumption practices (Gadenne et al., 2011) and likely to
spend more for green products (Essoussi and Linton, 2010).
Industrial sector nowadays try to help and protect nature by producing
product that are environmentally friendly. However, green products are more
expensive compare to the conventional product. Consumer will think wisely to buy
product that will give benefit to them by comparing the prices. In addition, industrial
sector plays important role to do “green marketing” to attract customer perception
and purchase intention to buy green product. However, studies to unveil the
relationships between consumers’ perception of green products and green purchase
intention are still relatively less in Malaysia (Elham Rahbar and Nabsiah Abdul,
2011).
1.2 Problem Statement
This study is about factors that influence consumer purchase intention on
green product. Going green in Malaysia nowadays have expend widely in school,
universities and workplace. Responsibility to reduce pollution problem and to protect
environment are not only for government but also for individuals to mitigate the
pollution problem.
There are some obstacles that are found in terms of the factors that influence
consumer purchase intention to buy the green product. Lack of information and
marketing on green products makes green product less usable and less purchase in
3
Individuals can help by reducing their waste that can contaminate the
environment by recycling, or by consuming the green products which usually more
expensive compare to conventional product.
1.3 Research Objective
The general objectives of this study are outline below:
1. To determine the relationship between consumer perception and purchase
intention on green product.
2. To investigate factors of consumer purchase intention on green products.
3. To identify influence of perception toward purchase intention on green product
1.4 Research Question
This research focus is to identify the factors that influence consumer purchase
intention on green product. The research questions are outlined below:
RQ1: What is relationship between consumer perception and purchase
intention on green products?
RQ2: What are the factors of consumer purchase intention on green product?
RQ3: Does the perception influence consumer to have purchase intention on
4 1.5Scope of Study
This study covers for both male and female consumers that are using the
green product in Melaka Tengah. Melaka have their vision which is “Melaka Maju Negeriku Sayang Negeri Bandar Teknologi Hijau” in 2020. This theme and from this study, can determine how far Melaka residents attention to using the green product in
their daily life.
1.6 Limitation of Research
The limitations of this study are insufficient marketing and understanding
about green product in the market. People do not aware existence of the green
product in the market nowadays.
Target population is another factor that limits this study because the target
population is only at Melaka state. Nevertheless, the willingness of respondent to
answer the questionnaires is also not known.
1.7 Significant of Study
The significant of study was to identify the factors influence customer
perception of green product purchase intention. This information was helpful in
understanding the relationship between consumer perceptions on green product and
how was their purchase intention to buy it. The findings provide the consumers with
information that will make them aware existence of green product in the market. In
addition, the findings also provide organization with information that will make them
recognize the effectiveness of green product as it does not only benefit the consumers
5 1.8 Summary
This summary includes background of study, problem statement, research
questions, research objective, scope of research, limitation of study and significant of
6 CHAPTER 2
LITERATURE REVIEW
2.1 Introduction
This chapter highlights the literature review of the factor influence consumer
perception on green product in terms of green purchase intention. This study also
aimed to understand relationship between consumer perception and purchase
intention which clarifies on how green product can affecting their purchase intention.
This study used various reference materials as guidelines such as journals, books,
thesis and other printed medium. The information from this research can be used to
strengthen the understanding and conceptualized research framework.
2.2 Definition
2.2.1 Green Product
Awareness on the destruction of natural resources resulting from human
activities has raised the issue of environmental protection and environmental
consciousness in consumer behavior. This has increased the demand for green
products in the market worldwide. A green product is defined as “a product that was
manufactured using toxic-free ingredients and environmentally-friendly procedures,
7 Defining a product as “green” is not often straightforward since green building is a
whole-systems approach to designing, constructing, operating and maintaining
buildings, (Shrum, 1995). According to D'Souza, (2007) Green products have to
represent a significant achievement in reducing environmental impact; they may also
have to incorporate strategies of recycling, recycled content, reduced packaging or
using less toxic materials. The rising number of customers demanding
environmentally responsible products and the need to remain competitive has
prompted many marketing managers to seek information concerning environmentally
responsible purchase behavior, (Scott and Jobber, 2000).
2.2.2 Green Consumer
A green consumer is someone who is very concerned about the environment
and therefore, purchases service or products that are environmentally-friendly or
eco-friendly, (Ian, 2002; Geuens, 2005). Another suggests of definition is that green
consumers who will make sure through label information looking for environmental
validation for the product (D'Souza, 2004). In other words, it has been suggested that
these are the consumers who would be encouraged to purchase green goods even if
they were rather low in quality and higher in price in contrast to other products.
2.2.3 Green Purchase Intention
Green purchase intention is define as an intention to buy a products or
services that are not harmful for the society and to the environment. It also can be
defined as willingness or desires to buy products or services that are less harmful and
eco-friendly product. With the developing of technologies nowadays, there is bad
and negative effect to the environment such as air pollution, water pollution and
8
this effect. They have tendency to use such product, which have less harmful and less
dangerous to the environment. The society and public are taking more seriously noticed
about environmental issues creating the more pollution in our environment, arisen from
industrial sector manufacturing activities (Chen, 2011; Rizwan et al., 2013).
The green purchase intention in study was conceptualized as a single
dimension variable and was measured by three items. However, D‟Souza et al.
(2006) have developed a conceptualized model that consisted of seven variables in
their study, which investigated the influences of multiple factors on green products
for green purchase intention among consumers in Australia. The green purchase
intention in the study was conceptualized as two-dimension variables, with price and
quality as the measurement for green purchase intention. Whereas the study by Nik
Abdul et al. (2009) referred green purchase intention as the probability and willingness of a person to give preference to products having eco-friendly features
over other conventional products in their purchase considerations.
Likewise, Chen and Chang (2012) defined green purchase intention as the
likelihood that a consumer would buy a particular product resulting from his or her
environmental needs. Hence, for the purpose of this study, green purchase intention
was conceptualized as a single-dimension variable, which is in line with Nik Abdul
et al. (2009), as they have defined green purchase intention as the probability and willingness of a person to give preference to products with eco-friendly features over
9 2.2.4 Theory of Planned Behavior (TPB)
According to the Theory of Planned Behavior by Ajzen (1991), the
combination of attitudes towards the behavior, subjective norms, and perceived
behavioral control guide the formation of an intention, and thus, intention is assumed
to be the predecessor of the actual behavior as shown in Figure 2.1. Again, a central
factor in the Theory of Planned Behavior is the individuals’ intention to perform a
given behavior. Intentions are assumed to control the motivational factors that
influence behavior. They are indications of how hard people are willing to try, or
how much of an effort they are planning to exert in order to execute the behavior.
Shortly, the stronger the intention to engage in certain behavior, the more
likely an actual behavior would be performed (Ajzen,1991). Roberts and Bacon
(1997) have developed a conceptual model to explore the relationships between
consumers’ environmental concern and ecologically conscious consumer behavior in the USA. Their study conceptualized the consumer behavior variable in
six-dimensional criteria with 30 measuring items. They ranged from the use of recycled
products to consumers green purchase behavior. In a similar study on consumer
behavior, (Chan, 2001) developed a conceptualized model that investigated the
influence of various cultural and psychological factors on green purchase behavior
among Chinese consumers.
10 2.3 Factors Influencing Green Purchase Intention
2.3.1. Green Packaging
Draskovic et al. (2009) proposed that packaging is a communication tool
between businesses and consumers and it is capable of attracting consumers’ attention. Consumers’ overall perception of packaging is a sum of individual
perspective of packaging shape, size, colour, materials, and labelled information.
Hence, to further understand how packaging communicates and affects consumers, it
is important to investigate how consumers perceive packaging. Van Dam and Van
Trijp (1994), in their attempt to unveil consumers’ perceptions and preference for
beverage containers in the Netherlands, define green packaging as to the extent
consumers recognize environmental aspects in their perception of product packaging
and the extent consumers consider environmental aspects in their overall preference
formation.
2.3.2. Eco Label Product
Tang et al. (2004) define eco-label as a mean of information tool that usually utilized logo to convey information to consumers on the environment implications of
buying such product. Additionally, Rex and Baumann (2006) describe eco-label as a
means for consumers to make choices that will reduce environmental impact and
enable them to influence how products are made. Sonderskov and Daugbjerg (2011)
define eco-label as a product claim to furnish consumers with credible and easily
accessible information on the environmental attributes of a product. Also, Sammer
and Wustenhagen (2006) advocate eco-label as an important marketing tool to
overcome market failure due to information asymmetries between sellers and buyers
11
developed a conceptualized model that investigated the effects of label,
eco-brand, and environmental advertising on consumers purchasing behavior in Penang,
Malaysia. They suggested that these three marketing tools are useful in enhancing
consumer’s knowledge about environmental friendly products and their ability to distinguish between green products and conventional products. In the same study,
eco-label was conceptualized as a single dimension variable that consisted of four
items, ranging from consumers recognition of various eco-labels, use of eco-labels,
the comprehension of the meaning of eco-labels, and trust of the eco-label’s
message.
Hence, for the purpose of this study, eco-label was conceptualized as a single
dimension variable based on the study of Elham Rahbar and Nabsiah Abdul (2011).
In addition, a considerable amount of literature has been published on the
relationship between eco-label and green purchase. The results of these studies often
contradict each other. Vlosky et al. (1999) unveiled the relationships between intrinsic environmental motivations like environmental consciousness, the
importance of environmental certification, involvement in certification, and the
willingness to pay a premium for environmentally certified wood products in USA.
The study found that consumers with high involvement or high expectation in
environmental certification had high willingness to pay a premium for
environmentally certified wood products. A study by D’Souza (2000), which
examined the impact of “Dolphin-Safe” eco-label on four brands of consumers‟ canned tuna choice in Australia, reported that consumers were favorably influenced
by the presence of “dolphin-safe” eco-label on their tuna brand preference. Sammer
and Wustenhagen (2006) conducted a choice-based conjoint analysis involving 151
potential washing machine buyers in Switzerland. The study analyzed the relative
importance of EU energy-labelled products compared to other product attributes,
such as brand, water and energy consumption level, energy efficiency rating, and
price factor on consumer buying decision for a washing machine. The research
findings indicated that the energy label positively influenced consumers‟ buying
decisions. Interestingly, the willingness to pay for the costs exceeded the cost savings
12 2.3.3. Green Advertising
According to Davis (1994), corporate environmental advertisement typically
contains three elements. First, the advertisement presents a general statement of
corporate concern for the environment. Second, the advertisement describes how the
corporation has initiated a number of activities to demonstrate its concern and
commitment towards environmental improvement. Third, the advertisement provides
a description of specific environmentally related activities, in which the corporation
is engaged and / or outcomes for which the corporation takes credit. Whereas Chan,
(2004), defines green advertisement as claims that the attributes of the advertised
product or associated production process contributed to environmental protection or
with other positive effects to the environment.
(Chan, 2004) developed a model that consisted of six dimensions in
measuring the Chinese consumers responses to green advertisement which are
attitudes toward the advertisement, attitudes toward the advertised product, intention
to purchase the advertised product, relevance of the advertised product to the
respondents’ daily lives, usefulness of the advertisement in guiding respondents to purchase the product, and perceived credibility of the advertising claim.
The purpose of this study, green advertisement was conceptualized as a
uni-dimension variable based on Chan (2004) study. Accordingly, the definition used in
this study is as an activity to influence consumers’ behaviour by encouraging them to
buy products that are not harmful to the environment and to direct their attention to
the positive consequences of their purchasing behaviour.
Result from a study by Davis, (1994) found that consumers’ reactions to
corporate green advertisements were significantly influenced by consumers’ prior
perception about the corporate environmental concern. If the consumers’
prior-perceptions toward corporate environmental concern had been favourable, then
13
advertisement, including the advertised message, the corporate image, as well as the
products from the corporate.
2.3.4 Green Product Value
Yaacob and Zakaria, (2011) conferred that in general, consumers engage in
green products for the benefits of environmental improvement they live in. In some
cases, direct personal benefits, such as perceived health advantages of organic foods
or the energy saving of an eco-friendly air conditioner, are mostly observed. Chen
and Chang, (2012) inspected the roles of green perceived value, green perceived risk,
and the mediating effect of green trust on the green purchase intention of information
and technology products in Taiwan.
The definition of green perceived value in Chen and Chang, (2012) study
was adopted from Patterson and Spreng, (1997), who documented green perceived
value as consumers overall appraisal of the net benefit of a product or service
between what is received and what is given based on consumers environmental
desires, sustainable expectations, and green needs. Therefore, for the purpose of this
study, the green product value was conceptualized as a single dimension variable
based on the study by Chen and Chang, (2012).
Although the broad literature has acknowledged the significant effects of
green products and their values or benefits on consumers‟ green purchase intention, a few studies have reported contradictory findings. A study by Bhaskaran et al., (2006) indicated that customers do not perceive those products produced under
environmental sustainable standards as offering any distinct benefits to them and
customers distrust the claims made by these organizations. In addition, these
products are more expensive than traditional products and the implementation of
14
Green products have usually been more costly to manufacture than
conventional products, and thus, they are simply more expensive for consumers to
purchase (D‟Souza et al., 2006; Okada and Mais, 2010; Royne et al., 2011; Sonderskov and Daugbjerg, 2011). Hence, Chen and Chang, (2012) suggested that
companies should develop products with both green features and high-value
attributes to attract consumers. They further argued that increasing consumer
perceived value about green products may ease customer skepticism about green
products and enhance consumer purchase intention.
2.5 Willingness to Pay More
Generally, green products will be priced higher than the conventional
products due to the higher cost incurred in the processes, materials and to certain
extend the cost involve in getting a certified eco-label on the products. Price is
always thought as the determinant factor in making purchasing decision. Consumers
were willing to pay for premium price on products that carry certification whilst
paying lesser for a green product that is self-declared by the company (Barnard and
Mitra, 2010).
The perceived relative advantage for example quality and functional
performance of green products over the non-green is likely to influence consumer
acceptance, (Rogers 1983). The relative advantage of green alternatives would have
to be weighed against their prices and this cost-benefit relationship is even more
complicated when the prices of green products reflect other costs in addition to the
money costs. These include opportunity costs, energy costs and psychic costs. If the
major benefits of green products are perceived to be higher than the cost, then
consumers will be motivated to purchase these products even if they are priced
15
In short, the price sensitive green consumers are defined as those customers
that are aware of the risks of the non-green products that will pose to the
environment, but they are inherently price sensitive customers. This group of
consumers tends not willing to pay more for environmentally friendly products
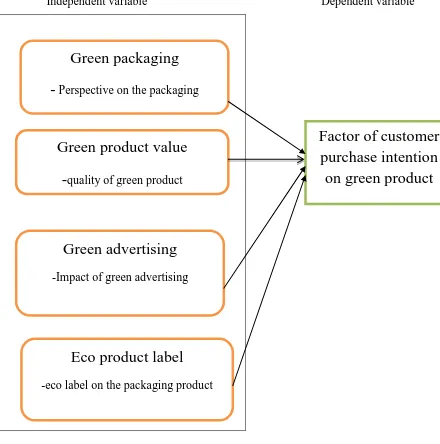
16 2.6 Theoretical Framework
Independent variable Dependent variable
[image:30.595.109.549.135.579.2]
Figure 2.2: Research framework of factor of customer purchase intention on green
product
Green packaging
-
Perspective on the packagingEco product label
-eco label on the packaging productFactor of customer
purchase intention
on green product
Green advertising
-Impact of green advertising17 2.7 Hypothesis of the Study
A study hypothesis is the prediction of the outcome of a study. Below shows
hypothesis of this study:
Hypothesis 1
Ho: Green packaging has no significant relationship with factor of customer purchase
intention on green product.
H1:Green packaging has significant relationship with factor of customer purchase
intention on green product.
Hypothesis 2
Ho Green product value has no significant relationship with factor of
customer purchase intention on green product.
H2: Green product value has significant relationship with factor of
customer purchase intention on green product.
Hypothesis 3
H0: Green advertising has no significant relationship with factor of customer
purchase intention on green product.
H3: Green advertising has significant relationship with factor of customer purchase
18
Hypothesis 4
H0: Eco product label has no significant relationship with factor of customer
purchase intention on green product.
H4: Eco product label has significant relationship with factor of customer purchase
19 CHAPTER 3
RESEARCH METHODOLOGY
This chapter highlights the research method applied in the study. All the data
collected will be documented to ensure that this research is fully explained and valid
on the topic. The duration of this study is important as it guides the researcher to
ensure the research is completed in time without any delay. Besides that, the
geographical area on the location of the study conducted, the study design, strategy
and the population, sample and tool to collect data are described too. This topic also
includes the research includes the research instruments as well as the validity test
results for pilot test.
3.1 Research Design
The research design that will be used for the study is quantitative descriptive
research. It is useful to gain an accurate profile of events, persons or a situation. It is
most important to have clear image of the situation on which we wish to collect data
prior to the collection of data. In other words, with descriptive research design we
could be able to describe some group of people or entities. Besides that, descriptive
research is very common in business and other aspect of life. From this, as a
researcher I will be able to have a clear picture on the topic what factor that influence
20
perception on green product that has a dominant factor of purchase intention. Thus,
research design is used to determine the relationship between variables. In this, the
researcher will be able to examine the relationship between consumer perception on
green product and purchase intention to buy green product either it gives a significant
results.
Introduction
Research Question, Research Objective, Scope, Limitation and Significant of study.
Literature Review
Definition, Theory of Planned Behavior (TPB), Factors Influencing Green Purchase
Intention, Willingness to Pay More, Research Framework, Hypothesis of the Study.
Data collection
Research Method, Primary and Secondary Data
Data Analysis
Data Analysis and Finding
Conclusion
Conclusion, Recommendation and Limitation of study
21 3.2 Research Strategy
The research strategy for this study is a survey strategy where it is usually
associated with a deductive research approach. This survey is conducted in the form
of questionnaire. Researcher distributed questionnaire forms to the customers who go
shopping at supermarket around Melaka city. This strategy allows the collection of
standardized data and easy to do comparison based from the sizeable population.
Besides that, data collected using survey strategy can be used to suggest possible
reasons for a particular relationships between variables and to produce models of
these relationship, (Saunders et al., 2012). By using a survey strategy it would give
the researcher more control over the research process. In this, when sampling is used
the findings are achievable where it represents the whole population at a minimum
cost rather than collecting data for the whole population.
3.3 Data Collection
The method used in this study is a quantitative method where questionnaire
forms will be distributed to the customers. The customers who go shopping at the
supermarket around Melaka city will be the sample of this study The reason why the
researcher chooses the customers who go shopping at the supermarket because they
are suitable to be respondent and the researcher will easily collect data from them.
The questionnaire will be distributed and then fill by them. From the questionnaires,
22 3.3.1 Quantitative Research
Quantitative method is defined as in-depth inquiry into a special problem,
based on testing a theory composed of variables, measured numerically and analysed
with statistical procedure in order to determine whether the predictive generalization
holds true (Saunders et al., 2012). The instrument used for quantitative research is
questionnaire.
The data was collected in two ways which is primary data and secondary
data. This data collected from primary data are those which are collected for the first
time and are always given in the form of raw materials and originals in character. It
is not been previously published. The data is derived from a new research study and
collected at the source. These types of data need the application of statistics method
for the purpose of analysis and interpretation. The secondary data is those data that
collected for this study purpose for example expert knowledge on the issue,
brochures and books related to the topic and information regarding the organization
that gained to conduct the study.
3.4 Analyzing Data
The data collected from the survey will be analysed using Statistical Package
Social Science (SPSS) software version 2.2. The tool plays role as the analytical tool
where later the result will be presented graphical, narrative and tabular data.
Descriptive statistical tool such as bar graph, and pie chart were used. Besides that,
the data will be edited to detect and correct omission and errors, non-responses. It
does also detect the appropriateness and accuracy to ensure that there was
consistency in response. The most important part of using this system is it gives the
validity and reliability results of the project. At last, the results that come out from
SPSS software should answer the research questions to make sure the study project is
23 3.5 Research Population and Sample
‘Population’ does not refer to the population of a country, but rather to the objects, subjects, phenomena, cases, events or activities for the purpose of sampling,
( Brynard & Hanekom, 2005). Besides that, according to Marion, (2004) population
is any set of people or events from which the sample is selected and the study of
results will generalize.
According to Marion (2004) sample is a group of people or events drawn
from a population and a research study carried out on a sample from a population.
Sampling and sample size are crucial issues in pieces of quantitative research, which
seek to make statistically based generalizations from the study results to the wider
world (Fox, Hunn et al., 2009). Besides that, Kumar (2006) motivates that purposive
sampling is extremely useful when constructing a historical reality, describing
phenomenon or developing something about which only little known.
In this study, once obtained the population of citizens at Melaka Tengah, the
next step is to determine the sample of study. Therefore, to determine the sample for
this study, researcher will be referring the Krejcie & Morgan research method table
24
25 3.6 Questionnaire Construction
Questionnaire provided an effective and yet efficient way of collecting data
from a large sample respondent through quantitative research. The channel that used
in distributing the questionnaire in the research is y manually handed it to the
participant who is qualified and volunteer to fill the questionnaire. Respondent were
customer who go shopping at supermarket. Questionnaire consisted scale questions
to collect opinion from the targeted respondent to fulfil the research objective. The
questionnaire had been designed using 5 point rating scale from 0 to 5.
3.7 Research Instrument
Research instrument is a survey, questionnaire or tools that designed to
measure the variables of the research. According to Saunders, questionnaire is used
for descriptive or explanatory studies and will be able to study the variability of
different phenomena. In this study, questionnaires are distributed manually by hand
to the respondent at supermarket around Melaka city.
The first part of the questionnaire is Section A which is the respondent
characteristic that include gender, age, marital status, working experiences and
education. The second part is Section B that includes the independent variables
which are green packaging, price promotion of green product, green advertising, and
green product value. The last part of the questionnaire is the dependent variables
which is the factor of consumer purchase intention on green product. The section B
and C are rated using Likert-scale rating point which is from 1 to 5 (1= strongly
26 3.8 Data Analysis
Data analysis is method of analysing data to answer research questions. It is
also an approach of separating of data, informational and/or factual elements. The
measurement process will produce result that will lead to data analysis. According to
Trochim (2006), descriptive analysis is similar to the descriptive statistics and can be
define as describe the basic of the data in a study by showing the graph analysis to
prove the study.
Research Objectives Data Analysis
To determine the relationship between
consumer purchase intention and green
product
Multiple Regression
Analysis
To investigate factors of consumer purchase
intention on green products
Descriptive Analysis
To identify influence factors of consumer
purchase intention on green product
Descriptive Analysis
Table 3.2: Research Objective and Data Analysis used
3.8.1 Descriptive Analysis
In this is used to describe the collected data into numeral values. So, this
research will use descriptive testing to analyse the entire question given to the
respondents. Hence, by using Statistical Package for the Social Science (SPSS), it
can solve the descriptive testing and will produce sets of data called the scores of
27 3.8.2 Regression Analysis
Regression analysis is used to test the relationship between more than one
independent variable and a single dependent variable, given the condition that both
variables must be metric and it is also known as statistical technique, Hair et al.
(2006). Hence, it is applied to this research to examine the matric data of knowledge
and skill, personality traits, product development, packaging and promotion, building
competitive advantage in the market, selecting suitable business partner, facilities
and support (independent variables) and business success in performance (one
dependent variable) respectively.
To prove the relationship between all the independent variables and
dependent variables in further, the multiple regression analysis will be carried out in
order to show the most significant independent variables between all elements
28 3.9 Research Liability and Validity
3.9.1 Reliability
The use of questionnaires as research instrument which measures what this
research seeks to achieve. Through the findings in the questionnaire we will be able
to get the reliable answer on how far customer perception relate with purchase
intention on green product In this, the questionnaires will be distributed to every
individual in the sample size making the research finding very reliable since they
produced consistent results. The reliability will be tested on the variables of the study
that will later come out as the results. Besides that, it also to test the relation of topic
on how far work life balance related with employees satisfaction.
3.9.2 Validity
Validity of the study refers to the accuracy of the inferences, interpretations
or actions made on the basis of quantitative data. Validity is the extent to which an
instrument measures what is supposed to measure and performs as it is designed to
perform. In the validity context, there are three types of validity. There are internal
validity, external validity and construct validity.
Internal validity is established when study demonstrates a causal relationship
between two variables with specific involved experimental in statistically could
produce an outcome or results. To achieve elements of internal validity, research
could clearly design and construct a questionnaire wisely in arrange of study iron
triangle. Besides that, external factors not recommend to avoid because each of the
29
External validity is the allowance for making generalizations for other
circumstances or groups based on one study that included only a portion of the
relevant population. According to Saunders et al., (2012) stated that external validity
bringing meanings of findings research study possible to be generalized in another
form across several of industry, technique, settings, and times. In this study, the
researcher ability to achieve through the information got.
Refer to Saunders et al., (2012) construct validity mentioned that in particular
of a research measure part in term of actual measure like others to assess. Besides
that, it also highly point up researcher should not ignore or careless of research
objectives by only focusing answering their research question. The variety of sources
for study can enhance and improve the widely of useful information such as books,
journal, article and so on. With all this additional information, the construct validity
will be more precise.
Reliability refers to a particular or specific research proposal either will precise
and consistency result if those researches have been done by others researcher before
this. Besides that, reliability considers achieved if the findings or the result is precise
and differences if that particular research proposal repeated by others researcher.
Reliability is one of the important terms to identify the value of study.
As a process, validation involves collecting and analysing data to assess the
accuracy of an instrument. To assess the validity of quantitative instruments it
normally involves pilot testing. To achieve the validity of the data, the researcher
will be directly distributing the questionnaire to the respondent instead of using
online tool. This is in order to get the direct feedback from several respondents
regarding the topic.
30 CHAPTER 4
DATA ANALYSIS
4.0 Introduction
This chapter, the result of data analysis is presented. The purpose is to prove
how successful the research objectives were achieved. It shows the analysis of result
and discussion on the relation of factor influencing consumer perception and
purchase intention on green product. The research was conducted at Melaka Tengah
among the citizens. For this research, 384 handouts of questionnaire were collected
back as per sample in Krejcie and Morgan table. The questionnaire consists of three
parts which are Section A that includes the respondent characteristic such as gender,
age, race, purchasing on green product and type of green product they buy. Section B
consists of the independent variables of the research that includes Green Packaging
on product, Green Product Value, Green Advertisement and Eco-label product.
Therefore, Section C consists of the dependent variable which is the green purchase
intention. The data collected will be analysed using Statistical Package for the Social
Science (SPSS) software. The analysis will be started from the pilot test, descriptive
31 4.1 Pilot Test
4.1.1 Reliability Testing
In this study, Cronbach’s Alpha is used to determine the internal consistency
or average correlation of items for each of independent variables
Table 4.1: Reliability Statistics
Table 4.1 shows the value of Cronbach’s Alpha is 0.895 which is more than
0.50. Hence, the reliability analysis for the all items is acceptable.
Variables Cronbach’s Alpha N of Question
Green Packaging 0.758 5
Green Product Value 0.874 5
32
Eco-label 0.696 4
Green Purchase Intention 0.663 5
Table 4.2: Cronbach’s Alpha for Pilot Test
From the reliability test shown in Table 4.2 above, there are four variables
involved in the survey questions. There is Green Packaging on product, Green
Product Value, Green Advertisement and Eco-label product as stated in theoretical
framework in Chapter 3. Five (5) questions were included in Green Packaging, based
on Cronbach’s Alpha calculated for each question the value is 0.758. In addition, there are also five (5) questions in Green Product value with 0.878 Cronbach’s
Alpha.
Next, in Green Advertisement there are four (4) questions in this item. It
shows that the value from Cronbach’s Alpha for each question is 0.696. Lastly, there are five (5) questions in Green Purchase Intention with 0.663 Cronbach’s Alpha.
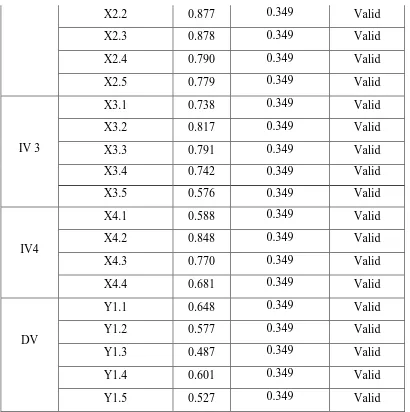
4.1.2 Validity Analysis of Each Question
In this research, the researcher has done pilot test by distributing the
questionnaire to 30 respondents. Therefore, if the probability is very low (usually
less than 0.05) then it is considered statistically significant and if the probability is
greater than 0.05 then the relationship is not statistically significant.
No. of question Value Critical Value Validity
IV 1
X1.1 0.708 0.349 Valid
X1.2 0.719 0.349 Valid
X1.3 0.550 0.349 Valid
X1.4 0.868 0.349 Valid
X1.5 0.701 0.349 Valid
33
X2.2 0.877 0.349 Valid
X2.3 0.878 0.349 Valid
X2.4 0.790 0.349 Valid
X2.5 0.779 0.349 Valid
IV 3
X3.1 0.738 0.349 Valid
X3.2 0.817 0.349 Valid
X3.3 0.791 0.349 Valid
X3.4 0.742 0.349 Valid
X3.5 0.576 0.349 Valid
IV4
X4.1 0.588 0.349 Valid
X4.2 0.848 0.349 Valid
X4.3 0.770 0.349 Valid
X4.4 0.681 0.349 Valid
DV
Y1.1 0.648 0.349 Valid
Y1.2 0.577 0.349 Valid
Y1.3 0.487 0.349 Valid
Y1.4 0.601 0.349 Valid
[image:47.595.116.526.82.494.2]Y1.5 0.527 0.349 Valid
Table 4.3: Validity for 30 respondents for pilot test
Table 4.3 shows that all items are valid based on Pearson Product Moment
Correlation Coefficient table because the value is more than the critical value for
N=30 which indicate N= Number of respondent is 0.349. N means the quality of indicator for this research questionnaire which is 30 respondents. The values were
compared based on the Pearson Product Moment Table. Thus, all items can be
34
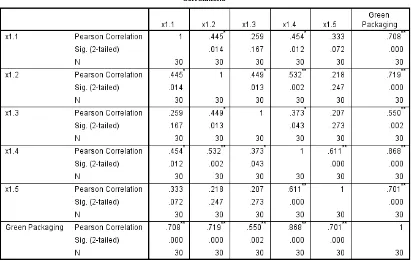
Table 4.4: Correlation table of regulation response for 30 respondents
Table 4.4 shows the questions x1.1, x1.2, x1.3, x1.4 and x1.5 are very strong
positive between the questions for the green packaging toward the green purchase
35
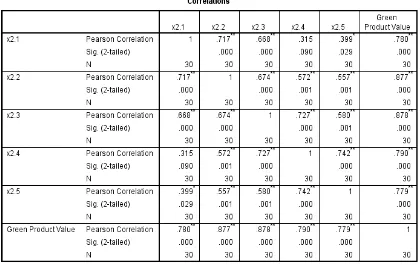
Table 4.5: Correlation table of Customer preference for 30 respondents
Table 4.5 shows the question x2.1, x2.2, x2.3, x2.4 and x2.5 are very strong
positive between the questions for the green product value toward the green purchase
36
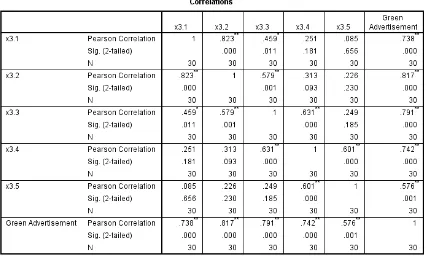
Table 4.6: Correlation table of Customer preference for 30 respondents
Table 4.6 shows the question x3.1, x3.2, x3.3, x3.4 and x3.5 are very strong
positive between the questions for the green advertisement toward the green purchase
37
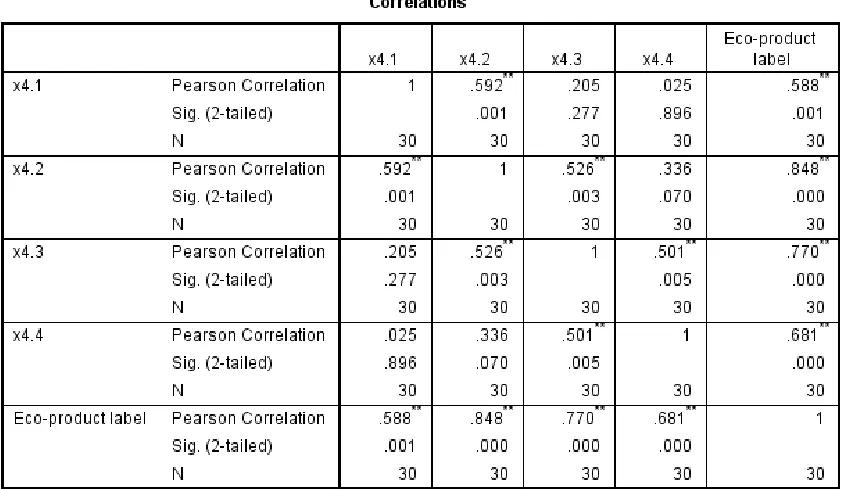
Table 4.7: Correlation table of Customer preference for 30 respondents
Table 4.7 shows the question x4.1, x4.2, x4.3 and x4.4 are very strong
positive between the questions for the eco-product label toward the green purchase
38
Table 4.8: Correlation table of Customer preference for 30 respondents
Table 4.8 shows the question y1.1, y1.2, y1.3, y1.4 and y1.5 are very strong
positive between the questions for the green purchase intention. The values are
39 4.2 Descriptive Statistic
4.2.1 Section A: Respondents Demographic Profile
For this section of descriptive analysis called demographic analysis,
frequency analysis is applied to the raw data to testing the demographic information
of respondents. The samples of 384 respondents are measured demographically in
terms of gender, age, race, and types of green product purchase.
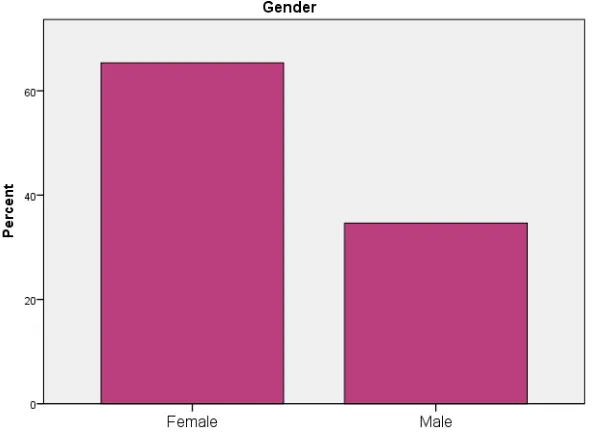
4.2.2 Respondent’s Gender
Gender
Frequency Percent Valid Percent Cumulative Percent
Valid
Female 251 65.4 65.4 65.4 Male 133 34.6 34.6 100.0 Total 384 100.0 100.0
[image:53.595.174.471.507.724.2]Source: SPSS output
Table 4.9: Frequencies Distribution of Respondent’s Gender
40
The table 4.9 shows the respondents of this research by gender. The highest
number of respondent contributed to this research is female with total frequency of
251 or 65.4%. Therefore the male respondent only represents with the total
frequency of 133 or 34.6%.
4.2.3 Respondent’s Age
Age
Frequency Percent Valid Percent Cumulative Percent
Valid
20-25 147 38.3 38.3 38.3 26-30 114 29.7 29.7 68.0 31-35 67 17.4 17.4 85.4 36-40 29 7.6 7.6 93.0 41-45 9 2.3 2.3 95.3 45 and above 18 4.7 4.7 100.0 Total 384 100.0 100.0
Source: SPSS output
41
Figure 4.2: Frequencies Distribution of Respondent’s Age
The table 4.10 shows the respondents of this research by their age. The
highest frequency of respondent is with the age range 20 – 25 years old which is 147
with the total percentage of 38.3%. Hence, the respondent with age range 41-45
[image:55.595.125.550.101.414.2]42
4.2.4 Respondent’s Race
Race
Frequency Percent Valid Percent Cumulative Percent
Valid
Chinese 79 20.6 20.6 20.6 Indian 29 7.6 7.6 28.1 Malay 276 71.9 71.9 100.0 Total 384 100.0 100.0
Source: SPSS output
Table 4.11: Frequencies Distribution of Respondent’s Race
Figure 4.3: Frequencies Distribution of Respondent’s Race
The table 4.11 shows the respondents of this research by their race. The
highest frequency of respondent is Malay which is 276 with the total percentage of
71.9%. Hence, the respondent carries the least frequency which is Indian with 29,
[image:56.595.177.370.352.591.2]43
4.2.5 Respondent’s Green Product Purchase
Green Product Purchase
Frequency Percent Valid Percent Cumulative Percent
Valid
No 18 4.7 4.7 4.7 Yes 366 95.3 95.3 100.0 Total 384 100.0 100.0
Sources: SPSS Output
Table 4.12: Frequencies Distribution of Respondent’s Green Product Purchase
Figure 4.4: Respondent’s by Green Product Purchase
Table 4.12 shows the respondents of this research by their green product
purchase. The frequency of respondents purchase the green product is high which
366 with total percentage of 95.3% are. Hence, total respondent who are not
[image:57.595.143.502.310.609.2]44 4.2.6 Types Of Green Product Purchase by Respondent’s
Type of Green Product Purchase
Frequency Percent Valid Percent Cumulative Percent
Valid
Bag 219 57.0 57.0 57.0 Cleaning product 52 13.5 13.5 70.6 Home ware 74 19.3 19.3 89.8 no choices 18 4.7 4.7 94.5 Others please specify. 21 5.5 5.5 100.0 Total 384 100.0 100.0
[image:58.595.148.495.343.595.2]Source: SPSS output
Table 4.13: Respondents by Type of Green Product Purchase
Figure 4.5: Respondents by Type of Green Product Purchase
The table 4.13 shows the respondents of this research by their type of green
product purchase. The highest frequency of respondent purchase green product is bag
which is 219 with the total percentage of 57%. Hence, the respondent carries the
least frequency purchase green product is others with 21, with the total percentage of
45 4.3 Analysis Result Questionnaire
4.3.1 Green Packaging
Items S tr on gly Disagr ee (%) Disagr ee (%) Ne u tr al (%) Agr ee (%) S tr on gly Agr ee (%)
I concern about
green packaging
on product
- 6.8 34.6 43.2 15.4
I purchase product that made of recycled / recyclable material
- 7.8 31.0 50.8 10.4
I purchase
product that
clearly written
“green packaging”.
- - 17.2 79.9 2.9
I regularly
recycle product
packaging.
2.6 17.2 43.0 22.1 15.1
I regularly reuse
product
packaging.
- 9.9 31.5 44.0 14.6
46 4.3.2 Green Product Value
Items S tr on gly Disagr ee (%) Disagr ee (%) Ne u tr al (%) Agr ee (%) S tr on gly Agr ee (%) This green product performance meets my expectations
14.1 2.6 18.0 51.8 13.5
This green
product functions
provide very good
value for me.
- 16.9 12.2 46.6 24.2
I purchase green
product because it
has more
environmental
benefits than
other products.
- 14.1 4.9 53.6 27.3
I purchase green
product because it
has more
environmental
concerns than
other products.
- 14.1 4.9 50.8 30.2
I purchase this
product because it
is
environmentally
friendly
- 14.1 4.2 49.2 32.6
47 4.3.3 Green Advertisement
Items S tr on gly Disagr ee (%) Disagr ee (%) Ne u tr al (%) Agr ee (%) S tr on gly Agr ee (%)
I perceive green
advertising
supplies relevant
information about
green product
16.7 8.3 5.7 52.3 16.9
I perceive green
advertising is a
good source to
purchase green
product
2.6 17.2 4.4 63.5 12.2
I prefer purchasing
product that have
environmental
messages in the
advertisement.
14.1 - 25.5 33.6 26.8
I purchase product
based on promises
in green
advertisement
- 17.2 21.4 48.2 13.3
I refer to green
advertisement
before purchase
green product.
- 17.2 23.7 34.6 24.5
48 4.3.4 Eco-product Label
Items S tr on gly Disagr ee (%) Disagr ee (%) Ne u tr al (%) Agr ee (%) S tr on gly Agr ee (%)
I consider
eco-product label
are always
trustworthy.
- 14.1 10.7 52.6 22.7
I consider what
is printed on
eco-product
label to be
accurate
- 2.6 27.1 44.8 25.5
The information
on eco-product
label is usually
easy to
understand
- 15.9 7.8 63.8 12.5
I purchase
product that
have
eco-product label
first compare to
non-eco-product
label
- 5.2 46.9 33.9 14.1
49 4.3.5 Green Purchase Intention
Items S tr on gly Disagr ee (%) Disagr ee (%) Ne u tr al (%) Agr ee (%) S tr on gly Agr ee (%)
I plan to switch to
a green version of
a product
- - 20.8 55.2 24.0
I consider
switching to other
brands for
ecological reasons
- 16.7 15.4 38.0 29.9
I consider buying
green products
because they
contribute to less
pollution
- 14.1 1.3 46.4 38.3
I aware of any
product which are
designed with
environmental
issue in my mind
- 14.1 5.2 57.0 23.7
I would buy green
products that are
not harmful to the
environment
- 14.1 5.2 37.2 43.5
50 4.4 Result of Measurement
The significant part in this section is to observe the relationship between the
dependent variable and independent variables in this research. All the variables that
are used in this research were tested through validity and reliability.
4.4.1 Test Validity
Validity test is the degree to which it measures what it is supposed to measure
(Saunders et al, 2012). Moreover, validity also helps to evaluate the accuracy of all
questions in the questionnaire that was agreed by the respondents. Other than that,
validity test also helps to identify the significant level of an independent variable
among dependent variable. When test scores are used or interpreted in more than one
way, each intended interpretation must be validated (Goodwin and L. Leech, 2003).
4.4.2 Validity test for 384 respondents
No. of question Value Critical Value Validity
IV 1
X1.1 0.756 0.113 valid
X1.2 0.732 0.113 valid
X1.3 0.551 0.113 Valid
X1.4 0.891 0.113 Valid
X1.5 0.679 0.113 Valid
IV 2
X2.1 0.945 0.113 Valid
X2.2 0.906 0.113 Valid
X2.3 0.976 0.113 Valid
X2.4 0.944 0.113 Valid
X2.5 0.942 0.113 Valid
51
X3.2 0.907 0.113 Valid
X3.3 0.929 0.113 Valid
X3.4 0.880 0.113 Valid
X3.5 0.803 0.113 Valid
IV4
X4.1 0.837 0.113 Valid
X4.2 0.855 0.113 Valid
X4.3 0.911 0.113 Valid
X4.4 0.621 0.113 Valid
DV
Y1.1 0.798 0.113 Valid
Y1.2 0.834 0.113 Valid
Y1.3 0.886 0.113 Valid
Y1.4 0.905 0.113 Valid
[image:65.595.118.523.83.385.2]Y1.5 0.873 0.113 Valid
Table 4.19: Validity test for 384 respondents
The researcher analysed the validity of the questionnaires that was answered
by 384 respondents after distribution and collected the data as indicated in Table
4.19. Using Pearson Product Moment Correlation table the researcher analysed the
critical value for 384 respondents to check the validity of the questionnaires. It was
found that the critical value for 384 respondents is 0.113. This indicates that all the
52
Table 4.20: The result of correlation analysis for all variables
Correlation Coefficient Interpretation
-0.90 to -0.99 Very high negative correlation
-0.70 to -0.89 High negative correlation
-0.40 to -0.69 Medium negative correlation
0.00 to -0.39 Low negative correlation
0.00 to 0.39 Low positive correlation
0.40 to 0.69 Medium positive correlation
0.70 to 0.89 High positive correlation
0.90 to 0.99 Very high positive correlation
[image:66.595.129.531.385.668.2]53
Table 4.20 above shows the correlation between all