This is a repository copy of Energy efficient separation of magnetic alloy from the carbothermic reduction of NKANA Cu-Co concentrates.
White Rose Research Online URL for this paper: http://eprints.whiterose.ac.uk/141156/
Version: Accepted Version
Proceedings Paper:
Hara, YRS and Jha, A orcid.org/0000-0003-3150-5645 (2015) Energy efficient separation of magnetic alloy from the carbothermic reduction of NKANA Cu-Co concentrates. In: Jha, A, Wang, C, Neelameggham, NR, Guillen, DP, Li, L, Belt, CK, Kirchain, R, Spangenburger, JS, Johnson, F, Gomes, AJ, Pandey, A and Hosemann, P, (eds.) Energy Technology 2015: Carbon Dioxide Management and Other Technologies. TMS 2015 144th Annual Meeting & Exhibition, 15-19 Mar 2015, Orlando, Fla., U.S.A.. Springer , pp. 83-92. ISBN
978-3-319-48602-4
https://doi.org/10.1007/978-3-319-48220-0_10
(c) 2015, TMS (The Minerals, Metals & Materials Society). This is an author produced version of a paper published in Energy Technology 2015: Carbon Dioxide Management and Other Technologies. Uploaded in accordance with the publisher's self-archiving policy.
eprints@whiterose.ac.uk https://eprints.whiterose.ac.uk/ Reuse
Items deposited in White Rose Research Online are protected by copyright, with all rights reserved unless indicated otherwise. They may be downloaded and/or printed for private study, or other acts as permitted by national copyright laws. The publisher or other rights holders may allow further reproduction and re-use of the full text version. This is indicated by the licence information on the White Rose Research Online record for the item.
Takedown
If you consider content in White Rose Research Online to be in breach of UK law, please notify us by
1
Thermodynamic and kinetic analysis of low temperature (
T ≤ 1323 K)
recovery
of Cu, Co and Fe from SiO
2CaO (Al, Fe)
2O
3Slag
Yotamu R.S. Hara and Animesh Jha
The Institute for Materials Research, Houldsworth Building
Clarendon Road, Leeds University, Leeds, LS2 9JT (UK), England
Abstract
The investigation focuses on direct reduction and sulphidization of Cu-Co slag via equations; MO
+ C = M + CO(g) and MO + CaSO4 + 4C = MS + CaO + 4CO, respectively, where M represents metallic Cu, Co and Fe, over a temperature range of 1173 K – 1323 K. The expriments were carried
out in the thermogravimetric analysis (TGA) equipment and the reacted samples were characterized
by X-ray diffraction (XRD) and scanning electron microscopy (SEM) techniques. The direct
reduction was sensitive to the reaction temperature and type of carbon and, the highest reduction
was about 90 % at 1323 K, with activated charcoal. The reaction kinetics for the direct reduction
of slag was analysed; the experimental data fitted into the mixed reaction model and the activation
energy was 160 kJ – 290 kJ. The metal oxides in slag were transformed to metal sulphides (CuFeS2, FeS, CoxFe1-XS, Cu5FeS4 etc) when slag was sulphidized in the presence of CaSO4 and graphite. The effect of reaction temperature and molar ratio of graphite was studied and high sulphidization
was obtained at T ≥ 1273 K and molar ratio of MO:CaSO4:C = 1:1.3:1.5. The overall sulphidization
of slag was limited by the CO2– C reaction at T < 1273 K with activation energy of 311 ± 6 kJ. The sulphidized slag was reduced in the presence of CaO and C via MS + CaO + C = M + CaS +
CO(g) reaction and, metallization was completed within 1.5 hours at 1173 K. The metallic/alloy
particles produced via sulphidization – carbothermic reduction route were larger than those
produced via direct reduction.
Key words: matte, metal sulphides, slag, reaction kinetics, Co alloy, carbothermic reduction
2
Copper and cobalt are the two main valuable components in the conventional copper smelting
slag [1-3]. These metals enter the slag phase via: (i) oxidation [2] and (ii) entrapment of
metallic (Cu and Co) and metal sulphides (Cu2S, Cu5FeS4 and CoS) [2]. By comparison, a
majority of Co and Cu in slag are in the form of oxide and sulphide state, respectively [1].
Mineralogical studies have showed that the metal oxides (Cu2O, CuO and CoO) are mainly
dissolved in fayalite (Fe2SiO4), magnetite (Fe3O4) and glassy phases [1, 4]. The copper
smelting slag dump may contain up to 2 wt. % Cu [4] and 0.8 wt.% Co [1]. According to
London Metal Exchange, the current price (November, 2014) of copper and cobalt per tonne of
metal is about $7000 and $31500, respectively. Comparing the composition of Cu and Co in slag
and in mineral concentrates, the slag becomes an important source of these metals.
1.1 Hydrometallurgical recovery of Cu and Co from slag
Leaching – electro-winning is the common method by which Cu and Co are recovered from
the oxide minerals [2]. However, the oxides of Cu and Co in slag are dissolved in silicate and
ferrite phases and, leaching of these phases yields silica gel and increased concentration of iron
in leach solution, respectively. The formation of silica gel makes filtration extremely difficult.
Overcoming these two problems remains a challenging in the hydrometallurgical recovery of
Cu and Co from slag, which would otherwise be the easiest route.
1.2 Pyro – hydro metallurgical processing of slag
In pyro – hydro metallurgical process, Cu-Co slag is roasted with pyrite (FeS2) [5, 6], sulphuric
acid (H2SO4) [3], ferric sulphate (Fe2(SO4)2) [7] or ammonium sulphate ((NH4)2SO4) [8] to yield Cu
and Co sulphates. The roasted slag is leached in water or acid to selectively dissolve Cu and
Co sulphates. The leach solution is purified to remove impurities and, Cu and Co are recovered
from the leach solution via electro-winning process. However, the recovery of Co is low via
this method [6, 7].
1.3 Pyrometallurgical processing of slag
3
In carbothermic reduction, the metal oxides are reduced by carbon according to equation 1 [9].
However, the metal sulphides (Cu2S, Cu5FeS4, CuFeS2) [2] in the slag cannot be reduced by
carbon. The carbothermic reduction may be good for: (i) recovering Co from slag as it is mainly
in the oxide form and, (ii) production of Cu-Co rich matte (Co∙Cu∙Cu2S∙Cu5FeS4).
) (g CO M C
MO 1
Where MO and M represents metal oxide and metallic phase, respectively.
Nearly all Fe is reduced and, a molten Fe rich Cu-Co-Fe alloy and slag are produced at high
temperature (> 1823 K) [1, 10-14]. The Fe rich Cu-Co-Fe alloy is atomized, leached in
autoclave and, Cu and Co are recovered from the solution via electro-winning.
1.3.2 Sulphidization of slag
Sulphidization is the conversion of metal oxides (Cu2O, CoO, FeO etc.) or metallic (Co, Co
and Fe) into metal sulphides (Cu2S, CoS, FeS etc.). The main advantage of this process is that
metallic, metal oxides and metal sulphides are recovered as metal sulphides or matte phase.
Sulphidization of slag in the presence of CaSO4 and C may involve the following steps: (i)
reduction calcination of CaSO4 gas (equation 2) and, (ii) reaction between SO2 gas and metal
oxide (MO) (equation 3). The summation of equations 2 and 3 gives equation 4. The use of
very reactive carbon or higher molar ratio of C may decrease sulphidization due to formation
of CaS via reaction 5 [15].
) ( 5 . 0 5
.
0 2 2
4 C CaO SO CO g
CaSO 2
) ( 5 . 1 5
. 1 )
( 2
2 g C MS CO g
SO
MO 3
) ( 2
2 2
4 C MS CaO CO g
CaSO
MO 4
) ( 2
2 2
4 C CaS CO g
CaSO 5
4
i. CaSO4 is readily available as it is a waste product from the thermal power plants [16]
and from Cu-Co leach plant [3].
ii. Sulphidization may be achieved with minimal or no generation of SO2 gas, unlike in
the presence of pyrite (FeS2) where part of S2/SO2 gases escape, owing to the rapid
decomposition of FeS2 above 1016 K.
iii. Calcium silicate rich slag may be produced which may be used for construction and
glass making.
The sulphidization of Cu-Co slag in the presence of CaSO4, has been studied by Matusewicz
and Mounsey [5] and it was reported that CaSO4 is inappropriate for facilitating matte
production [5]. However, no details were given out as regards to reaction temperature, type of
carbon and stoichiometric ratios of CaSO4 and carbon.
The Cu-Co-Fe-Ca-Si-O-S predominance area diagram at 1273 K is shown in figure 1 from
which it can be observed that complete sulphidization is possible as metal sulphides (CuFeS2,
Cu5FeS4, Co9S8, FeS) co-exist with CaSiO3 and SiO2 at log10(P(O2)) < -10. It can further be
observed in figure 1 that metal oxides (CoFe2O4 and Cu2O) co-exist with CaSO4, CaSiO3 and
SiO2 at log10(P(O2)) > -6.4 which means that sulphidization may not be achieved at high partial
pressure of O2 gas. It is evident from the thermodynamic prediction in figure 1 that
Cu2S/Cu5FeS4 or Cu2S + Co9S8 may be formed preferentially by controlling the partial pressure
5
Figure 1 – Computed Ca-Si-O-S predominance area diagram at 1273 K,
Fe-Co-Fe-O-S (continuous line) and Ca-Si-Fe-Co-Fe-O-S (dotted line), using FactSage software [17]
As shown from the thermodynamic prediction in figure 1, Cu, Co and Fe sulphides (matte)
may be produced via sulphidization of the slag at 1273 K. The sulphidized slag may be treated
through a number of processes to recover Cu and Co:
i. Carbothermic reduction of sulphidized slag in the presence of CaO (equation 6) and
magnetic separation may yield metallic (Cu, Co and Fe) and non-magnetic fraction
containing CaS and CaSiO3. CaS may be oxidised to CaSO4 (equation 7) and recycled
into the process.
) (g CO CaS M C CaO
MS 6
4
2( )
2O g CaSO
CaS 7
ii. Holding the sulphidized slag at about 1523 K in order to allow matte / slag phase
6
iii. Froth flotation of the metal sulphides [2].
2.0Experimental
2.1 Materials
The Cu-Co slag was synthesized in the laboratory by melting the mixture of metal oxides (CuO,
CoO, Fe2O3), Al2O3, CaO and SiO2 according to table 1. The composition in table 1 is typical
of Nkana copper smelting slag [18] except that CuO and CoO were added in higher quantities
for easy analysis and understanding of metal recovery. For synthesis, the sample was melted
in air, for 2 hours at 1523 K. The sample was taken out of the furnace when it had cooled down
to 1323 K. The cooled slag sample was crushed and ground to –200 µm particle size.
Table 1 – Composition of the synthetic slag in wt.%
Constituent SiO2 CaO Fe2O3 Al2O3 CoO CuO
Weight (%) 40 10 30 6 7 7
Carbon black was supplied by Evonik Company (Germany) and activated charcoal was
purchased from ACROS, both had particle size of less than 50 µm. Anhydrous calcium sulphate
(CaSO4) and calcium oxide (CaO) with purities of > 99 % were purchased from Alfar Aesar
(UK).
2.2 Reduction and sulphidization experiments
Carbothermic reduction– 1.4 g of slag was mixed thoroughly with carbon (carbon black and
activated charcoal) at three times the stoichiometric ratio (MO:C = 1:3).
Sulphidization of slag– 1.2 g of slag was mixed with CaSO4 and C (graphite) by following the
stoichiometric conditions in equation 4.
The carbothermic reduction and sulphidization experiments were carried out
isothermally, in the thermogravimetric analysis (TGA) equipment, in order to study the weight
7
our previous studies [19, 20]. The reaction chamber was purged with argon gas at a flow rate
of 0.6 litre min-1, for maintaining inert atmosphere [19]. The weight loss of the sample was
recorded at an interval of 10 seconds, throughout the experiments. The % reduction or the %
CO gas given out at any time for the carbothermic reduction of slag was calculated from
equation 8.
% 100 exp
%
CO T
time any at loss weight erimental
time any at reduction
Wt
8
Where TwtCO is the theoretical weight loss of CO gas from equation 1
The % conversion or % sulphidization of slag in the presence of CaSO4 and graphite was
calculated according to equation 9.
% 100 exp
%
2
CO T
time any at loss weight erimental
time any at conversion
wt
9
Where TwtCO2 is the theoretical weight loss of CO2 gas from equation 4
2.3 Characterisation of the samples
The samples were characterised by X-ray diffraction (XRD) and scanning electron microscopy
(SEM) techniques.
X-ray powder diffraction analysis: A representative portion of the sample was ground, packed
into the sample holder and analysed by the Philips X’pert machine with a copper K radiation
( = 1.5417 Å). The machine was operated at 40 kV, 30 mA and step size of 2 = 0.03315 º.
The phases in the powder diffraction patterns were analysed by the X’pert high score plus
software which is supported by the JCPDS PDF-4+ data base (RDB 2013) [20].
Scanning electron microscopy (SEM): The sample was mounted in a mixture of 3 parts epoxy
hardener and 1 part epoxy hardener and, cured for 8 hours. After the resin had set, the samples
were released from the moulds and gently ground on different grades of silicon carbide paper.
The samples were placed inside the Agar high resolution sputter coater and coated with a 6 nm
8
examined for structural and chemical changes over a large area in order to understand the
distribution of the phases.
3.0 Results and discussion
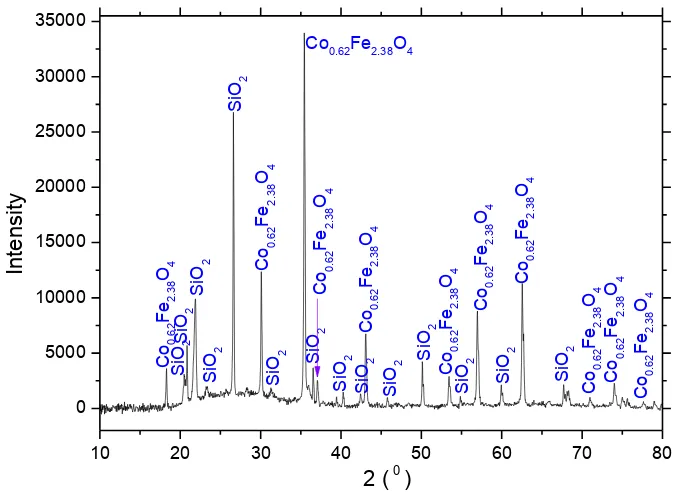
Synthetic slag was analysed by X-ray powder diffraction (XRD) and scanning electron
microscopy (SEM) techniques and the results are presented in figures 2 and 3, respectively. It
is evident from the XRD pattern in figure 2 that Co0.62Fe2.38O4 and SiO2 are the only crystalline
phases. Ca and Al are in the amorphous glassy phase [21] and the presence of amorphous phase
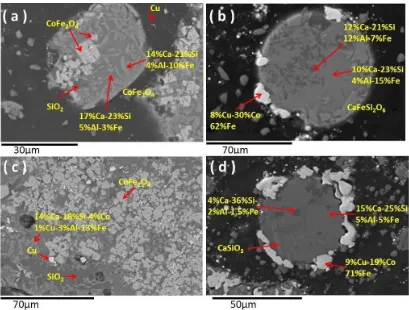
is evident as there is a broad peak for 2 between 20º and 34º [22]. The SEM images in figures
3a and 3b confirms that there is an amorphous and two crystalline phases. SEM-EDX
semi-quantitative composition of the phases in figures 3a and 3b are presented in table 2 from which
it can be observed that the Co0.68Fe2.38O4 crystals contains up to 7 wt. % Cu. The Co0.62Fe2.38O4
phase occurs as smaller euhedral to subheudral crystals and this texture suggests that this phase
crystallised earlier during slow cooling of the melt [21, 23, 24]. The glassy phase should
contain mainly Si, Ca and Al [21] but it has all elements Si, Ca, Cu, Fe, Al and Co in the
[image:9.595.129.467.468.717.2]decreasing order since it hosts the elements that fail to enter or form crystalline phases [21, 24].
Figure 2 – XRD pattern for the slag, synthesised in air for 2 hours at 1523 K
10 20 30 40 50 60 70 80
0 5000 10000 15000 20000 25000 30000 35000 C
o0.6
2
F
e2.3
8
O4
C
o0.6
2
F
e2.3
8
O4
C
o0.6
2
F
e2.3
8
O4
Co0.62Fe2.38O4
C
o0.6
2
F
e2.3
8
O4
C
o0.6
2
F
e2.3
8 O4 Si O2 Si O2 C o0 .6 2 F
e2.3
8
O4 Co
0
.6
2
F
e2.3
8
O4
C
o0.6
2
F
e2.3
8
O4
C
o0.6
2
F
e2.3
8
O4
C
o0.6
2
F
e2.3
8 O4 Si O2 Si O2 Si O2 Si O2 Si
O2 SiO
2 Si O2 Si O2 Si O2 Si O2 Si O2 Si O2 In te n si ty
9
Figure 3 – Backscattered SEM images of the slag, synthesised in air for 2 hours at 1523 K,
the composition of areas A, B and C are presented in table 2
Table 2 - EDX semi-quantitative analysis (wt. %) of areas A, B and C from figures 3a and 3b
Area Cu Fe Co Si Ca Al O
A 3.6 52.8 13.8 - - 0.8 28.7
B 10.3 6.4 1.9 23.1 11.6 4.2 42.5
C - - - 46.4 - - 53.6
3.1 Carbothermic reduction of slag
It was important to investigate low temperature reduction because most of Co in slag dumps is
in the oxide form [1]. Furthermore, the copper oxide in slag may also be recovered by this
method. The plots of % reduction versus time curves for the carbothermic reduction of slag
with carbon black and activated charcoal are shown in figures 4a and 4b, respectively. By
comparison, the extent of metallization was higher with activated charcoal (figure 4b) than with
carbon black (figure 4a) and this is because, activated charcoal is more reactive than carbon
black [25].
The plots of % reduction versus time curves in figures 4a and 4b are characterised by
three stages: (i) a slow stage, ≈ 0 % – 7 % reduction, (ii) a very fast or accelerated stage, ≈ 7 –
30 % reduction and, (iii) slightly slower reduction. The slow stage in the first regime shows
that the reactivity of carbon black and activated charcoal are both lower [25]. By comparison,
[image:10.595.88.505.365.453.2]10
charcoal) because carbon black is less reactive than activated charcoal [25]. Analysis of the
partially reacted samples revealed that metallization of Cu and to a lesser extent Co, occurred
[image:11.595.76.519.160.339.2]in the second regime whereas metallization of Fe occurred mainly in the third regime.
Figure 4 – Carbothermic reduction of slag at molar ratio of MO:C = 1:3; (a) with carbon
black and (b) with activated charcoal, argon flow rate = 0.6 litre min-1
The XRD patterns of the samples which were reduced with carbon black and activated charcoal
are shown in figures 5a and 5b, respectively. Similar phases are present at 1173 K and 1223 K
in figure 5a (with carbon black) and this is in good agreement with the TGA results in figure
4a, as the % reduction only increased by about 4 %R when reduction temperature was increased
from 1173 K to 1223 K. It can be observed from figure 5a that metallization of Cu is higher
than Co and Fe at 1173 K and this shows that carbon black is less reactive as Cu, Co and Fe
are all stable in the presence of reactive carbon above 1173 K [26].
As discussed above, the extent of reduction was higher with activated charcoal (figure
4b) and this is why the XRD peak intensities for Cu and Fe are high in figure 5b. There are no
peaks for Co in the XRD patterns in figure 5b because it dissolved in Fe [19, 20].
0 500 1000 1500 2000
0 20 40 60 80 100
%
R
e
d
u
c
ti
o
n
Time (seconds) 1173K
1223K 1273K 1298K 1323K
( a )
0 500 1000 1500 2000
0 20 40 60 80 100
%
R
e
d
u
c
ti
o
n
Time (seconds)
1173K 1223K 1273K 1323K
11
Figure 5 – XRD patterns after reduction of slag at molar ratio of MO:C = 1:3, with; (a)
carbon black and (b) activated charcoal. Argon flow rate = 0.6 litre min-1
3.1.1 Reaction mechanism for the carbothermic reduction of slag
As shown from the SEM images in figure 3, the Co0.62Fe2.38O4 crystals are enclosed in the
glassy phase and hence carbothermic reduction may occur via diffusion of cations, anions and
gases (CO and CO2 gas) due to lack of contact between metal oxides in slag and solid carbon.
The reduction reactions may occur via the following mechanisms:
(i) Diffusion of O2- and metal (M2+) ions from the metal oxide (MO) from the slag to
the slag/carbon interface, followed by adsorption of the O2- ions on the carbon surface. The overall rate of reaction may be controlled by the diffusion of O2- and metal (M2+) ions through the slag matrix and/or gasification of carbon.
(ii) Diffusion of carbon or intermediate CO gas through the slag matrix so that the
metallic phase is formed within the slag phase.
The SEM images for the samples which were reduced with carbon black and activated charcoal
are shown in figures 6a - 6d. The metallic phases are mainly found at the periphery of the
particles and partly within the slag phase. The metallic phases at the periphery of the particles
were formed via diffusion of the metallic ions (cations) and oxygen ions (anions) from the slag
phase. As a result, the overall reactions leading to formation of metallic phase at the periphery
20 30 40 50 60 70
0 7000 14000 21000 0 6000 12000 18000 0 5000 10000 15000 C
( a )
C a Si O3 In te n si ty C
2() C Fe CoFe C o F e Fe C o C o C a Si O3 C F C u C u C u C u C u C F M In te n si ty CF C u Fe 1173 K 1273 K C a Si O3 C a Si O3 C a Al2 Si2 O8 C a Al 2 Si2 O8 C F C F C F C F C F C o F e C o F e C F C F C F C F C F C F C F CF CF CF CF
CF=CaFeSi2O6
M M M M M M M M M M M M Si O2 Si O2 Si O2 Si O2 Si O2 Si O2 Si O2 Si O2 Si O2 Si O2 Si O2 Si O2 Si O2 Si O2 Si O2 Si O2 Si O2 Si O2 Si O2 Si O2 Si O2 In te n si
ty M=Fe3O4
M
1323 K
20 30 40 50 60 70
0 5500 11000 16500 0 6100 12200 18300 0 8100 16200 24300 In te n si ty In te n si ty C C a Al2 Si2 O8 C a Al2 Si2 O8 C a Al2 Si2 O8 Si O2 Si O2 Si O2 1173 K 1273 K Si O2 Si O2 C C A A A CF CF CF CF CF A A A A=CaFeAlSiO6 CF CF CF CF CF CF CF CF CF CF CF
CF=CaFeSi2O6
Si
O2
Si
O2
Si
O2 SiO
2 Si O2 Si O2 Si O2 Si O2 Si O2 Si O2 Si O2 Si O2 Si O2 Si O2 Si O2 Si O2 Si O2 Si O2 Si O2 Si O2 Si O2 Fe Fe Fe Fe Fe C u C u C u C u C u
2()
In te n si ty C u Fe CF A
12
of the slag particle may be represented by equations 10– 13. The CO gas from equation 11
may diffuse into slag via cracks, to react with the O2- ions (equation 12), causing metallization
in the slag phase via equation 12. The diffusion of the CO and CO2 gases might have occurred
through the cracks since the partially reacted samples had several cracks.
2 2
O M
MO in the slag phase 10
e g CO O
C 2 ( )2 , at slag/carbon interface 11
M e
M2 2 , at the slag particle periphery or cracks 12
e g CO O
g
CO( ) 2 2( )2
, at the slag particle surface or cracks 13
The Co0.62Fe2.38O4 crystals [24] are present in the sample after reduction at 1173 K as a result
of incomplete reduction. Fe rich slag (≈10 - 13 wt. % Fe) in the form of laths and dendrites and,
glassy phase (≈ 3 wt.% Fe) are the other phases at 1173 K.
A significant proportion of Fe is still dissolved in slag at 1323 K, for the reduction with
carbon black (figure 6b) as a result of low metallization. The slag in figure 6b has 7 wt.% Fe -
22 wt.% Fe. On the other hand, the fraction of metallic phase is high with activated charcoal at
1323 K (figure 6d) such that slag has less than 5 wt. % Fe. Co and Cu are absent from slag at
1323 K (figures 6b and 6d). In short, only Fe is dissolved in slag at 1323 K and this is due to
the fact that: (i) metallization of Fe requires lower partial pressure of O2 gas than Cu and Co
13
Figure 6 – Backscattered SEM images after reduction of slag at molar ratio of MO:C = 1:3,
with: (a) carbon black at 1173 K, (b) carbon black at 1323 K, (c) activated charcoal at 1173
K and (d) activated charcoal at 1323 K
3.3.2 Reaction kinetics for carbothermic reduction of slag
The rate of reduction, derived from the %R versus time plots in figures 4a and 4b, were fitted
into the interface model (equation 14) [28], diffusion model (equations 15) [28] and mixed
reaction model (equation 16) [29]) in order to establish the reaction mechanism which might
be governing the overall rate. The experimental data fitted well with the mixed reaction model
in equation 16 as shown in figure 7. Metallization might have been controlled by the mixed
reaction model because: (i) the cross-sectional SEM analysis of the reduced samples showed
the presence of metallic phases at the periphery of the slag particles (figures 6a - 6d) thereby
confirming that there is diffusion of the metallic (M2+) and O2- ions and, (ii) the extent of
metallisation was sensitive to reduction temperature and type of carbon, which is a
14 Kt X 3 1 ) 1 (
1 14
Kt X
X
3 2 ) 1 ( 3 2 1 15 Kt 3 2 3 1 X) -(1 + X) -2(1
-1 16
[image:15.595.79.513.308.485.2]Where X is the fraction reacted at time t and k is the rate constant
Figure 7 – Plots of 1 - 2(1-X)1/3 - (1-X)2/3 versus time (hours) for the isothermal data at various temperature, with activated charcoal; (a) second regime and (b) third regime
0.03 0.04 0.05 0.06 0.07 0.08 0.09 0.10 0.000 0.005 0.010 0.015 0.020 1 -2 (1 -X ) 1 /3 +( 1 -X ) 2
/3 =
K
t
( a )
12 23 K, R 2 =0 .99 40 12 73 K
, R 2=0
.997 6
1223 K, R
2=0.9 990
Time (hours)
1173 K , R
2=0.996
1
0.0 0.5 1.0 1.5 2.0 2.5
0.00 0.05 0.10 0.15 0.20 0.25 0.30 0.35 0.40 1 -2 (1 -X ) 1 /3+( 1 -X ) 2
/3 =
K t 13 23 K, R 2=0 .99 71 1273 K, R
2=0.94
60
1223 K
, R
2=0.9561
1173 K, R
2
=0.9971
Time (hours)
15
Figure 8 - Arrhenius plots (lnK against reciprocal of temperature) for the carbothermic
reduction of slag, the rate constant k was calculated using the G.B + interface model. The
activation energy is inserted in each line
The plots of the lnK versus 1/T lines are shown in figure 8 and the calculated value of activation
energy are inserted on each fitted line. The activation energy was calculated in the second and
third regimes of the % reduction versus time curves (see figures 4a and 4b). The activation
energies in the second regime are 161 ± 12 kJ mol-1 and 148 ± 14 kJ mol-1 with carbon black and activated charcoal, respectively, and they are comparable with the activation energy of 167
kJ for the reduction of Cu from slag [14, 31]. As stated above, metallization of Cu occurred
mainly in the second regime. The derived value of activation energies in the third regime are
288 ± 64 kJ mol-1 and 271 ± 34 kJ with carbon black and activated charcoal, respectively, and they are comparable with activation energy of: (i) 250 kJ – 350 kJ for the CO2(g) – C reaction
[32-34] and (ii) 300 ± 37 kJ for the diffusion of oxygen in the Ca2Al2SiO7 phase in a
temperature range of 1273 K – 1573 K [35, 36]. It can be observed in figure 8 that the natural
logarithmic values of the rate constant (lnK) are higher for the reduction of slag with activated
0.00075
0.00078
0.00081
0.00084
0.00087
0.00090
-6
-5
-4
-3
-2
-1
0
1/ absolute temperature (/K)
Q = 148 16 kJ
Q = 161 12
kJ
Q =
28
8
64
kJ
carbon black second regime
activated charcoal third regime
carbon black third regime activated charcoal second regime
Q = 271
3 4 kJ
ln
16
charcoal than with carbon black implying that the rate of reductions are higher with the former
than with the later.
3.2 Sulphidization of slag in the presence of CaSO4 and graphite
The sulphidization of slag in the presence of CaSO4 was carried out with less reactive carbon
(graphite) in order to minimise the formation of CaS [15] via equation 5. The sulphidization of
slag in the presence of CaSO4 and graphite was influenced by the reaction temperature and,
molar ratio of CaSO4:C.
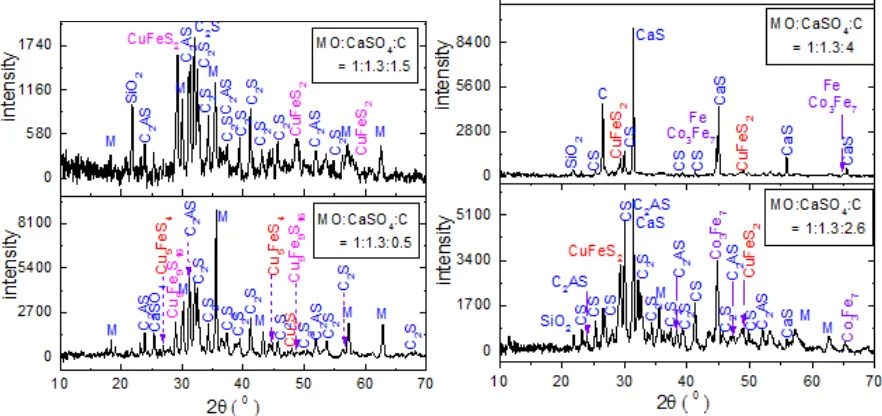
3.2.1 Effect of molar ratio of graphite
For studying the effect of increasing molar ratio of graphite, the molar ratio of MO:CaSO4 =
1:1.3 and reaction temperature (1323 K) were kept constant and, the XRD results are given in
figure 9. The XRD peak intensities for Fe3O4 and calcium silicates (Ca2SiO4 and Ca3SiO5) are
very high at molar ratio of MO:CaSO4:C = 1:1.3:0.5 and this shows that: (i) all CaO resulting
from the reduction calcination of CaSO4, reacted with SiO2 and, (ii) part of SO2 gas from the
reduction calcination of CaSO4 escaped out due to insufficient carbon, considering the fact that
metal oxides (Cu2O, CuO, CoO, FeO and Fe3O4) cannot be sulphidized with SO2 gas in the
absence of carbon (equation 17).
(g) 1.5O + MS = (g) SO +
MO 2 2 17
By increasing the molar ratio of graphite to MO:CaSO4:C = 1:1.3:1.5, sulphidization increased
and hence the XRD peak intensities for the metal sulphides (CuFeS2, Cu2S, Cu5FeS4) and metal
oxide (Fe3O4) are high and low, respectively. The higher sulphidization shows that most of the
SO2 gas from the reduction calcination of CaSO4, reacted with the metal oxides to form metal
sulphides (see equation 3) at molar ratio of MO:CaSO4:C = 1:1.3:1.5.
Part of Co and Fe were partially reduced to metallic / alloy state (equation 18) when the
molar ratio of graphite was increased to MO:CaSO4:C = 1:1.3:2.6. By comparison,
metallization of Co and Fe was higher and most of CaSO4 was calcined to CaS (see equation
17
metallization of Co and Fe resulted in low sulphidization at molar ratio of MO:CaSO4:C =
1:1.3:4.
(g) 0.5CO +
M(s) = C(s) 0.5 +
MO 2 18
Turkdogan has recommended that maximum sulphidization may occur at the molar ratio of
CaSO4:C = 1:0.5 [15] but this is not the case based on the results in figure 9 as maximum
sulphidization was achieved at the molar ratio of MO:CaSO4:C = 1:1.3:1.5. It is worth noting
that the molar ratio of CaSO4:C = 1:0.5 is only important for the calcination of SO2 gas from
CaSO4 (equation 2) but extra carbon is needed in the reaction between SO2 gas and metal oxides
[image:18.595.77.518.346.554.2](equation 3).
Figure 9 - XRD patterns after sulphidization of slag in the presence of CaSO4 and graphite at
1323 K and different molar ratio of MO:CaSO4:C, M=Fe3O4, CS=CaSiO3, C2S=Ca2SiO4 and
C2AS=Ca2Al2SiO7
3.2.2 Effect of reaction temperature for sulphidization with graphite
The effect of reaction temperature was studied at the molar ratio of MO:CaSO4:C = 1:1.3:1.5
and the plots of % conversion versus time curves are shown in figure 10. It can be observed
from figure 10 that sulphidization is very sensitive to reaction temperature. For example, the
18
The results in figure 10 shows that the extent of conversion is slightly lower at 1323 K than at
1273 K but this may be due to production of CO + CO2 gases at 1323 K rather than CO2 gas at
[image:19.595.191.404.178.340.2]T ≤ 1273 K, owing to the increased reactivity of graphite with temperature.
Figure 10 – Plot of conversion versus time curves for the sulphidization of slag in the
presence of CaSO4 and graphite, molar ratio of MO:CaSO4:C = 1:1.3:1.5
The XRD patterns of the samples after sulphidizing at various temperatures are shown in figure
11 from which the following observations were made: (i) reduction calcination of CaSO4 was
incomplete, after 2 hours at 1173 K and, (ii) part of CaSO4 was calcined to CaS at 1173 K and
1223 K. It is worth noting that the phases obtained at 1173 K and 1223 K agree broadly with
the Ca-Fe-O-S system [17] as there is an equilibrium between CaS + Fe3O4 and CaSO4 +
Ca2Fe2O5 phase fields.
The sulphidization of slag in the presence of CaSO4 and carbon can occur, when: (i)
sulphur is calcined from CaSO4 and, (ii) metal oxide is reduced to metallic state. Nonetheless,
metal oxide cannot be reduced to metallic state when the reactivity of carbon is low and hence
sulphidization does not take place. The Gibbs energy change for the reduction of CaSO4 to CaS
and that of Fe3O4 to Fe are compared in equations 19 and 20, respectively, and it can be
observed that equation 19 is more thermodynamically feasible than equation 20. Therefore,
equation 20 may occur preferentially, when the reactivity of carbon (graphite) is lower. Based
on the thermodynamic prediction in equations 19 and 20 and, the presence of CaS and Fe3O4
in the XRD patterns at 1173 K and 1223 K (figure 11), it can be concluded that the
sulphidization of Fe in the presence of CaSO4 and graphite was limited by the reduction of
0 1000 2000 3000 4000 5000 6000
0 20 40 60 80 100
%
C
o
n
ve
rsi
o
n
Time (seconds)
19
Fe3O4. Fe3O4 co-exists with Ca2Fe2O5 and the formation of the later phase may be represented
by equation 21.
kJ 244 -G (g), 2CO + CaS = 2C +
CaSO4 2 1173 K 19
kJ 51 -G (g), 2CO 3Fe 2C O
Fe3 4 2 1173 K 20
kJ 94.5 -G , CO 4 5 SO 3 O Fe Ca 2 3 = C 4 5 + CaSO 3 O Fe K 1173 2 2 5 2 2 4 4 3 21
The Gibbs energy change for the carbothermic reduction of FeO, CoO and Cu2O are compared
in equations 22, 23 and 24, respectively, and it can be observed that equation 24 is more
thermodynamically feasible and hence preferential metallization of Cu occurred which then led
to its sulphidization at 1173 K and 1223 K. The above analysis shows that there is broad
agreement between the thermodynamic prediction in equations 22–24 and the experimental
results at 1173 K and 1223 K (figure 11).
kJ 21 -G (g), CO 2Fe C
2FeO 2 1173 K 22
kJ 93 -G (g), CO 2Co C
2CoO 2 1173 K 23
kJ 230 -G (g), CO 4Cu C O
2Cu2 2 1173 K 24
The reactivity of graphite increases with increase in temperature such that Fe3O4 is reduced to
20
Figure 11 - XRD patterns of the samples, sulphidized in the presence of CaSO4 and graphite,
molar ratio of MO:CaSO4:C = 1:1.3:1.5
3.2.4 Estimation of activation energy for sulphidization of slag
The experimental data for the sulphidization of slag in the presence of graphite fit well with
the mixed reaction model (equation 16) as shown in figure 12a. The natural logarithmic of the
rate constant (gradient for each isothermal in figure 12a) were plotted against the reciprocal of
absolute temperature (1/T) for deriving the activation energy and the results are shown in figure
12b. It can be observed from figure 12b that the plot of the lnK versus 1/T line changes at 1273
K and the change in the slope of the line agrees with the XRD results (figure 11) as similar
phases were obtained at 1173 K/1223 K and at 1273 K/1323 K. The activation energy is 311 ±
6 kJ in the lower temperature regime (1173 K - 1273 K) is comparable to: (i) activation energy
of 305 kJ – 340 kJ for the CO2 gas – C (graphite) reaction [37-39] in the temperature range of
1123 K – 1373 K and, (ii) enthalpy change of 303 kJ for reaction 25 [27]. Note that the
carbothermic reduction of Fe3O4 is directly related to the CO2– C reaction [40] and hence it
can be concluded that the sulphidization reaction was controlled by the reduction of Fe3O4 in
the lower temperature regime (T < 1273 K).
10 20 30 40 50 60 70
0 3000 6000 9000 0 2600 5200 7800
10 20 30 40 50 60 70
1223 K F F F F In te n si ty
2()
F=Ca2Fe2O5 1173 K
C u2 S C u2 S C u2 S C a2 Al2 Si O7 C a2 Si O4 C a2 Si O4 C a2 Al 2 Si O7 C a2 Al2 Si O7 C a SO 4 F F F F F F X F X X X X=Ca2Al2SiO7
C a2 Si O4 C a2 Si O4 C u2 S Si O2 F e3 O4 F e3 O4 C a2 Si O4 C a2 Si O4 F e3 O4 F e3 O4 F e3 O4 F e3 O4 F e3 O4 F e3 O4 F e3 O4 F e3 O4 C a S C a S C a S C a S C a S C a S CaS C a SO 4 C a SO 4 C a SO 4 In te n si ty CaS Si O2 F
10 20 30 40 50 60 70
0 650 1300 1950 0 560 1120 1680
10 20 30 40 50 60 70
1323 K In te n si ty
2() SiO2 1273 K C a Si O3 C a Si O3
Ca2SiO4
C a2 Si O4 C a2 Si O4 SiO2 C a2 Al2 Si O7 C a2 Al2 Si O7 C a2 Al 2 Si O7 C a2 Al 2 Si O7 C a2 Si O4 F e3 O4 F e3 O4 C a2 Si O4
Ca2SiO4
21 (g)
2CO + 3Fe = 2C + O
Fe3 4 2 25
On the other hand, the activation energy of 215 kJ in the upper temperature regime (T ≥ 1273
K) is comparable to the activation energy of 239 ± 18 kJ, for the reaction between CaS and
CaSO4 [41] and this is because, the reduction calcination of CaSO4 to CaO and SO2 occurs via
equations 26 - 28 [15]. The SO2 gas from equation 28 may react with the metal oxides according
to equation 29. The enthalpy change for reaction 28 is 234 kJ mole-1 SO2 gas [15]. By
comparing the enthalpy change of 234 kJ and the activation energy of 239 ± 18 kJ for reaction
28 with the activation energy of 215 kJ in the upper temperature regime (figure 12a), it can be
concluded that sulphidization of slag in the presence of CaSO4 and graphite, was limited by
equation 28.
CaSO4 CCaS2CO2(g) 26
CO2(g)C2CO(g) 27
) ( 4 4
3CaSO4 CaO SO2 g
CaS 28
) ( 3 )
(
3CO g SO2 MS CO2 g
[image:22.595.82.517.500.668.2]MO 29
Figure 12 – plots of (a) 2-2/3x-(1-X)1/3-(1-X)2/3 against time t and (b) lnK against reciprocal
of absolute temperature, molar ratio of MO:CaSO4:C = 1:1.3:1.3
3.3 Carbothermic reduction of matte in the presence of CaO
0.0 0.3 0.6 0.9 1.2 1.5 1.8
0.0 0.1 0.2 0.3 0.4 0.5 0.6
R
2 =0
.9
9
3
7
R2=0.9942 R2
=0.9936
Time (hours)
R2
=0.9823
2
-2
/3
X-(1
-X)
1
/3-(
1
-X)
2
/3
( a )
0.00076 0.00078 0.00080 0.00082 0.00084 -1.0
-0.5 0.0 0.5 1.0 1.5 2.0
( b )
1/absolutely temperature (/K)
Q=311 6 kJ Q=215.1kJ
9995 . 0
2
R
ln
22
As stated above, copper, cobalt and iron sulphides may be carbothermically reduced to
metallic/alloy state in the presence of CaO and hence the sulphidized slag was reacted with
CaO and activated charcoal in the temperature range of 1173 K - 1323 K. The plots of %
reduction against time curves are shown in figure 13a from which it is apparent that the
reduction of sulphidized slag (matte) was much faster than the direct reduction of slag with
carbon (MO + C) (see figures 4a and 4b). The reduction of the sulphidized slag was faster due
to the presence of liquid phase [42]. The XRD patterns for the reduced sulphidized slag are
shown in figure 13b from which the absence of metals sulphides (CuFeS2, Cu5FeS4, FeS and
Cu2S) is apparent. Cu, Fe and CoFe were produced as a result of metallization of the
[image:23.595.79.521.320.490.2]sulphidized slag.
Figure 13 – Carbothermic reduction of sulphidized slag in the presence of CaO with activated
charcoal, molar ratio of MS:CaO: C = 1:2:2; (a) TGA results and (b) XRD pattern at 1173K
The backscattered SEM images of the sample that was sulphidized at 1323 K and reduced in
the presence of CaO and activated charcoal at 1323 K are presented in figure 14. By comparison,
the metallic phases produced via carbothermic reduction of the sulphidized slag are larger than
those produced via direct reduction of the slag (see figures 6a and 6d) and this is due to the
presence of liquid phases [42].
0 1000 2000 3000 4000 0 20 40 60 80 100 % R e d u c ti o n ( % R ) Time (seconds) 1173K 1223K 1273K 1323K (a)
20 30 40 50 60 70 80
2000 4000 6000 8000 10000 12000 14000 16000 (b) C a Al 2 O4 Si O2 Si O2 Si O2 C u C u C a2 Si O4 C a2 Si O4 F e C o F e C o F e C o C a O CaO C a O C a O C a O C a O C a S C a S C a S C a S C a S CaS In te n si ty C u
23
Figure 14 – Backscattered SEM images of the sample, sulphidized at 1323 K and reduced in
the presence of CaO and activated charcoal at 1323 K, molar ratio of MS:CaO:C = 1:2:2. The
bright particles are the metallic phases
Energy analysis
The theoretical energy requirement for the metallization of Cu, Co and Fe from slag via
sulphidization – carbothermic reduction was calculated using HSC 5.1 software [27], based on
the following assumptions:
Sulphidization – (i) Cu2S, CoS and FeS are the only metal sulphides in the sulphidised slag, (ii)
alumina is in the form of CaAl2Si2O8, (iii) the reactants and products enter and leave the
reaction chamber at 298 K and 1323 K, respectively and, (iv) the only product gas is CO2 gas.
Carbothermic reduction – (i) CO gas is the only gas generated in the reduction of mineral
sulphides and (ii) the reactants and products enter and leave the reaction chamber at 1323 K.
The theoretical energy requirement for the sulphidization of slag and carbothermic
reduction of the sulphidized slag was calculated as 0.8 kWh and 0.15 kWh, respectively, per
kg of slag, giving the total theoretical energy requirement of 0.95 kWh per kg of slag. By
comparison, the theoretical energy requirement for smelting slag at 1823 K is 1.1 kWh per kg
of slag.
4.0 Conclusions
1. The direct reduction of Cu-Co slag requires higher temperature (T ≥ 1323K) and a very
reactive carbon such as activated charcoal as shown from the % reduction versus time
24
2. The activation energies were 288 ± 64 kJ and 271 ± 34 kJ for the carbothermic reduction
of slag with carbon black and activated charcoal, respectively, (see figure 8) in the third
regime suggesting that the rate determining step is the CO2 – C reaction, which has the activation energy in the range of 250 kJ – 360 kJ [33, 34].
3. The metal oxides (Cu2O, CuO, Fe3O4, Co0.62Fe2.38O4) were converted into metal sulphides (CuFeS2, Cu2S, Cu5FeS4) via sulphidization of the slag in the presence of CaSO4 as shown in the XRD patterns in figure 11.
4. It is important to control the molar ratio of CaSO4:C. Sulphidization was incomplete at molar ratio of CaSO4:C = 1:0.5 and metallization of Co and Fe occurred at molar ratios of CaSO4:C = 1:2 or 1:4 (see figure 9).
5. Sulphidization of slag in the presence of CaSO4 and graphite was limited by the CO2 – C(graphite) reaction at T < 1273 K, with an activation energy of 311 ± 6 kJ (see figure
12b).
6. Complete metallization was achieved when the sulphidized slag was reduced in the
presence of CaO and activated charcoal (see figures 13a and 13b). The metallic / alloy
particles produced via carbothermic reduction of the sulphidized slag were larger (see
figure 14) than those produced via direct reduction of the slag with carbon (see figures 6a
– 6d).
5.0 Acknowledgement
This paper is a revised version of the paper published in the proceedings on ‘Celebrating the
Megascale: Proceedings of the Extraction and Processing Division Symposium on
Pyrometallurgy in Honor of David G.C. Robertson’edited by Mackey P.J. et. al., published by
The Minerals, Metals & Materials Society, Wiley, 2014. The authors gratefully acknowledge
the financial support from the Institute of Materials, Minerals and Mining (IOM3) in London
and the Copperbelt University in Zambia.
6.0 References
1. Jones, R.T., et al., Recovery of cobalt from slag in a DC arc furnace at Chambishi, Zambia.
25
2. Davenport, W.G.L., et al., Extractive Metallurgy of Copper (4th Edition). Chemical, Petrochemical & Process. 2002: Elsevier. 1-452.
3. Mututubanya, A., Cobalt recovery from old Nkana Copper Slag via solid state carbothermic
reduction and sulphation, in Metallurgy2013, University of Zambia: Lusaka.
4. Imris, I., Cobalt distribution in Rokana smelter. Transactions of the Institution of Mining and Metallurgy, Section C: Mineral Processing and Extractive Metallurgy, 1982. 91: p. C153-C161. 5. Matusewicz, R. and E. Mounsey, Using ausmelt technology for the recovery of cobalt from
smelter slags. JOM, 1998. 50(10): p. 51-52.
6. Tümen, F. and N. Bailey, Recovery of metal values from copper smelter slags by roasting with
pyrite. Hydrometallurgy, 1990. 25(3): p. 317-328.
7. A H S F T Metal recovery from copper converter slag by roasting with
ferric sulphate. Hydrometallurgy, 1997. 44(1 2): p. 261-267.
8. Sukla, L.B., S.C. Panda, and P.K. Jena, Recovery of cobalt, nickel and copper from converter slag
through roasting with ammonium sulphate and sulphuric acid. Hydrometallurgy, 1986. 16(2):
p. 153-165.
9. Bodsworth, C., The extraction and refining of metals. Materials Science and Technology, ed. B. Ralph. 1994, Boca Raton: Fla. : CRC Press. 346.
10. Banda, W., High Temperature Phase Equilibria in the Fe-Co-Cu-Si system Pertaining to slag
cleaning, in Department of Process Engineering2006, Stellenbosch: Stellenbosch.
11. Banda, W., N.T. Beukes, and J.J. Eksteen, Factors influencing base metal recovery from waste
reverberatory furnace slags in a 50 kVA laboratory DC plasma arc furnace. Journal of The South
African Institute of Mining and Metallurgy, 2004. 104(3): p. 201-207.
12. Jones, R.T. and A.C. Deneys, Using a direct-current arc furnace to recover cobalt from slags.
JOM, 1998. 50(10): p. 53-56.
13. Zhai, X.-j., et al., Recovery of cobalt from converter slag of Chambishi Copper Smelter using
reduction smelting process. Transactions of Nonferrous Metals Society of China, 2011. 21(9):
p. 2117-2121.
14. Reddy, R., V. Prabhu, and D. Mantha, Recovery of copper from copper blast furnace slag, in
SME Annual Meeting and Exhibit 2004: Denver, Colorado.
15. Turkdogan, E.T., Physical chemistry of high temperature technology 1980: Academic Press. 16. Mohapatra, B.N.N., Raghvendra; Joshi, S. M.; Cement, . Effective use of waste generated in
thermal power plant as a value added product in cement manufacturing and its environmental
26
17. Bale, C.W., et al., FactSage thermochemical software and databases. Calphad: Computer Coupling of Phase Diagrams and Thermochemistry, 2002. 26(2): p. 189-228.
18. Cutler, C.J., et al. Phasing out reverbatory furnace operations at KCM Nkana. in Southern
African Pyrometallurgy 2006. 2006. Johannesburg.
19. Hara, Y.R.S. and A. Jha. A Novel Low Energy Route for the Extraction of Copper and Cobalt
Metals/Alloys from the Zambian Sulphide Concentrates. in Characterization of Minerals,
Metals, and Materials. 2012. John Wiley & Sons.
20. Hara, Y. and A. Jha, Carbothermic reduction of Zambian sulphide concentrates in presence of
lime. Mineral Processing and Extractive Metallurgy, 2013. 122(3): p. 146-156.
21. Manasse, A. and M. Mellini, Chemical and textural characterisation of medieval slags from the
Massa Marittima smelting sites (Tuscany, Italy). Journal of Cultural Heritage, 2002. 3(3): p.
187-198.
22. Ward, C.R. and D. French, Determination of glass content and estimation of glass composition
in fly ash using quantitative X-ray diffractometry. Fuel, 2006. 85(16): p. 2268-2277.
23. Jiménez, J.C.F.-C.G.R.J.M.F., Occurrence and speciation of copper in slags obtained during the pyrometallurgical processing of chalcopyrite concentrates at the Huelva smelter (Spain).
Journal of Mining and Metallurgy, Section B: Metallurgy 2012. 48(2): p. 161-171.
24. Ettler, V., et al., Mineralogy and environmental stability of slags from the Tsumeb smelter,
Namibia. Applied Geochemistry, 2009. 24(1): p. 1-15.
25. Vignes, A., Extractive metallurgy 2 Metallurgical reaction processes. Vol. 2. 2011, London: Wiley.
26. Habashi, F., Principles of Extractive Metallurgy. 1969, London: Gordon and Breach. 194 - 196. 27. Roine, A., HSC Chemistry 5.1, 2002, Outokumpu Research Oy: Finland.
28. Tathavadkar, V.D., The process physical chemistry of extraction of sodium chromates from
chromite ores, in Department of materials school of process, environmental 2001, Leeds.
29. Ekmekyapar, A., et al., Investigation of Leaching Kinetics of Copper from Malachite Ore in
Ammonium Nitrate Solutions. Metallurgical and Materials Transactions B, 2012. 43(4): p.
764-772.
30. Habashi, F., Kinetics of metallurgical processes. 1999, Quebec: Metallurgie Extractive.
31. Riveros, G., et al. Factors Affecting the Rate of Copper Reduction During Copper refining. in
Yazawa International Symposium, Metallurgical and Materials Processing: Principles and
Technologies, Vol. II: High-Temperature Metals Production,. 2003. Warrendale.
32. Rao, Y.K. and B.P. Jalan, A study of the rates of carbon-carbon dioxide reaction in the
27
33. Matsui, I., D. Kunii, and T. Furusawa, Study of char gasification by carbon dioxide. 1. Kinetic
study by thermogravimetric analysis. Industrial & Engineering Chemistry Research, 1987. 26(1):
p. 91-95.
34. Dutta, S., C.Y. Wen, and R.J. Belt, Reactivity of Coal and Char. 1. In Carbon Dioxide Atmosphere.
Industrial & Engineering Chemistry Process Design and Development, 1977. 16(1): p. 20-30. 35. Brady, J.B., Diffusion Data for Silicate Minerals, Glasses, and Liquids, in Mineral Physics &
Crystallography: A Handbook of Physical Constants. 2013, American Geophysical Union. p.
269-290.
36. Yurimoto, H., M. Morioka, and H. Nagasawa, Diffusion in single crystals of melilite: I. Oxygen.
Geochimica et Cosmochimica Acta, 1989. 53(9): p. 2387-2394.
37. Turkdogan, E.T., et al., Rate of oxidation of graphite in carbon dioxide. Carbon, 1968. 6(4): p. 467-484.
38. Karata and C., Catalysis of the graphite CO2 reaction by iron from in-situ reduction wustite
over the range 870 1100°C. Mineral Processing and Extractive Metallurgy, 2001. 110(1): p.
7-13.
39. Karatas, C., Catalytic enhancement of graphite - CO2 reaction by in situ reduced chromium and
nickel from their oxides Cr2O3 and NiO over the temperature range 850-1100°C Mineral
Processing and Extractive Metallurgy, 2004. 113(1): p. 19-24.
40. Rosenqvist, T., Principles of Extractive Metallurgy (2nd edition). 1983, Japan: McGraw.Hill. 460-500.
41. Kutsovskaya, M.L., M.T. Hepworth, and J.R. McGaa, Recovery of Lime, Sulfur, and Iron from
Gypsum and Pyrite Wastes. Ind. Eng. Chem. Res., 1996. 35(5): p. 1736-1746.
42. Jha, A., Carbothermic reduction of sulphide minerals, in Department of Metallurgy and