Bubbles, Thin Films and Ion Specificity
220
0
0
Full text
(2)
(3) Preface This thesis is an account of research undertaken within the Department of Applied Mathematics, Research School of Physical Sciences and Engineering, within the Australian National University. This thesis comprises my original work; however some aspects of the work were undertaken in collaboration with others. In Chapter 2, on bubble coalescence and surface tension in mixed electrolytes, the surface tension measurements were carried out by Lehoa Scruton and some of the bubble coalescence data were obtained by Casuarina Dalton. The work in Chapter 5 on thin films was done in the laboratories of, and in collaboration with, colleagues at the University of Queensland Professor Anh Nguyen, Dr Stoyan Karakashev and Mr Phong Nguyen. Mr Phong Nguyen assisted in experimental set-up and instrument use, and Dr Karakashev carried out the theoretical analysis. The bubble terminal rise measurements in Chapter 6 were carried out at the Ian Wark Research Institute, University of South Australia, in collaboration with Mr Luke Parkinson and Professor John Ralston. Luke Parkinson designed and built the bubble rise instrument, and assisted with its use. This thesis contains no material which has been accepted for the award of any other degree or diploma in any university. To the best of my knowledge, it contains no material previously published or written by another person, except where due reference is made in the text.. ___________________ Christine Henry. i.
(4) Acknowledgements First, many thanks to my supervisor, Vince Craig, for all the support, help, ideas and editing. Thanks especially for your drive and belief in the work, which kept it going forwards when I had doubts. You were right! The Department of Applied Maths has been a great place to work, and I thank everyone who made my time here so enjoyable. Tim Sawkins and Anthony Hyde provided technical assistance and advice, and Margo Davies and Jan James kept everything running smoothly. Tim Senden was a great friend, advisor and editor, always willing to offer suggestions. Chiara Neto was an advisor, and helped me get started in research. Toen Castle, my officemate for most of the PhD, was a steady source of friendship, music, unfamiliar words and fun conversation. Many others gave social support in the tearoom and the beer garden – an incomplete list: Anna Carnerup, Drew Evans, Shaun Howard, Steve Hyde, Stu Ramsden, Vanessa Robins, and Adrian Sheppard. Every conference I went to provided a fresh charge of scientific inspiration and energy, and some great friendships – thanks to people I talked with (and bodysurfed with) at ACSSSC ’06 and ’08, Cancun ’06, ECIS ’07, and all the Kioloa trips. Thanks also to collaborators and to everyone at the University of Melbourne, the University of Queensland and the Ian Wark Research Institute who helped out when I visited. CRC SmartPrint provided scholarship assistance throughout the PhD. Canberra is my hometown, and the nature, geography and weather are part of my life. As I move on (literally and figuratively) I acknowledge that these years wouldn’t have been the same anywhere else. My family offered unwavering support. All the Canberra friends provided a life outside uni, especially with the increasingly luxurious coast trips. Paul Barnsley, among other things, fed me a steady supply of comics. I couldn’t have got through without various other cultural and pop-cultural distractions – Salon, The Daily Show, the Colbert Report and Wired all assisted. A PhD involves much more than just science, and I’ve had the ii.
(5) freedom over the past four years to meet a lot of cool people, read a lot, learn a lot, and develop my interests in all directions. Thanks to everyone who helped.. iii.
(6) Abstract Bubbles in water are stabilised against coalescence by the addition of salt. The white froth in seawater but not in freshwater is an example of salt-stabilised bubbles. A range of experiments have been carried out to investigate this simple phenomenon, which is not yet understood. The process of thin film drainage between two colliding bubbles relates to surface science fields including hydrodynamic flow, surface forces, and interfacial rheology. Bubble coalescence inhibition also stands alongside the better known Hofmeister series as an intriguing example of ion specificity: While some electrolytes inhibit coalescence at around 0.1M, others show no effect. The coalescence inhibition of any single electrolyte depends on the combination of cation and anion present, rather than on any single ion. The surfactant-free inhibition of bubble coalescence has been studied in several systems for the first time, including aqueous mixed electrolyte solutions; solutions of biologically relevant non-electrolytes urea and sugars; and electrolyte solutions in nonaqueous solvents methanol, formamide, propylene carbonate and dimethylsulfoxide. Complementary experimental approaches include studies of terminal rise velocities of single bubbles showing that the gas-solution interface is mobile; and measurement of thin film drainage in inhibiting and non-inhibiting electrolyte solution, using the microinterferometric thin film balance technique. The consolidation of these experimental approaches shows that inhibiting electrolytes act on the non-equilibrium dynamic processes of thin film drainage and rupture between bubble surfaces – and not via a change in surface forces, or by ion effects on solvent structure. In addition, inhibition is driven by osmotic effects related to solute concentration gradients, and ion charge is not important. A new model is presented for electrolyte inhibition of bubble coalescence via changes to surface rheology. It is suggested that thin film stabilisation over a lifetime of seconds, iv.
(7) is caused by damping of transient deformations of film surfaces on a sub-millisecond timescale. This reduction in surface deformability retards film drainage and delays film rupture. It is proposed that inhibiting electrolyte solutions show a dilational surface viscosity, which in turn is driven by interfacial concentration gradients. Inhibiting electrolytes have two ions that accumulate at the surface or two ions that are surfaceexcluded, while non-inhibiting electrolytes have more evenly distributed interfacial solute. Bubble coalescence is for the first time linked through this ion surface partitioning, to the ion specificity observed at biological interfaces and the wider realm of Hofmeister effects.. v.
(8) Publications Aspects of the work presented in this thesis have been, or will be, presented in the following journal articles. 1.. Henry, C. L.; Dalton, C. N.; Scruton, L.; Craig, V. S. J., Ion-specific coalescence. of bubbles in mixed electrolyte solutions. J. Phys. Chem. C 2007, 111, 1015-1023. 2.. Henry, C. L.; Craig, V. S. J., Ion-specific influence of electrolytes on bubble. coalescence in nonaqueous solvents. Langmuir 2008, 24, 7979-7985. 3.. Henry, C. L.; Parkinson, L.; Ralston, J. R.; Craig, V. S. J., A mobile gas-water. interface in electrolyte solutions. J. Phys. Chem. C 2008, 112, 15094-15097. 4.. Craig, V. S. J.; Henry, C. L., Specific ion effects at the air-water interface -. experimental studies. In Specific Ion Effects, Kunz, W., Ed. World Scientific Publishing: Submitted for publication. 5.. Henry, C. L.; Craig, V. S. J., Bubble coalescence inhibition by sugars and urea.. In Preparation. 6.. Henry, C. L.; Nguyen, P.; Karakashev, S. I.; Nguyen, A. V.; Craig, V. S. J.,. Electrolyte effects on lifetime, rupture and drainage kinetics of surfactant-free nonaqueous thin films. In Preparation. 7.. Henry, C. L.; Honig, C. D. F.; Ducker, W. A.; Craig, V. S. J., Cantilever-. dependent hydrodynamic forces in the AFM. In Preparation. 8.. Henry, C. L.; Craig, V. S. J., Specific ion effects in bubble coalescence:. Quantitative determination of and and the link to the Hofmeister series. In Preparation.. vi.
(9) Publications associated with earlier work are listed below: 9.. Henry, C. L.; Neto, C.; Evans, D. R.; Biggs, S.; Craig, V. S. J., The effect of. surfactant adsorption on liquid boundary slippage. Physica A 2004, 339, 60-65. 10.. Kourie, J. I.; Henry, C. L., Ion channel formation and membrane-linked. pathologies of misfolded hydrophobic proteins: The role of dangerous unchaperoned molecules. Clin. Exp. Pharmacol. P. 2002, 29, 741-753. 11.. Kourie, J. I.; Culverson, A. L.; Farrelly, P. V.; Henry, C. L.; Laohachai, K.N.,. Heterogeneous amyloid-formed ion channels as a common cytotoxic mechanism Implications for therapeutic strategies against amyloidosis. Cell Biochem. Biophys. 2002, 36, 191-207. 12.. Kourie, J.I.; Farrelly, P.V.; Henry, C. L., Channel activity of deamidated. isoforms of prion protein fragment 106-126 in planar lipid bilayers. J. Neurosci. Res. 2001, 66, 214-220. 13.. Kourie, J.I.; Henry, C. L.; Farrelly, P.V., Diversity of amyloid beta protein. fragment [1-40]-formed channels. Cell. Mol. Neurobiol. 2001, 21, 255-284. 14.. Kourie, J.I.; Hanna, E.A.; Henry, C. L., Properties and modulation of alpha. human atrial natriuretic peptide (alpha-hANP)-formed ion channels. Can. J. Physiol. Pharmacol. 2001, 79, 654-664. 15.. Kourie, J.I.; Henry, C. L., Protein aggregation and deposition: implications for. ion channel formation and membrane damage. Croat. Med. J. 2001, 42, 359-374.. vii.
(10) Contents. Preface...............................................................................................................................i Acknowledgements .........................................................................................................ii Abstract...........................................................................................................................iv Publications ....................................................................................................................vi Contents ........................................................................................................................viii Chapter 1. Bubble Coalescence and Electrolyte Inhibition ................................... 1. 1.1. Introduction....................................................................................................... 1. 1.2. Collision, Drainage and Rupture....................................................................... 3. 1.3. Bubble Coalescence in Electrolyte Solutions ................................................. 15. 1.4. Methods in Coalescence Inhibition................................................................. 22. 1.5. Hypotheses of Electrolyte Coalescence Inhibition ......................................... 31. 1.6. Summary ......................................................................................................... 38. 1.7. Thesis Outline ................................................................................................. 39. Chapter 2. Bubble Coalescence Inhibition in Mixed Electrolytes ....................... 41. 2.1. Preamble.......................................................................................................... 41. 2.2. Bubble Column Apparatus.............................................................................. 41. 2.3. Mixed Electrolyte Experiments ...................................................................... 46. 2.4. Conclusions..................................................................................................... 64. Chapter 3. Bubble Coalescence Inhibition by Sugars and Urea.......................... 66. 3.1. Introduction..................................................................................................... 66. 3.2. Osmolytes and Bubble Coalescence: Sucrose, Urea and Electrolytes........... 73. 3.3. Coalescence Inhibition in Sugars.................................................................... 82. Chapter 4. Bubble Coalescence Inhibition by Electrolytes in Nonaqueous. Solvents. ................................................................................................................. 95. 4.1. Introduction..................................................................................................... 95 viii.
(11) 4.2. Materials and Methods....................................................................................97. 4.3. Results .............................................................................................................98. 4.4. Discussion .....................................................................................................108. 4.5. Conclusions ...................................................................................................116. Chapter 5. Thin Film Drainage in Nonaqueous Electrolyte Solutions..............118. 5.1. Introduction ...................................................................................................118. 5.2. Materials and Methods..................................................................................121. 5.3. Results and Discussion..................................................................................125. 5.4. Conclusions ...................................................................................................144. Chapter 6. Surface Mobility of Bubbles in Electrolyte Solutions ......................145. 6.1. Introduction ...................................................................................................145. 6.2. Methods and Materials..................................................................................147. 6.3. Results ...........................................................................................................149. 6.4. Discussion .....................................................................................................150. 6.5. Conclusion ....................................................................................................153. Chapter 7. Electrolyte Coalescence Inhibition: A New Model...........................154. 7.1. Overview of findings ....................................................................................154. 7.2. Electrolyte Inhibition and Surface Partitioning.............................................158. 7.3. Ions at the Interface and Surface Rheology ..................................................166. 7.4. Surface Partitioning, Bubble Coalescence Inhibition and Hofmeister Effects ... .......................................................................................................................177. 7.5. Conclusions ...................................................................................................179. Chapter 8. Summary..............................................................................................182. References ....................................................................................................................186 Appendix. Surface Tension in Single Electrolytes ..............................................205. ix.
(12)
(13) Bubbles, Thin Films and Ion Specificity.
(14)
(15) Chapter 1. Bubble. Coalescence. and. Electrolyte. Inhibition. 1.1 INTRODUCTION The problem I set out to investigate in this thesis is readily observed. Take three flasks: one contains pure water; the second contains salty water (at such levels as might be found in the sea, or in blood); and the third contains water with a surfactant. Shaking each flask creates bubbles, and ceasing to shake allows one to observe the qualitative difference in bubble lifetimes. In pure water the bubbles coalesce with each other and with the liquid surface, and disappear almost immediately. A small amount of surfactant stabilises the bubbles and produces a froth or foam that may last for minutes, or even days. The effect of the salt is somewhere in between – bubbles are stabilised for several seconds before they merge with the liquid free surface. The mechanism behind this electrolyte inhibition of bubble coalescence is unknown. The aim of this project has been to elucidate the mechanism behind electrolyte inhibition of bubble coalescence.. 1.1.1. Applications. Many systems contain both salt and bubbles. Bubble coalescence is inhibited in seawater by the presence of electrolytes,1 and the resulting fine spray and extra surface area is important for oxygen dissolution and for mass transfer of ions to the atmosphere.2, 3 Froth flotation as used in mineral extraction requires an understanding of bubble coalescence,4 while some bioreactors rely on a bubble stream with a large interfacial surface area to diffuse oxygen.5 Bubbles in electrochemical cells can affect electrode performance.6, 7.
(16) 2. Bubble Coalescence and Electrolyte Inhibition. More generally, the drainage of a thin liquid film confined between two surfaces is a process at the heart of colloid and interface science. Examples of cases where film stability and drainage kinetics are important include emulsions, foams, biological systems, mineral flotation and capillary flow. Hence, the electrolyte stabilisation of the thin film between bubbles has parallels in other colloidal systems like emulsions, where electrolyte will also play a part.8 Importantly, bubble coalescence inhibition is found to display ion specific effects – the degree of inhibition depends on the identity of the cation and anion present, and cannot be predicted from valency or from the identity of a single ion.9, 10 The bubble system can thus act as both a model and a powerful and simple test of general theories of ion specificity. Specific ion effects are ubiquitous at high salt concentrations and fundamental to many biological processes,11 and in complex fluids12 and slurries13. Current explanations are largely empirical and system-specific.14 If the reasons for the ion specificity in bubble coalescence are determined, the implications may be wideranging.. 1.1.2. Chapter outline. The next section of this chapter (Section 1.2) describes theories of bubble coalescence via thin film drainage and rupture, as applied to surfactant systems. Surfactant thin films are well-studied and generally have formed the basis for existing theories of film stabilisation and rupture. The theories are applied to predict thin film stability in pure liquids, surfactants and electrolyte solutions. In section 1.3 a review of literature on bubble coalescence inhibition in electrolyte solutions is presented. I summarise the early research into the phenomenon, and the importance of the finding of ion specificity and ion combining rules. Section 1.4 contains a summary of experimental techniques to investigate the gassolution system, and I also consider the relevance of related systems including electrolyte films on solid surfaces and in emulsions..
(17) Bubble Coalescence and Electrolyte Inhibition. 3. In section 1.5, a range of hypotheses about electrolyte bubble coalescence inhibition are described. Some of these form the basis of the experiments described in this thesis, while others can be dismissed on the basis of previous work. I have investigated a range of hypotheses touching upon interfacial forces, surface deformation, solvent structure, drainage dynamics, and surface mobility. The focus in this chapter is on theories and hypotheses from before the commencement of this project. More recent findings and results from this thesis are consolidated in the general discussion in Chapter 7.. 1.2 COLLISION, DRAINAGE AND RUPTURE Bubble coalescence is the joining together of two bubbles in a fluid, to form one larger bubble. As it involves the reduction of surface area, coalescence is always an overall energetically-favoured process.15 However coalescence can be inhibited kinetically or in the presence of a local energy minimum.16, 17 Coalescence can be described as a threestep process: bubble approach and creation of a thin film; film drainage; and film rupture.18 Coalescence is inhibited when the steps are not completed over the lifetime of a collision. The processes are of course interrelated: film drainage hydrodynamics are affected by collision velocity, and rupture occurs only when the film has drained to within a certain critical thickness. Each step is here discussed separately. This section briefly lays out models of film drainage and film rupture that have been applied successfully to pure liquid films and to surfactant-stabilised thin films.. 1.2.1. Collision. The rate at which two bubbles approach (as well as the angle of approach, and the bubble size) will affect whether they coalesce during a collision lifetime.19 Ribeiro and Mewes have shown that whether a collision results in bouncing or coalescence is determined by the relative rate of approach, with coalescence occurring only below a critical approach velocity.20 This velocity is related to the interface deformability, and is affected by surfactant or electrolyte additives as well as by bubble size. The question may arise whether turbulence in a bubble flow can affect coalescence and thin film.
(18) 4. Bubble Coalescence and Electrolyte Inhibition. drainage. Lee and Hodgson note that in inviscid water, the smallest turbulent eddies are on the order of 25m,21 and thus flow in the much smaller-scale thin film is laminar. However turbulence will affect bubble collision incidence and velocity, as well as more complex formation and break-up processes, in some bubble column and stirred vessel experiments.22. RB. H R. Figure 1.1. A planar thin film of mean thickness H, with radius R, is formed between two approaching spherical bubbles with radius RB approaching through a fluid. The film drainage at values of H > 100nm is driven by capillary pressure.. 1.2.2. Hydrodynamic drainage. Thin film drainage at large separations is driven by hydrodynamic pressure. The bubbles deform from sphericity under hydrodynamic pressure, and the thin film can be treated as planar.23 For a circular planar film, the drainage pressure between the film and the bulk is given by:24. P . 2RB RB2 R 2 . (1.1). This is a version of the Young-Laplace equation for the pressure within a flattened bubble, where is surface tension, RB is the radius of the bubble contributing to pressure.
(19) Bubble Coalescence and Electrolyte Inhibition. 5. outside the thin film, and R is the radius of the planar film (see Figure 1.1). This capillary pressure creates a laminar flow from the thin film interior to the surrounding fluid.25 This purely pressure-driven flow slows rapidly as the volume of the thin film decreases.26 In pure liquids the film generally thins below the critical rupture thickness very rapidly: no pure liquid has been observed to support a stable film.27 During initial bubble deformation, a “dimple” may be created in the film (Figure 1.2). The hydrodynamic pressure in the film is largest at closest bubble separations, and this can drive the central film region to invert.28 At large separations the rims around the dimple will subsequently thin more slowly and the film will eventually flatten. However the dimple can persist if the rim forms a barrier to drainage.23 Dimpling occurs more readily in larger bubbles with lower Laplace pressure and greater interfacial deformability.. Figure 1.2 Dimpling and flattening process during thin film drainage between two spherical bubbles.. 1.2.2.1. Hydrodynamic drainage in the presence of surfactant. Capillary flow can be retarded when another component is present in solution. Surface adsorption changes the interfacial flow at the gas-liquid surface. As liquid is carried away from the centre of a planar film during drainage, any surfactant at the interface is transported towards the edges of the film (see Figure 1.3). The Gibbs adsorption.
(20) 6. Bubble Coalescence and Electrolyte Inhibition. isotherm describes how the surface tension is related to the surface excess . For a single component system,. . c d kT dc. (1.2). where c is concentration, d/dc is the change in surface tension as a function of concentration, k is Boltzmann’s constant and T is temperature. A local variation in surface excess across the surface of the film drives a local variation in surface tension.17 The consequent restoring force against non-equilibrium surface concentration gradients is known as the Marangoni effect, and acts to retard film drainage.. Figure 1.3 The Marangoni effect in surfactant. Film drainage reduces surface concentration in the film centre and sets up a non-equilibrium surface tension gradient that restores surfactant and opposes hydrodynamic film drainage. At some concentrations the interfaces can be immobilised. The surface tension gradient is restored, in the case of surfactants, predominantly by surface diffusion.23 The interfacial flux towards the film centre opposes film drainage and can effectively immobilize the fluid layer at the interface (Figure 1.4). In the presence of immobile, planar interfaces the film thinning velocity is given by the wellknown Reynolds equation:17. VRe. 2 H 3 P 3R 2. (1.3).
(21) Bubble Coalescence and Electrolyte Inhibition. 7. where VRe is Reynolds velocity of film thinning, H is film thickness, P is the driving pressure (which is purely capillary pressure at H > 100nm), is liquid viscosity and R is film radius. In water the gas-water interface is fully mobile, as it cannot support a shear stress without the presence of a third component; surface mobility is required to correctly model drainage in pure liquids.27. A. B. Figure 1.4 Capillary flow between mobile (A) and immobilised (B) bubble surfaces. Surface immobilisation in the presence of surfactant reduces thin film flow and slows film drainage.. 1.2.3. Surface forces and film drainage. As a thin film drains, the surfaces begin to interact and the system can no longer be treated as purely hydrodynamic.29 Surface forces is the term used to refer to the distantdependent interactions between macroscopic interfaces across a fluid, derived from the sum of intermolecular forces. The forces are generally assumed to be at equilibrium, and independent of any dynamic interactions in the system.30 The surface forces between two like surfaces are generally repulsive; formation of a stable liquid film in surfactant (a foam) can occur when at a given film thickness attractive hydrodynamic and surface forces are balanced by the repulsive components of the force.31 The sum of surface forces across a thin film is also known as the “disjoining pressure”, . In this case the disjoining pressure is the positive (or negative) external pressure required to equalise the repulsive (or attractive) interaction between the film surfaces, and stabilise the thin film. (For a review of disjoining pressure in foams, the reader is.
(22) 8. Bubble Coalescence and Electrolyte Inhibition. directed to Bergeron.16). The disjoining pressure can be described as the sum of. components that are (variously) distance-dependent.32 In general,. (h) vdW edl steric .... (1.4). where (h) signifies the disjoining pressure dependence on local film thickness h and the subscripts are defined: vdW is the van der Waals interaction; edl is the electrical double layer force; and steric refers to structural forces associated with the solvent and adsorbed molecules and may include surface solvation. There may also be other contributions such as the hydrophobic force (discussed below, in Section 1.5.1.3, in the context of electrolyte solutions).33 1.2.3.1. van der Waals interactions. van der Waals interactions arise from the totality of molecular interactions between interfaces across the thin film (excluding the electrostatic component). The major contribution to disjoining pressure is the dispersion force, arising from interaction between instantaneous molecular multipoles.30 The dispersion force between two like surfaces interacting across a thin film is always attractive, and the attraction can become significant at surface separations of 100nm and less.25 van der Waals interaction is distance dependent, with a first approximation of the disjoining pressure given by:30. vdW . A 6h 3. (1.5). where A is the Hamaker constant for the air-liquid-air system and h is the local film thickness, as distinct from the mean film thickness H. This local interaction means that for a non-planar film the surface attraction may be non-uniform across the film surface. For the air-water-air system A has a value of approximately 3.7x10⁻²⁰ J.30 At larger separations the retardation effects can become important and vdW scales with 1/h4. Retardation is due to the finite time required for a dipole to be induced through a thin film, which increases with distance.30 van der Waals effects are discussed in more detail in Section 1.2.4 below, in the context of their contribution to film rupture. 1.2.3.2. Double layer repulsion. A charged surface attracts counterions from solution, and these counterions attract a second, more diffuse layer enhanced in co-ions. This is the electric double layer,.
(23) Bubble Coalescence and Electrolyte Inhibition. 9. distinguished from the bulk solution. The electric double layers at like surfaces will have a like charge and their overlap exerts an osmotic repulsion between the interfaces, because the excess concentration of counterions is entropically unfavourable.30 The distance into solution at which the electrostatic double layer repulsion can still exert an effect is dependent upon the concentration of ions. In weak solutions the ions are diffuse and the double layer will be large; in strong electrolyte the double layer is compressed and the surfaces are “screened” from each other.34 The characteristic length of influence is known as the Debye length, D-1. It is determined by the Poisson-Boltzmann theory, and for a univalent electrolyte is given by:35, 36. D1 . kT c 1 2 2 0 8e n. (1.6). Here is the solvent permittivity, k is Boltzmann’s constant, T is the temperature, e is proton charge, n0 is the number density of ions in bulk and c is ion concentration. The Debye length in a 10-5M solution of ionic surfactant is around 100nm, while in a 0.1M salt solution the Debye length is <1nm. 1.2.3.3. Steric interactions. Interfacial repulsion can arise due to steric confinement effects at very small surface separations. The solvation force arising from confinement and layering of solvent molecules, is observed only within 5nm of the surface. Confinement of surfactant molecules on each film surface can stabilize very thin “Newton black” films even when nearly all solvent has been squeezed from the film, as observed in some foam systems.32 Another repulsion may arise due to “undulations” or thermomechanical fluctuations of deformable interfaces.37 This force, known as the Helfrich force, effectively expands the range of interaction of some bilayers and membrane films and it can be long-range, with a 1/h3 distance dependence.30 1.2.3.4. DLVO theory. The steric interaction between surfaces becomes apparent only at very small surface separations (5nm or less), and so for thicker films only the van der Waals and electrostatic double layer forces are important.16 These two components of the.
(24) 10. Bubble Coalescence and Electrolyte Inhibition. disjoining pressure together are described by DLVO theory. DLVO theory was developed by Derjaguin and Landau, and Verwey and Overbeek, in the 1940s.35, 36 It is a powerful tool of colloid science for predicting surface interactions. The basis of DLVO theory is that surface interaction can be modeled by summing van der Waals attraction and electrostatic repulsion (obtained from Poisson-Boltzmann equations). DLVO theory works very well to model forces in the circumstances for which it was designed – that is, dilute solutions of symmetrical electrolyte and low surface potentials.38 Fundamental assumptions within the theory are that the solvent can be treated as a continuum characterized by a dielectric constant, and that ions can be treated as point charges. It also assumes that van der Waals and electric double layer forces can be treated as independent and additive – though later work showed that this is not strictly correct.39 DLVO theory begins to break down at concentrations greater than 10-3M as ion size and solvent structure become important. 40. 1.2.4. Film rupture. Rupture occurs rapidly and dynamically, and it is consequently difficult to observe and to characterize. In fact the exact process of rupture, even in pure liquids, is unknown.41 The mechanism in surfactant foam films is usually considered to be rupture via a growth of capillary waves at each interface.42 It is supposed that deformations at each film surface can come into contact across a thin film of much greater mean thickness, and that rupture at one such contact point leads to very rapid coalescence and formation of a larger bubble.15, 43 This model requires that the film be treated as non-uniform in thickness. There are observed fluctuations in film thickness because of mechanical disturbances, the movement of fluid and the shear stresses (See Figure 1.5).31 There are, in addition, small thermal fluctuations due to the movement of molecules at the interface; these are generally on the order of 5Å in amplitude.44 At large separations the film thinning is dominated by the capillary pressure, which is largely independent of film thickness. If fluctuations arise in the film at that stage, thick.
(25) 11. Bubble Coalescence and Electrolyte Inhibition. areas will tend to drain more quickly and the planar condition will be restored.23 When the surfaces approach within about 100nm, surface attraction arising from van der Waals dispersion force (described above) becomes important. This attraction scales with 1/h3 where h is the local film thickness (see equation (1.5)), and increases with smaller surface separation. In a non-uniform film, the van der Waals attraction is greater in those parts of the film that are thinner. Under this force the hydrodynamic waves will continue to grow in amplitude until a critical mean film thickness H is reached. At this point the thermal fluctuations at the narrowest parts of the film (those with smallest local film thickness, h) can produce osculation (literally, “kissing”) of the two interfaces, and film rupture. The amplitude of fluctuations grows with the radius of the thin film, and in large films with immobile interfaces it can be around 25nm, and lead to a critical mean film thickness H (at which rupture is possible) of 50nm.44 Rupture will be favoured when capillary waves are minimally damped and have had time to grow in size.45 The theory assumes that electrostatic repulsion is highly screened and that there is no effect due to non-DLVO disjoining force components. It is also assumed that surfaces are immobile. These conditions are met experimentally in the presence of surfactant with screening electrolyte, and here the theories for film drainage velocity and rupture thickness would seem to agree well with observations.31,. 42. It is. noted that the time of wave growth is on the order of tens to hundreds of seconds on immobile surfaces. At mobile film surfaces, as found in surfactant-free liquid, surface waves grow rapidly. Ruckenstein and Jain give the theoretical lower bound for rupture time by surface wave growth in pure liquid to be on the order of microseconds.46 Hole nucleation is an alternative model of film rupture.47 Such a mechanism has been observed in polymer and supported surfactant films.48 While it has been suggested that film thicknesses on the order of 25Å would be required for hole formation, Lee and Hodgson conclude that at a rapid rate of approach the precise local film thickness is unimportant.21 Hole formation is predicted to occur only between surfaces separated by a few nanometres or less, and so will require a similar local approach of surfaces to the thermal wave osculation mechanism described above.43.
(26) 12. Bubble Coalescence and Electrolyte Inhibition. Hydrodynamic wave. Osculation. Thermal wave. Mean film thickness, H. Figure 1.5 Surface fluctuation model of film rupture between two bubbles. A large wavelength hydrodynamic wave grows via van der Waals forces, and at a thin point thermal fluctuations of each interface meet and osculate, causing rupture across a film of mean thickness H. Diagram based on work by Sharma and Ruckenstein.44. 1.2.5. Coalescence in pure liquid. In pure water no stable film is formed and coalescence takes only a few milliseconds.27, 49, 50. The film surfaces are mobile and capillary drainage to within the critical rupture. thickness is not impeded.51 The rupture thickness in pure liquid is difficult to measure because it is hard to avoid contamination and because the film ruptures quickly, but films have been observed to rupture at around 100nm bulk bubble separation.52, 53 The timescale of thin film drainage is very short and theories modeling drainage in pure water are subject to various constraining assumptions (for a helpful summary see Ribeiro and Mewes54). Thus, the complete process of bubble coalescence in pure liquid remains obscure.. 1.2.6. Coalescence inhibition in surfactant. Surfactants stabilise bubbles against coalescence, leading to foam lifetimes from seconds to days.17 Surfactants, as the name implies, adsorb to the interface, and from this property derive many of their effects. Some of the ways in which added surfactant affects the thin film relative to pure liquid are:.
(27) Bubble Coalescence and Electrolyte Inhibition. . 13. Surface tension. The direct effect of surface tension reduction is to reduce the capillary pressure driving thin film drainage, as shown by equation (1.1).. . Immobilisation of the interface via Marangoni effects driven by surface tension gradients across the film surface (arising from concentration gradients). Although much attention has been paid to this factor in development of drainage velocity models (see for example Marrucci25), Ivanov and co-workers suggest that surface immobilisation is often unimportant in controlling rupture and coalescence.23 In particular, at high surfactant concentrations, surface diffusion is rapid and mobility may again increase.55. . The deformation of the film surface during drainage leads to increased interfacial elasticity. Gibbs Elasticity of an interface, E, is a measure of the response of the interface to mechanical disturbance. It is proportional to the square of surface tension gradient, (d/dc)2:56 4cd / dc (1.7) kTD Here c is concentration, (d/dc) is the change in surface tension with E. 2. concentration, k is Boltzmann’s constant, T is temperature and D is a measure of interfacial thickness related to the shearing of the interface.56 Increased surface elasticity acts to damp the growth of capillary waves.55 This in turn will reduce the rupture probability over the timescale of a collision. Changes in surface elasticity in electrolyte solution are discussed further in Chapter 2. . The surfactant will affect disjoining pressure. In ionic surfactants or with added electrolyte, the presence of ions in solution and the change in surface potential with surfactant adsorption will alter the electrical double layer and induce repulsion largely absent in pure liquids.55. . Steric effects. A short-range repulsive interaction between surfactant layers at opposite interfaces may stabilise a very thin Newton black film when much of the solvent has been drained.16, 17. In summary, the effect of surfactant is to reduce the rate of film drainage and increase the repulsive disjoining pressure across the thin film. Surfactants can also produce a.
(28) 14. Bubble Coalescence and Electrolyte Inhibition. film that is stable to lower thicknesses, due to repulsive electrostatic forces or to steric effects.17. 1.2.7. Coalescence in electrolyte solution - according to theory. One can take the models of thin film stabilisation, drainage and rupture derived from the case of surfactant, and predict the stability of thin films between bubbles in surfactantfree electrolyte solution. Of course the models do not predict experimental data, because had they done so then this project would have been exceedingly brief and devoid of interest – but this is a useful exercise to highlight the anomalies associated with bubble coalescence inhibition by electrolytes. . The electrolyte effect on surface tension is too small to affect capillary drainage substantially. The relevant concentration range of electrolyte is approximately 0.01-0.5M. The surface tension of pure water is 72.75mN m-1 at 20°C,57 and electrolytes tend to change surface tension by <3 mN m-1 M-1.58-60 Therefore the relative change of surface tension at the relevant concentrations of electrolyte is ≤2%. This change can be positive or negative – many electrolytes increase the surface tension relative to pure liquid, which would if anything drive more rapid capillary drainage (see equation (1.1)).. . The surface tension gradient across the thin film, which creates Marangoni effects in the presence of surfactant, is very small in electrolyte solution. Because of high ion concentrations (rapid equilibration) and low dependence of surface tension on concentration, it is predicted that the surface tension gradient is too low to stabilise the thin film via interface immobilisation.60 The same arguments apply with respect to the surface tension gradient with film deformation, which drives Gibbs elasticity in surfactant films and so damps film deformation and prevents rupture.. . Electrostatic repulsion is not predicted to stabilise thin films in these electrolyte solutions. At a typical inhibiting concentration of 0.1M 1:1 electrolyte, the.
(29) Bubble Coalescence and Electrolyte Inhibition. 15. Debye length of the electric double layer is on the order of 1nm (see equation (1.6), while thin films rupture at 50-100nm.18,. 53. The bubble interfaces are. effectively screened from each other and are expected to experience no repulsive disjoining pressure during drainage. The models that adequately predict surfactant film stabilisation, via surface forces from repulsive electric double layer and steric interactions and dynamic effects related to surface tension gradients at the film surfaces, predict no such stability in electrolyte solutions. Rather, a rapid coalescence of bubbles might be expected, as observed in pure liquid. However, it has been known for decades that some electrolytes at sufficiently high concentration, do inhibit bubble coalescence relative to pure water.61-63 A review of the literature on this phenomenon is presented in the next section.. 1.3 BUBBLE COALESCENCE IN ELECTROLYTE SOLUTIONS 1.3.1. An example of electrolyte inhibition. Before a review of the different studies of electrolyte bubble coalescence inhibition, it is as well to demonstrate the phenomenon. An example of typical bubble coalescence inhibition by electrolyte is given in Figure 1.6. This particular data is based on laser scattering turbidity measurements of bubbles in a bubble column (see Chapter 2 for a full description), and is consistent with a range of other experimental techniques. The percentage coalescence scale used on the y-axis was first developed by Lessard and Zieminski in their work on two-bubble collisions, where the percentage refers to the tallied number of collisions resulting in coalescence.63 In bulk measurements the percentage coalescence is obtained by setting the pure water measurement as 100% coalescence, and the stable low coalescence value obtained in inhibiting salts as 0% coalescence.9 The NaCl data shown are typical of a monovalent inhibiting salt. At a concentration of around 0.01M coalescence inhibition begins, and coalescence reduces over a narrow concentration range before reaching a constant low value, defined as 0% coalescence. The concentration required is high relative to surfactant effects: electrolytes generally show inhibition at 10-2M and above,9, 63, 64 while surfactant may require as little as 10-6M.65.
(30) 16. Bubble Coalescence and Electrolyte Inhibition. Electrolytes may be compared using the transition concentration (or critical concentration), which is defined as the concentration at which coalescence is 50% of the maximum. For the sodium chloride data shown here, transition concentration is 0.093M. This concentration depends on bubble size66 and interaction time67 and so is not completely uniform across all systems and experimental techniques; however within a given technique the transition concentration provides a useful comparison between electrolytes.. Percentage Coalescence. 100. 50. 0 0.001. 0.01 0.1 Electrolyte concentration (M). 1. Figure 1.6 Effect of NaCl on bubble coalescence in water. Percentage coalescence (where 100% is value in pure water and 0% is a stable low value of coalescence) is plotted against the log of concentration. Transition concentration, measured at 50% coalescence, is 0.093M.. 1.3.2 1.3.2.1. Historical studies of bubbles in electrolytes Early experimental studies on bubble coalescence in electrolytes. The earliest work on the topic of bubble stabilisation in salt solutions is a series of papers by Foulk (with Miller, in one case).61, 68, 69 In his 1924 article, Foulk deplores the poor state of the science of foams. He further states that sodium salts are known to cause foaming, but cannot find the original reference for this widely-held view – and.
(31) Bubble Coalescence and Electrolyte Inhibition. 17. neither can I. Foulk’s experiments in boiling sodium salt solutions indicate no foaming, but this is possibly due either to the temperature conditions, or to the definition of “foaming” requiring a white froth, rather than the transient stabilisation of bubbles commonly observed in electrolyte solution.68 Foulk and Miller in their 1931 paper (which I strongly recommend) have covered a lot of the ground concerning bubble stabilisation in electrolytes: bubble column experiments (using measurement of froth height to indicate degree of coalescence inhibition); two-bubble experiments in which thin film lifetime is measured; a range of electrolytes that includes non-inhibiting salts; electrolyte mixtures; and measurements of surface tension and dynamic surface tension.69 They even consider coalescence in the nonelectrolyte sucrose – on which little further had been done before my experiments (see Chapter 3). Foulk and Miller attribute thin film stabilisation to surface adsorption of solute, which might be positive or negative (corresponding to decreased or increased surface tension, respectively, as per Gibbs adsorption isotherm (equation (1.2) above)). It was suggested that such variation in solute concentration leads to osmotic resistance against mixing of surface layers such is required at coalescence. The 1960s and 1970s brought the next major forays into the study of bubbles in coalescence inhibition. Marrucci and Nicodemo measured gas hold-up and bubble size in a bubble column, in a range of inhibiting electrolytes.62 They also report the importance of varying surface tension gradient, and were the first to note a correlation of bubble size (related to coalescence inhibition) and the square of surface tension gradient, (d/dc)2. This correlation is still considered important, and is still unexplained. Chapter 2 describes experiments to investigate it further. Lessard and Zieminski obtained results consistent with Marrucci using two-bubble experiments, and defined percentage coalescence as the number of bubble pairs (on twin capillaries) that coalesce at a given concentration.63 The transition concentration is defined as that at which 50% coalescence occurs. An inverse correlation between transition concentration and ionic strength of electrolyte was also noted – that is, electrolytes of higher ionic strength require a lower concentration to elicit coalescence inhibition.63, 70 Other workers also studied two-bubble coalescence29, 71 and bubble column measurements,71 although these.
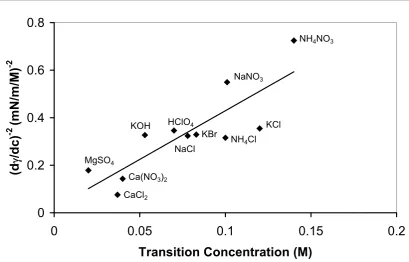
(32) 18. Bubble Coalescence and Electrolyte Inhibition. investigations tended to concentrate on the same handful of known inhibiting electrolytes. Cain and Lee used the technique of thin film interferometry to measure the film thickness between two bubbles in KCl at varying concentrations as a function of time, in order to determine film drainage kinetics and rupture thickness.18 This is the first attempt to quantitatively study these film properties in the absence of surfactant. This study also provided early proof that deformation of the bubble interfaces was in fact leading to formation of a planar thin film. No stable film was observed at low electrolyte concentrations. In 0.5M KCl the film thickness at rupture was from 7595nm, with drainage lifetime of 420ms, while the film thickness in 1.0M KCl was 5575nm (with a lifetime of 600ms). It was shown that neither Reynolds drainage (which assumes planar immobile interfaces, see equation (1.3)) nor the Radoev model72 (which allows diffusional relaxation and partial surface mobility) correctly predicted the film thinning rate.18 This study was important in showing that electrostatic repulsion does not drive bubble coalescence inhibition, as the Debye length of ≤1nm is much less than the film rupture thickness. The disagreement with Reynolds drainage also showed that planar immobile interfaces are a poor model for the thin liquid film between bubbles. This posed a challenge for the dominant theory of bubble coalescence inhibition of the time. 1.3.2.2. Early theory of bubble coalescence inhibition: Marangoni effects. The dominant model in the literature up until at least 1990 was that electrolytes exert their effect by changing the thin film drainage of solution from the viscous to the elastic regime – that is, the electrolyte surface tension gradient was believed to immobilise the gas-liquid interface at sufficiently high concentration via Marangoni effects.25 This theory had the advantage of covering electrolytes that increase and decrease the surface tension of solution – the surface tension gradient can be positive or negative, so long as it exists.69 It is well accepted that if a solute is surface active and adsorbed to the interface, Marangoni effects can reduce surface mobility.21, 25 Stretching of the film surface during.
(33) Bubble Coalescence and Electrolyte Inhibition. 19. drainage lowers the surfactant concentration at the centre of the film and raises its surface tension, leading to restoring surface flow in opposition to film drainage. It is perhaps less clear that there will be such a Marangoni effect during drainage of films containing electrolytes that are depleted from the interface. Lee and co-workers showed that there is indeed an increase in surface tension in the film centre even if the solute raises the surface tension relative to pure liquid.21, 73 As the film thins, surface flow of depleted layers means that local electrolyte concentration increases in the thin film, causing a non-equilibrium increase in surface tension relative to the surrounding surface.18 This (small) increase will oppose film drainage, and so can potentially stabilise the film. The change in surface tension in electrolyte solutions is inversely related to film thickness.60, 73 Marrucci produced a model of film drainage as driven by capillary drainage between mobile interfaces, that were immobilised at the electrolyte transition concentration leading to quasi-equilibrium thinning under van der Waals attraction.25 This theory leads to the relationship: ct (d/dc)-2.74 That is, transition concentration is inversely correlated with the square of surface tension gradient for inhibiting electrolytes, as observed in experiments.29,. 62. A great many variations on empirical formulae were. produced to enable prediction of the transition concentration, depending on the precise assumptions employed.29,. 71, 74. It was always acknowledged that some inhibiting. electrolytes (particularly KCl) failed to agree with predictions. The Marrucci model and its variations were really challenged, though, by the existence of non-inhibiting electrolytes.. 1.3.3. Bimodal ion specificity in bubble coalescence inhibition. A resurgence of interest in bubble coalescence inhibition by electrolytes can be said to have begun with the work of Craig et al. in 1993,9, 10 along with the measurements of Hofmeier et al.2 Coalescence inhibition was measured in a bubble column for a range of electrolytes. Notably, it was found that some electrolytes show no effect on coalescence inhibition relative to pure water, up to a concentration of 0.5M. These electrolytes were defined as “non-inhibiting”..
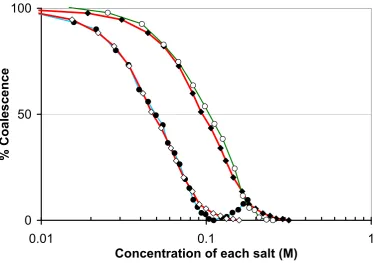
(34) 20. Bubble Coalescence and Electrolyte Inhibition. The observation that some electrolytes fail to inhibit bubble coalescence in water, at moderate concentrations, was reported several decades ago by Foulk and Miller.69 However Craig et al. were the first to rigorously probe the ion specific nature of the phenomenon. They showed that the combination of cation and anion is important, and grouped cations and anions each into two categories, with and cations and and anions having different effects with a given counterion.9, 10 The and designations are purely empirical, and need not have the same physical meaning in cations and anions. The ion assignments are presented in Table 1.1. No exceptions have been found to the rules here presented. Table 1.1 and ion assignments of single electrolytes in watera Ions. Li+ Na+ K+. Assignment -. OH FClBrINO3SO42(COO2)2IO3ClO3ClO4-. . CH3COO SCN- a. . . . . . . Cs+ Mg2+ Ca2+. . . . . . NH4+ H+ (CH3)NH3+ (CH3)2NH2+ (CH3)3NH+ (CH3)4N+. . . . . . . . . . . . . . . . . . . =inhibit coalescence = =no inhibition = . . . Based on Craig et al.9 with additional results.. An example of the importance of ion combination is given in Figure 1.7. At concentrations below 0.5M, sodium chloride substantially inhibits bubble coalesce relative to pure water, while sodium perchlorate has no effect. Conversely, in this concentration range hydrochloric acid does not affect coalescence but perchloric acid acts as a strong inhibitor. It is neither the cation nor the anion alone that determines coalescence inhibition, but the combination that is important..
(35) 21. Bubble Coalescence and Electrolyte Inhibition. There are two meanings of “ion specificity” that have relevance in bubble coalescence. The first is simply the general definition, referring to any difference of behaviour in salts containing different ions of the same charge. This would include, for example, variations in transition concentrations and surface tensions amongst inhibiting electrolytes. The second type of ion specificity is that described by the and assignments, grouping electrolytes into two groups of “inhibiting” and “non-inhibiting” based on their effect on bubble coalescence. Where the meaning is unclear this ion specificity will be described as “bimodal ion specificity” because it groups the. Percentage Coalescence. electrolytes into two categories.. 100. 50. 0 0.001. 0.01 0.1 Electrolyte concentration (M). 1. Figure 1.7 Ion specificity and combining rules in electrolyte bubble coalescence inhibition. Coalescence is plotted as a function of electrolyte concentration on a log scale. Electrolytes NaCl () () and HClO4 () () inhibit at 0.1M, while their ‘cross-products’ NaClO4 () () and HCl () () have no effect up to 0.5M concentration. 100% coalescence is defined in pure water, 0% is a stable low value in inhibiting electrolytes..
(36) 22. Bubble Coalescence and Electrolyte Inhibition. 1.4 METHODS IN COALESCENCE INHIBITION Before going on to discuss hypotheses to explain ion specificity in electrolyte inhibition of bubble coalescence in Section 1.5, I will here describe some of the experimental techniques that have been used to garner information about the phenomenon. The results of the studies are remarkably consistent, whether using multiple bubbles in columns or stirred vessels, two bubbles approaching on side-by-side or facing capillaries, or a single thin film. The same patterns of ion specificity and concentration dependence are observed in each case. This suggests that the bubble coalescence inhibition phenomenon is an example of a universal effect at gas-solution interfaces. The limits of this universality are considered in a comparison of two related systems: the liquid-liquid system of emulsions in salt solution, and the stability of a thin liquid film on a solid surface.. 1.4.1 1.4.1.1. Experimental techniques in bubble coalescence inhibition Two-bubble experiments. Two-bubble experiments are the most direct way of observing electrolyte effects on coalescence, as they are minimally affected by formation and break-up contributions to bubble stability. These experiments involve observing the interaction between two bubbles produced on adjacent capillaries. The capillaries may be side by side as in Figure 1.8,29,. 63,. 64,. 66. or facing so that the bubbles encounter each other. “head-on”.18, 67, 69 Foulk and Miller coined the term “two-bubble experiments”,69 while Lessard and Zieminski defined the transition concentration at 50% coalescing pairs.63 In general the head-on encounters enable greater control over the pressure used and the thin film lifetime.75 However at large surface approach velocities for trapped bubbles the behaviour can be anomalous – for instance, Tse et al. observed no rapid coalescence even at high concentrations of inhibiting electrolyte MgSO4 when large bubbles were rapidly pushed together, though inhibition did occur at slower surface approach rates.67 Bubbles at parallel capillaries better mimic collision lifetimes and flow conditions in a multiple bubble system..
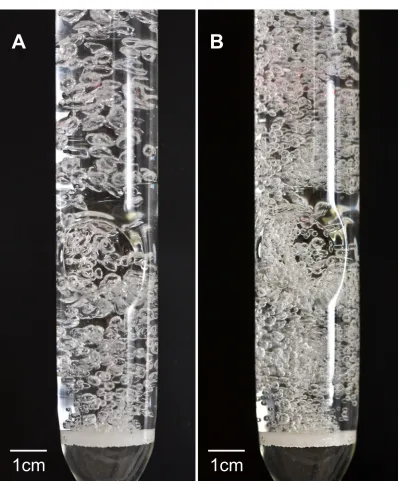
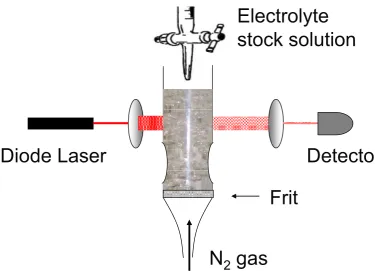
(37) Bubble Coalescence and Electrolyte Inhibition. 23. A variation of the two-bubble experiments is measurement of the coalescence time of a small bubble with a free gas-solution surface, which can be thought of as a bubble of infinite radius. Under such conditions bubble bouncing against the interface can sometimes be observed.51, 76, 77 Inhibiting electrolyte increases bubble lifetime against the free surface.78, 79. A. B. Figure 1.8 Two-bubble experiment. Bubbles are produced at two neighbouring capillaries, with outcomes (A) non-coalescence and (B) coalescence. One of the inherent problems in two-bubble experiments is the possibility of contamination whenever a stagnant liquid is used and there is minimal fresh interface created – as with two small bubbles with moderate lifetime. Any surface active material typically controls drainage and rupture behaviour as the effect is much stronger than electrolyte film stabilisation.63 Cleaning is thus more important in these experiments than in bubble column or stirrer experiments where freshly created interface will take some time to accumulate contaminant in a purified solution. 1.4.1.2. Bubble column experiments. I used a bubble column for many of the investigations performed in this thesis. A more detailed description of this particular apparatus is given in Chapter 2, below. There is generally a sparger or frit at the base of the column releasing gas into a solution through capillary pores. The bubbles then rise through the column under their own buoyancy and the effect of turbulence induced by the bubbly flow..
(38) 24. Bubble Coalescence and Electrolyte Inhibition. A. B. 1cm. 1cm. Figure 1.9 Bubble column used in coalescence inhibition experiments. Bubbles in (A) pure water and (B) 0.3M NaCl. Nitrogen flow is 12mL s-1. The flattened part of the column disrupts laminar flow and promotes coalescence. The red near the top of the column in each photo is due to laser scattering; transmitted laser light provides a measure of turbidity and hence bubble coalescence. Hofmeier et al. showed that bubble size in columns is influenced not only by collisions during rise, but by the coalescence that can occur during bubble formation at neighbouring pores in the frit.2 The outcome of any particular collision will depend on a.
(39) 25. Bubble Coalescence and Electrolyte Inhibition. range of factors including velocity and angle of approach,19,. 20. and bubble size:66. Coalescence in multi-bubble or turbulent systems is a stochastic phenomenon. There are several ways to analyse bubble column data. Bubble size, and hence coalescence, can be determined using visual analysis of bubbles in static images or high speed video.62 This method is very accurate and can provide information about the kinetics of bubble coalescence. However analysis is very time-consuming, and a large amount of data must be collected to observe coalescence events.49 Our group uses laser scattering to measure solution turbidity across the diameter of the column (see Figure 1.9).9,. 58. Scattering is greater in the presence of more, smaller bubbles. This method. provides an average across a large number of bubble collisions and sizes, and enables one rapidly to collect a large amount of data in a range of solution conditions. Foulk and Miller in early experiments, measured foam height above the liquid as an indicator of froth formation.69 However, the foam stability is expected to be influenced by liquid viscosity and density as well as coalescence inhibition. The column height at which bubbles of a certain size (indicative of coalescence) is observed, is the chosen analysis method of Deschenes et al.80 This method may be more sensitive to very small changes in coalescence inhibition, but it is limited by the size of the column used. It is also possible to measure gas hold-up at various heights in the column.71 Gas hold-up, , is the proportion of gas volume in total volume:22. . V VL V. (1.8). where V is volume of mixture in the column (gas + liquid) and VL is liquid volume. Gas hold-up tends to increase with smaller bubbles and so may increase with added electrolyte; however it is also strongly influenced by sparger design and gas velocity.71, 81. 1.4.1.3. Stirred vessel experiments. This group of experiments is closely related to the work in bubble columns, because multiple bubbles are produced at a porous plate. They have been distinguished in part because of historical circumstance – the work in bubble stirrers or beds was concerned with bubble size distribution and with gas hold-up because of the industrial applications,.
(40) 26. Bubble Coalescence and Electrolyte Inhibition. and these measures were rarely referenced by the theoreticians and fundamental researchers studying bubble coalescence as a phenomenon; and in part because of the use of baffles or stirrers to further impose turbulence on the bubble stream and so encourage break-up of bubbles.82 In turbulent bubble flow, bubble size is influenced by formation, coalescence and breakup phenomena, and it may be hard to differentiate the effects, if any, of electrolyte at each of these stages.1 Nevertheless there is general consensus that the action of electrolyte in such system is predominantly on coalescence.22, 83 Machon et al., among others, also find that electrolyte lowers the incidence of bubble breakup.22 Later Tse et al.49 developed a hypothesis based on highspeed video images to attribute very small bubbles seen in pure water as “daughters” of coalescence events. The incidence of such bubbles is reduced on addition of salt. This is attributed in part to decrease in coalescence and in part to a qualitatively observed increase in bubble wall rigidity, and lessening of annular capillary waves that cut off the daughter bubble. 1.4.1.4. Thin film interferometry. In thin film interferometry experiments, a free-standing thin liquid film is formed, and its thinning is recorded using CCD video. Reflective interference fringes are obtained in white light, as shown in Figure 1.10. Interferometry is used to quantitatively measure the thickness of the film, and analysis of results yields the film drainage kinetics as well as the rupture thickness.84 This technique has long been used to study surfactantstabilised films.32, 84, 85 However to date few studies have been carried out in surfactantfree electrolyte solution. The exposed film surface is highly susceptible to contamination, and without coalescence inhibition the thin film lifetime is too short, and the rupture thickness too high, for the method to be yield useful data. However at sufficient concentrations of inhibiting electrolyte, and in noncontaminated solutions, the interferometric method can yield valuable data about the mechanics of bubble coalescence and inhibition. I used a thin-film technique to study films in nonaqueous electrolyte solutions, and this method is therefore described in greater detail in Chapter 5..
(41) Bubble Coalescence and Electrolyte Inhibition. 27. Cain and Lee produced an early study using two captive bubbles on the ends of capillaries in KCl solutions, and pushing them together, measuring the change in film thickness with time using interferometry.18 Recently Karakashev et al. have used microinterferometry to measure film lifetime and rupture thickness in aqueous inhibiting and non-inhibiting electrolytes over a range of concentrations.86 The results show more stable films in inhibiting electrolytes, consistent with the results from bulk bubble coalescence.. Figure 1.10 Reflective interference fringes in a thin liquid film in air. This film shows increased thickness in the centre, indicative of a “dimple” during drainage. Beyond the boundaries of the film the liquid interfaces are curved rather than planar, and no interference pattern is seen. This is one frame of a 30 frames-per-second recording of film drainage. 1.4.1.5. Atomic force microscopy. The use of atomic force microscopy (AFM) for force measurement at deformable surfaces is a recent development.87 The technique can now be used to measure interaction between a bubble attached to the AFM cantilever tip, and another attached to a substrate.88 In general the longer bubble lifetimes required for transfer of a bubble of suitable size to an AFM cantilever tip, and consistent force measurements, have limited the technique’s usefulness to surfactant-stabilised bubbles. Manor et al. have recently measured interactions in surfactant-free 1mM electrolyte (too low to exhibit coalescence.
(42) 28. Bubble Coalescence and Electrolyte Inhibition. inhibition effects) and found dynamics equivalent to a partially mobile gas-water interface, that they attribute to some low-level surfactant contamination.89 However, this technique holds promise for future measurements in surfactant-free and high electrolyte systems.. 1.4.2. Electrolyte thin films at solid and liquid surfaces. The gas-solution system of bubble coalescence is only one example of thin film formation in electrolyte solution. Other systems that contain surfactant-free electrolyte solutions may also exhibit ion specificity and thin film stabilisation, and it has been suggested that the study of such systems might be of use in bubble coalescence inhibition.41 I here briefly summarise experiments in surfactant-free emulsions (liquidliquid systems) featuring aqueous electrolyte as the continuous or the droplet phase, and thin films at solid surfaces (solid-liquid-gas systems). The solid-liquid-solid system in colloidal suspensions is another example of a solution thin film. However, no evidence of stabilisation of colloidal solids at high salt has been found. Rather, salt increase leads to increased attraction and coalescence in accordance with a decrease in electrostatic repulsion.30 Therefore this system is not considered in any detail. 1.4.2.1. Surfactant-free emulsions. Some oil droplets may be stabilised in some very low electrolyte systems. Even in pure water, hydroxyl ions can adsorb at the oil-water interface, producing negatively-charged surfaces and an electrostatic barrier to coalescence of emulsion droplets.90 (The same mechanism is believed to account for the negative potential of the gas-water interface, although this is a somewhat controversial topic.91) Relatively few studies have been carried out in surfactant-free emulsions sufficiently high in salt to compare with bubble coalescence results. Oil droplets may be stabilised or destabilised by high electrolyte concentrations. Neumann et al. show convincingly that a surfactant-free monodisperse emulsion of poly(dimethylsiloxane) (PDMS) coalesces over two days in 0.1M NaCl solution but not at lower concentrations, suggesting an electrostatic repulsion that is screened at sufficiently high salt.92 0.1M NaCl was also found to lower the turbidity of squalane-.
(43) Bubble Coalescence and Electrolyte Inhibition. 29. water mixtures – that is, salt reduced the initial formation of oil droplets from a bulk oil phase.93 The authors attribute this to lower electrostatic repulsion at the interface, which makes droplet detachment less likely. In contrast to these results, Nandi et al. report that a 5% NaCl solution (~0.9M) in the presence of glycerol stabilises oil-in-water emulsions against coalescence, but has no effect for the inverted water-in-oil system. This is attributed to a surface tension gradient in electrolyte thin films, and is consistent with results of bubble coalescence inhibition.94 An inhibiting effect at high salt concentrations is confirmed by Stevens et al. in the case of polar organic liquids but not nonpolar hydrocarbons.95 They observed an increase in coalescence time (inhibition of coalescence) with increasing electrolyte from 10-4M to 1.0M, which is a larger concentration range than the bubble coalescence effects. Only bubble coalescence-inhibiting (-type) electrolytes were used in this study. Chen et al. considered the inverse system of dispersed aqueous droplets in an oil continuous phase.96 Aqueous electrolyte droplets coalesce more rapidly with increasing electrolyte concentration for the most part, although at 10-1M there may be an increased droplet lifetime. There was no correlation with the electrolyte ionic strength, and the electrolyte effect varied depending on the polarity of the oil phase.96 As Stevens et al. found, the electrolyte effect in surfactant-free emulsions is dependent on the nature of the dispersed hydrophobic phase.95 Neumann et al. also saw some lowsalt stabilisation of PDMS but not of other oils,92 while Clasohm et al. observed different stability of hydrocarbon and fluorocarbon droplets using the AFM, in the presence of 0.1M NaNO3.97 The results of surfactant-free emulsion studies do in some cases correlate with bubble coalescence measurements. In particular, Stevens et al.95 and Nandi et al.94 both report the possibility of stabilisation of oil droplets in water at high salt concentrations. However in many surfactant-free emulsions, electrolyte effects follow standard DLVO theory with electrostatic repulsion observed at larger Debye lengths (lower electrolyte.
(44) 30. Bubble Coalescence and Electrolyte Inhibition. concentration). Therefore the coalescence inhibition is affected by the properties of the organic phase and the nature of the liquid-liquid interface. There is currently little information on ion specificity in oil-water systems, and so while the electrolyte inhibition mechanism may be related to that in bubble coalescence, the liquid-liquid system is not for the moment considered any further. 1.4.2.2. Thin aqueous films between a solid and a gas. As with the surfactant-free emulsion system described above, few studies of thin films on solid surfaces exist that use electrolytes at sufficiently high concentration to compare with bubble coalescence experiments. It has been found that surface hydrophobicity is an important determinant of water film stability on solids, even in cases of equal surface potential.98,. 99. Pure water100 and. electrolyte solution99 films are stable on a hydrophilic substrate. The equilibrium film thickness decreases with increased ionic strength and screening of the electric double layer, in accordance with DLVO theory.101 Films that are stable in pure water and at all electrolyte concentrations do not provide a good analogy for the bubble coalescence system, which features the rupture of thin films between air-water surfaces. The air-water surface is highly hydrophobic102 and so comparison with hydrophobic solids may be more productive. A pure water film between two hydrophobic surfaces or between a hydrophobic surface and a bubble is not stable and will rupture at sufficiently low thickness. Yoon and Yordan observe rupture on hydrophobic surfaces at around 200nm,100 but other authors observe thinner films (down to tens of nanometres) even in non-wetting, low salt conditions.98,. 99. At. hydrophobic methylated silica surfaces Blake and Kitchener find the film thickness to decrease with increasing electrolyte in accordance with DLVO theory, and at high electrolyte (~ 10-1M) no stable film can be formed.98 Diakova et al. changed the surface treatment of silicon carbide and showed that at hydrophobic surfaces films with >0.01M electrolyte are unstable, while at hydrophilic surfaces wetting films are produced even at 1M salt.99 These results are in direct contrast to the increased film stability seen at high concentrations in bubble systems.10 In addition, no difference is observed between.
(45) Bubble Coalescence and Electrolyte Inhibition. 31. the films in KCl, KOH and HCl on methylated silica, suggesting that ion specificity does not play a role in this case.98 It can be concluded that the available studies of surfactant-free electrolyte thin films at solid interfaces are not comparable to the system of bubbles in electrolyte solution. Thin film stabilisation occurs at low electrolyte concentrations, and film thickness is consistent with DLVO theory. Increased electrolyte destabilises films on hydrophobic surfaces, and the nature of the solid surface seems to control film properties to a far greater extent than the added electrolyte. Hence, no further study of films at solid surfaces is made in this thesis.. 1.5 HYPOTHESES OF ELECTROLYTE COALESCENCE INHIBITION Any proposed mechanism for bubble coalescence inhibition should describe why some electrolytes inhibit coalescence at ~0.1M, while others have no effect – and why ion specificity depends upon the combination of ions.9,. 10. This section describes and. evaluates some of the hypotheses that have been put forward concerning bubble coalescence inhibition. The reader is asked to bear in mind that some of the models and ideas are very much tied up with the work presented in this thesis, and these mechanisms are discussed in greater detail in the relevant experimental chapters and in the general discussion in Chapter 7.. 1.5.1. Disjoining pressure and electrolyte bubble coalescence inhibition. Electrolytes may change the equilibrium surface forces present in the thin film between bubbles by enhancing a repulsive component of the disjoining pressure, or by removing an attraction between surfaces that exists in pure water. 1.5.1.1. Electric double layer repulsion. At the concentrations of electrolyte at which coalescence is observed, the Debye length is on the order of one nanometre and electrostatic repulsion is therefore highly screened.9 Miklavcic has proposed that increased coalescence inhibition in high salt can be explained by an increased double layer repulsion at higher salt concentrations, based.
Figure


+7


Related documents
Silicon, an indirect band gap semicon- ductor, has a low absorption coefficient for light, necessitating the use of fairly thick wafers (~180 microns today) to absorb a large portion
Wang, Yu-Cheng, "Dual 7-Degree-of-Freedom Robotic Arm Remote Teleoperation Using Haptic Devices" (2015).
Calving Ease and Perinatal Mortality in Holstein Cattle. Analysis of body measurements of newborn purebred Belgian Blue calves. Komisarek J, Michalak A, Walendowska A. The effects
Noise complaint data collected from the Philadelphia, PA region during the period from 1997 to 2009 was compared to five indicators (per-capita income, median household income,
The entire subject matter is systematically arranged in the chapters like: Introduction, Scales, Linear Measurements of Distances , Chain Surveying and Ranging, Cross
In summary, colorectal cancers detected by CTC in an FOBt screening program were significantly smaller, more subtle, and of earlier radiological stage than symptomatic tu- mours..
It does so in three ways: firstly, in arguing that Company servants operated autonomous of the ‘centre’ at East India House by revealing the dichotomy between the
Además de la clásica enfermedad de Pott y de las lesiones articulares, este trabajo también describe otro tipo de lesiones menos frecuentes, entre ellas indicadores no
