This is a repository copy of A scoping review to identify the techniques frequently used
when analysing qualitative visual data.
White Rose Research Online URL for this paper: http://eprints.whiterose.ac.uk/91757/
Version: Accepted Version
Article:
Smith, SK, Mountain, GA and Hawkins, RJ (2015) A scoping review to identify the
techniques frequently used when analysing qualitative visual data. International Journal of Social Research Methodology, 19 (6). pp. 693-715. ISSN 1364-5579
https://doi.org/10.1080/13645579.2015.1087141
© 2015 Informa UK Limited, trading as Taylor & Francis Group. This is an Accepted Manuscript of an article published by Taylor & Francis in International Journal of Social Research Methodology on 30 September 2015, available
online:http://dx.doi.org/10.1080/13645579.2015.1087141
eprints@whiterose.ac.uk https://eprints.whiterose.ac.uk/ Reuse
Unless indicated otherwise, fulltext items are protected by copyright with all rights reserved. The copyright exception in section 29 of the Copyright, Designs and Patents Act 1988 allows the making of a single copy solely for the purpose of non-commercial research or private study within the limits of fair dealing. The publisher or other rights-holder may allow further reproduction and re-use of this version - refer to the White Rose Research Online record for this item. Where records identify the publisher as the copyright holder, users can verify any specific terms of use on the publisher’s website.
Takedown
If you consider content in White Rose Research Online to be in breach of UK law, please notify us by
A scoping review to identify the techniques frequently used when analysing
1
qualitative visual data
2
3
4
Challenges were encountered when attempting to analyse video based data during a project 5
exploring touch screen computer technology with people living with dementia. In order to 6
inform the analytic process, a scoping review of published evidence was undertaken. Results 7
of the scope illustrated the use of various techniques when analysing visual data, the most 8
common of which was the transcription of video into text and analysed using conversation 9
analysis. Three additional issues emerged in the course of the review. First, there is an 10
absence of detail when describing the ethical implications involved when utilising visual 11
methods in research. Second, limited priority is given to providing a clear rationale for 12
utilising visual methods when audio or field notes may have been a viable alternative. Third, 13
only 40% of reviewed articles clearly stated a chosen methodology. The conclusions of the
14
review illustrate a lack of consistency across studies in the overall reporting of research 15
methods and recommend that authors be explicit in their reporting of methodological issues 16
across the research process. 17
18
19
KEYWORDS: Visual methods, data analysis, video recording, qualitative research
20
Introduction
22
Research is following societal trends in the use of the visual in numerous aspects of life,
23
made possible through technological advances. The rapidly increasing use of information
24
and communication technology (ICT) in particular, as well as digital technologies, has
25
brought to the fore the use of the visual in the ways we communicate as a society and with
26
one another. Web 2.0 technologies have provided us with a platform to network socially
27
using Facebook, Twitter, blogs and wikis. In addition to changing the ways we socially
28
interact, technologies have now altered the ways we visually interact using video
29
conferencing style applications that include Skype and Face- Time. In addition to social
30
interaction, video conferencing also enables us to communicate in healthcare, business and
31
educational settings.
32
33
This heightened awareness of the possibilit , specifically in academia, may
34
be explained by various contributing factors which include: the increased access we have to
35
reasonably priced technologies that enable such methods to be utilised; the desire of
36
contemporary social researchers to develop innovative and creative ways to disseminate
37
new knowledge; the differing ways that we as researchers and participants may use
38
technologies to express ourselves using photo-elicitation for example; the dependable
39
reputation of science regarding the ways social phenomena may be visually portrayed to the
40
public; and the varying ways research data is now collected, analysed and disseminated in
41
academia which has been accompanied by the advent of contemporary digital technologies.
The continuing rise in technological development coupled with an ongoing interest in visual
43
research methods is apparent in various academic disciplines including education, social
44
work, nursing, geography, information sciences, sociology, linguistics and health research.
45
These developments have extended the range of techniques available to researchers for the
46
capture, analysis and reporting of visual data, thus opening up new possibilities for research
47
and practice. The interest in the use of visual media in research has been expressed in a
48
comprehensive range of academic publications such as Video in Qualitative Research 49
(Heath, Hindmarsh, & Luff, 2010), Visual Research Methods (Margolis & Pauwels, 2011),
50
Visual Methodologies (Rose, 2012) and Advances in Visual Methodologies (Pink, 2012).
51
There is an expanse of information within each text styles of visual
52
methods to developments in methodology and comprehensive accounts of original studies.
53
Some argue that visual research is not defined by methodological or theoretical traditions
54
but rather enables researchers to utilise that which is visual, visible and therefore
55
observable (Emmison, Smith, & Mayall, 2012). Nevertheless, existing texts contribute to an
56
ongoing debate within visual research between the need for cross discipline methodological 57
frameworks, discipline specific frameworks or unique methodological frameworks, 58
developed specifically for certain projects.
59
60
Cross discipline frameworks
61
Image-based research methodologies reflect the use of a wide range of visuals including film,
62
video, photographs and cartoons, within a qualitative research context. Image-based
63
research meant to apply generically to encompass a wide range of fields including 64
sociology, anthropology, education and health studies (Prosser, 1998 p. 25). Proponents of
a cross discipline unified framework support the need for a common visual methodology in
66
order to create a critical platform to debate and refine visual methods, ultimately enhancing
67
the status of image based research. Jon Prosser provides a discussion on the specific
68
elements that constitute a visual methodolog
69
70
(Prosser, 1996). These elements make up a framework aimed to direct
71
and inform image based research irrespective of the discipline within which it is utilised.
72
73
Discipline specific frameworks
74
Strengthening the debate for an integrated framework to enable clarity and decrease
75
disparity within image based research I F V
76
“ ‘ (Pauwels, 2010). This framework provides a comprehensive step by step
77
progression to account for the design, implementation and dissemination of visual research.
78
Pauwels advocates an image based research methodologypromoting
79
80
manifestations: behaviour of pe (2010 p.546). The
81
framework
82
Although remaining focused on image based research,
83
this framework is discipline specific to visual sociology and not intended to be applicable
84
across disciplines. Pauwels claims that discipline specific frameworks are required to
85
address discipline specific research questions and he argues that without them visual
86
methods can
87
(2010 p.546), within the discipline of visual sociology. Other disciplines thus require their
own frameworks that are specific to the research questions being posed as existing
89
frameworks will not translate sufficiently across to disciplines outside visual sociology.
90
91
Unique methodological frameworks
92
In contrast, others argue that visual research methodologies proposing problematically
93
prescriptive frameworks merely succeed in distancing, objectifying and generalising visual
94
data (Pink, 2001). This is then considered to come at the expense of the potential
95
expressivity that is characterised by qualitative research and specifically qualitative visual
96
research. T that provides a
97
step by step account for collecting, analysing and disseminating visual research using
98
existing methodological frameworks, specific methods should be creatively developed
99
within individual projects (Pink 2001 p.4). Developing unique project specific methodological
100
frameworks have undoubtedly been cause for critique regarding the lack of potential to
101
direct and inform image based research in general (Prosser, 1996) resulting in issues of
102
validity that questions methodological depth (Pauwels, 2010).
103
104
So, despite an increasing de , researchers in this field, as in other fields,
105
remain disparate in their descriptions of what may constitute a valid methodological
106
approach in the collection, analysis and reporting of visual data. There is considerable
107
diversity in existing approaches that suggest a visual methodology that may transcend
108
disciplines, may be discipline specific or that treats each visual methodology as unique and
109
discrete from the other. However, no single methodological approach claims to be the only
way to undertake visual research; rather this disparity in approaches is concerned with the
111
appropriateness of accumulating knowledge across the social sciences, within a specific
112
discipline or within a particular project. It could be argued that each approach will have
113
strengths and weaknesses dependent upon discipline, research questions and the paradigm
114
within which the researcher is working. Therefore decisions need to be made regarding the
115
suitability of using existing frameworks or developing novel frameworks for visual data that
116
are unique to each project. Paradoxically, such decisions need to be informed by existing
117
evidence and research projects that have already taken place. It was this particular
118
challenge that was encountered when embarking on the qualitative analysis of the
119
researchers own visual data. This subsequently led to a review of the literature in order to
120
explore similar methods of data analysis used successfully by researchers in the past.
121
122
The Scoping Review
123
Scoping reviews are a style of literature review that delivers an overview of the type, extent
124
and quantity of research available on a given topic. Scoping reviews are commonly applied
125
to broader topic areas where the evidence may be distributed across a range of disciplines,
126
databases and study designs providing the extent of evidence for a topic at a particular
127
point in time. For the purposes of this review, the author has drawn on the methodological
128
framework Y F (A O M . The process
129
describes a combination of 5 stages; identifying the research question, identifying relevant
130
studies, study selection, charting the data, collating, summarizing and reporting the results.
131
By exploring the existing literature, conclusions can be reached regarding the current extent,
132
breadth and quality of research activity and subsequent evidence. The primary goal of this
scoping review was to determine the various techniques utilised during the analysis of
134
qualitative visual data. As indicated above, the scoping review is appropriate in this case
135
because the topic is broad, spans many disciplines and involves various research designs
136
enabling the large extent of evidence to be mapped effectively. Although this scoping
137
review does not follow the quality assessment that is required for systematic reviews (Booth,
138
Carroll, Ilott, Low, & Cooper, 2013; Centre for Reviews and Dissemination, 2009), a checklist
139
for assessing the quality of qualitative studies (Kmet, Lee, & Cook, 2004 p.5) was referred to,
140
elements of which were drawn from during the review. However, additional elements were
141
included that were considered essential in enabling the author to critically comment on the
142
quality of each article as part of this particular reviewing process. These were: ethical
143
considerations; rationale for using visual methods; and a clear statement of methodology.
144
This was important as different reviews will prioritise different information depending on
145
the topic under review. Alongside the author and article title, information was recorded as
146
follows: -
147
148
1. Methodology 149
2. Rationale for visual methods 150
3. Study design & questions 151
4. Ethics of visual research 152
5. Data collection methods 153
6. Data analysis technique 154
7. General findings 155
Search Method 157
As already indicated, the whole point of scoping the field is to be as comprehensive as possible in 158
identifying primary studies suitable for answering the central research question A O M 159
2005) what techniques have been previously used by social sciences researchers when
160
analysing qualitative visual data To achieve this, a strategy was adopted that involved searching 161
for research evidence via different sources including electronic databases, reference lists, hand-162
searching of key journals, existing networks, relevant organisations and conferences (Arksey & 163
O M . Whilst the search was broad, it should be acknowledged that practical constraints 164
including time and on-line access to journals may have resulted in potentially relevant articles being 165
overlooked. Literature searching took place between 7th and 14th October 2013 and included 166
articles from all disciplines, all countries and all available years. The only limitation made on 167
the search was that articles should be published in English. 168
169
Search terms
170
The search terms used were: visual methods, data analysis, video recording, and qualitative 171
research. NOT drawings, sketches, cartoons, data collection, audio, quantitative, review
172
article. 173
174
Search Outcome
175
A diagram of the search yield can be found in Figure 1. The search terms were well defined
176
at the outset of the review, nevertheless a large quantity of irrelevant studies were
177
identified (n=1,845). This large number highlights a particular characteristic of scoping
studies that illustrates breadth rather than depth. The inclusion criteria based on the nature
179
of the research question were concentrated on qualitative visual data analysis techniques.
180
The initial yield was therefore sifted and articles excluded if the title and abstract did not
181
A O M . The search
182
identified 53 articles based on title and abstracts that were considered potentially relevant.
183
All 53 articles were read in full and a further 24 were excluded for the following reasons.
184
185
Discussion papers were excluded (for example Erickson, 2011; Mason, 2005) as the content
186
focused on experiences and understandings of visual methods rather than techniques to
187
analyse visual data (n=7). It was considered that increased understandings of what had
188
taken place before could be better gained from articles reporting primary research data that
189
would encompass the data collection and analytic techniques utilised, a greater knowledge
190
of which was the primary aim of the scoping review. Review papers (for example Prosser &
191
Loxley, 2008) were excluded as they were not specific to analytical techniques and beyond
192
the remit of this review (n=5). Similarly to the discussion papers, articles that were
193
focussed purely on methods were excluded (for example Schnettler & Raab, 2008) as
194
authors were not describing primary research thus no focus on analytical technique (n=11).
195
The methods papers that were excluded focused on the history of visual methods and how
196
methods have evolved, generally due to the digital era, rather than specific techniques to
197
collect, analyse and disseminate visual data. Finally, one article was specific to the ethical
198
considerations involved when using visual methods but excluded as no primary data was
199
described for review (n=1).
200
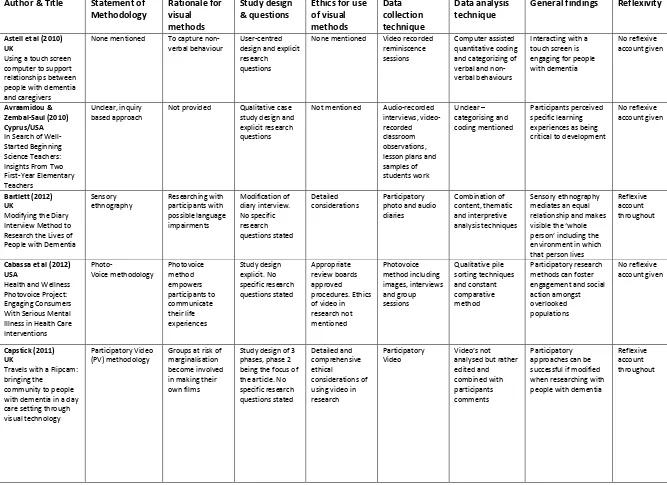
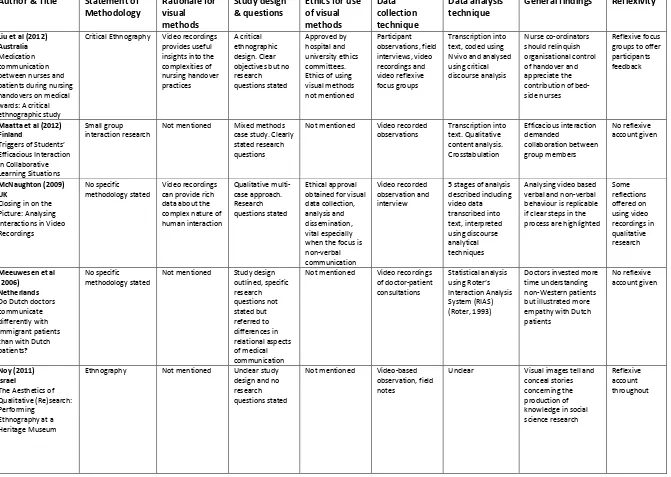
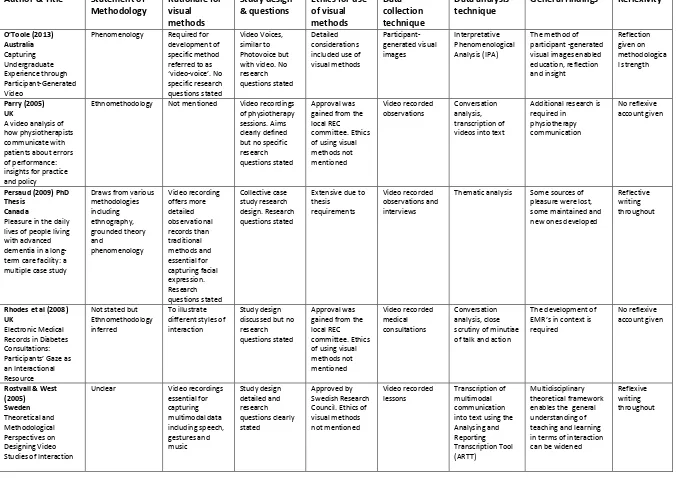
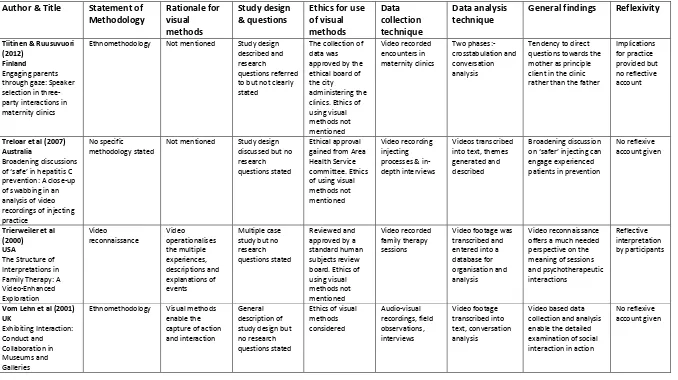
After exclusions had been applied, 29 articles were identified for full review. All reviewed
202
articles were classified by the analytic technique employed in the study design. The
203
information in Table 1 illustrates the reviewed articles which were charted to include
204
specific information regarding methodological techniques in combination with more general
205
information about the study as described above.
206
207
(Insert Figure 1 about here)
208
(Insert Table 1 about here)
209
Results
211
All 29 reviewed articles described a study design although 20 omitted to state research
212
questions. However, of this 20, 7 did report specific aims and objectives of the research (for
213
example, Galman, 2009; Liu, Manias, & Gerdtz, 2012). All 29 articles reported specific
214
techniques for data collection and general findings. Of these 29 papers, 22 went on to
215
discuss clear data analysis techniques. The remaining 7 articles alluded to certain techniques
216
without mentioning anything specific including coding, categorising or themes (Avraamidou
217
& Zembal-Saul, 2010; Häggman-Laitila, Pietilä, Friis, & Vehviläinen-Julkunen, 2003; Hurdley,
218
2007) or they omitted to discuss any analytical processes (Capstick, 2011; Cook, 2003; Noy,
219
2011; Trierweiler, Nagata, & Banks, 2000). Of the 22 articles that described a specific
220
analytic technique, the most common method used was conversation analysis (5) which
221
requires the close scrutiny of the minutiae of talk and action to be transcribed into text and
222
analysed. A clear example is provided by Tiitinen & Ruusuvuori (2012) who undertook an
223
Ethnomethodology of three-party interactions in maternity clinics using conversation
224
analysis to analyse collated video data. Findings indicated that the professional had a
225
tendency to direct questions towards the mother as principal client rather than the father. A
226
further two articles utilised qualitative content analysis as one method of analysing their
227
data. For example, Maatta, Jarvenoja, & Jarvela (2012) transcribed video footage of
228
collaborative learning situations into text. Using content analysis, codes were identified and
229
three triggers were categorised as influencing the efficacy of student activity.
230
231
Of the 29 articles included in the review, 11 discussed the ethical issues involved with the
232
use of visual methods in detail. For example, Capstick (2011) explored the ethical
233
considerations of adapting a Participatory Video approach to enhance usability with people
with dementia living in a residential care setting. The author provides clear reflections
235
concerning the ethical decisions and rationale involved when utilising visual methods as well
236
as considering how existing methods should be modified when researching with different
237
groups. A further 11 articles used a standard sentence that appears to be the accepted
238
norm in academic research papers, for example ethical approval was gained from the local 239
or something similar. The remaining 7 articles omitted to
240
mention ethical concerns regarding the use of visual research methods.
241
242
A related issue when designing research, considering the ethical implications of visual
243
methods including confidentiality and anonymity for example, is to defend the use of the
244
- Of the 29
245
articles included in this review, 21 gave a clear explanation of why video recordings appear
246
to supersede alternative data collection methods (for example, Bartlett, 2011; Cabassa et al.,
247
2013; Capstick, 2011; Galman, 2009; Hostgaard and Bertelsen, 2012). Of these 21 articles,
248
eight involved a population that may be considered vulnerable which heightens the
249
importance of stating a clear rationale for using visual methods. Of the remaining eight
250
articles that omitted to provide a clear rationale for the use of visual methods, three articles
251
involved sensitive topics or participants under the age of 18 (Chivanon, Wacharasin,
252
Homchampa & Phuphaibul, 2011; Parry, 2005; Treloar et al., 2008) which highlights the
253
under-reporting of methods in general found in this review.
254
255
Of the 29 studies reviewed, 12 clearly stated a chosen methodology. For example, two
256
studies utilised a methodology referred to as Photovoice (Cabassa et al., 2013; Drew et al.,
257
2010). The methodology behind Photovoice is focussed on participatory methods, providing
certain groups, who may either be marginalised or disadvantaged in society, with a voice in
259
a research context. A further 10 articles were unclear but alluded to or inferred certain
260
methodologies including Phenomenology or Ethnomethodology. The remaining seven
261
articles omitted to state a specific methodology highlighting an under-description of
262
methods overall in this review. The inclusion of reflexive accounts in study reporting were
263
provided by 15 authors, 10 of which could be considered to be researching sensitive topics
264
with populations considered as vulnerable (for example, Capstick, 2011; Drew et al., 2010;
265
Häggman-Laitila et al., 2003).
266
267
Of the 29 articles reviewed, only one comprehensively described the 8 point checklist for
268
assessing the quality of qualitative studies (Kmet et al 2004) that was referred to and
269
extended upon during this review process. This comprehensive account was given in a PhD
270
thesis (Persaud, 2009) which realistically allowed the time and word count for such detail.
271
Of the remaining 28 articles, 7 only omitted one criteria from the checklist, the most
272
common being the statement of research questions. For example, Bartlett (2012) carried
273
out a Sensory Ethnography using participatory photos and audio diaries to research the lives
274
of people with dementia. Equal importance was given to the methods for data collection
275
and analysis as well as a clear methodology and detailed ethical considerations concerning
276
the use of visual methods in research. In addition, Mcnaughton (2009) focused purely on
277
analysing interactions in video recordings by providing a detailed step by step process for
278
data analysis. This enabled clarity and transparency for the reader but equally the detailed
279
focus on data analysis did not detract from the importance of discussing the chosen
280
methodology and the ethical considerations of the research. Finally, O'Toole (2013) sought
281
to capture the experience of undergraduates using Participant-Generated Video. The
methods of data collection and analysis were clear and given equal weighting in the article.
283
The rationale for the chosen methodology was explained appropriately. There was excellent
284
reflection on the ethics of human participation using visual methods taken from the
285
perspective of the undergraduates as participants. Of the remaining 21 articles included in
286
this scoping review, 8 omitted to include 4 or more criteria from the checklist (for example,
287
Avraamidou & Zembal-Saul, 2010; Chivanon, Wacharasin, Homchampa, & Phuphaibul,
288
2011).
289
290
Discussion
291
This scoping review primarily sought to explore the range of analytical techniques utilised by
292
researchers who have used visual methodologies in their research. Aside from the
293
comprehensive texts discussed in the introduction, published articles that report primary
294
research including working with images, and the process of collecting, analysing and
295
describing results were limited. Those that were available and included in this review
296
illustrated inconsistencies in the reporting of visual research methods. It is clear that
297
differences in editorial practices and journal restrictions concerning the inclusion of lengthy
298
methods sections as well as constricted word counts will limit the reporting of
299
methodological detail. It should therefore be acknowledged that this review was not
300
intended as a critique of current research practice but rather the restrictions in place that
301
have resulted in the under reporting of important methodological issues based on visual
302
data. Although journals will vary in their acceptance of included detail in an article, it should
303
also be recognised that the under reporting of methods is a generic challenge, particularly in
304
qualitative research and not specific to the reporting of visual methods. Nevertheless, as
this review is focused on qualitative visual methods it should be acknowledged that the
306
results of the search yield were a product of the specific journals included in the scope.
307
308
The topic for review became the focus when attempting to analyse the authors own
309
qualitative visual data and the challenge of gaining increased understanding regarding how
310
to successfully achieve this. Overall, 29 articles were included and an eight point checklist
311
for assessing the quality of qualitative studies (Kmet, Lee, & Cook, 2004) was referred to and
312
elaborated upon for the purpose of this review. The challenge of under reported methods
313
can be clearly illustrated in the findings from this review as only one of the articles met the
314
complete 8 point checklist and unsurprisingly this was a PhD thesis that enabled such depth
315
and detail to be fully reported. All 29 articles described a study design although over two
316
thirds of reviewed articles omitted to state any research questions. Furthermore, all 29
317
articles reported specific data collection techniques and general findings yet only 16 went
318
on to report a specific technique used to analyse the visual data.
319
320
Data analysis techniques 321
In addition to the under reporting of visual methods, the difficulties encountered when
322
analysing visual data may be one of the reasons for its limited use (Prosser, 1998). The
323
results of this review have highlighted limited evidence focusing directly with the techniques
324
“ analysis, by definition, is a
325
contextual issue, so general prescriptions on how to organise or process data are of limited 326
(Gibson,Webb, & vom Lehn, 2011, p208). In addition to the lack of specific techniques,
there was limited and vague detail concerning the practicalities and processes involved
328
when analysing visual data. Nevertheless, some authors have aligned themselves with
329
particular techniques, the most popular being conversation analysis (n=5/29) which is
330
closely aligned with Ethnomethodology. Ethnomethodology and conversation analysis
331
332
conversation through features including pauses, intonations, eye gaze, objects, gesture.
333
These segments are transcribed verbatim and the resulting text is analysed thematically
334
then broken down to the minutiae of speech, pause etc. Using sequences of still images
335
aligned with text illustrates how the verbal and non-verbal are united. Researchers using
336
these techniques
337
extracting meaning from the written words (Rose 2000). The qualitative analysis of video
338
data from an ethnomethodological tradition has been primarily influence by academics
339
including Heath, Hindmarsh and Luff, (2010) as well as Knoblauch & Schnettler (2012). 340
341
However, the advent of video recorders as a data collection technique has successfully
342
shifted the emphasis from purely text based analysis to include the complexity of all that is
343
non-verbal as well as what may be going on contextually. Thus non-verbal behaviours
344
including eye gaze, posture and gesture can be equally meaningful when aligned with verbal
345
behaviour that has been transcribed into text. Nevertheless, all the reviewed articles that
346
did define a specific technique for analysing visual data, described a process of transcribing
347
the visual into text based transcripts. Of course, not all visual researchers will use their data
348
once the analysis stage has passed and many will not require it to be disseminated. Yet,
349
given the complex ethical considerations required and the time intensive nature of
analysing visual data this may question the appropriateness of using such methods over
351
field notes or audio recordings if the visual output is ultimately to be transformed into text?
352
Visual data can be powerful when disseminated to the right audiences as it can provide
353
potential of
354
it.
355
356
Of the 29 studies reviewed, nearly half (13) omitted to mention data analysis or were
357
elusive regarding how they came by the study results. From this, it would appear that some
358
researchers are creating their own uni data analysis which might
359
be expected given the unique and individual nature of qualitative visual data. Some
360
techniques have been developed for specific projects, some have been adapted from
361
existing methods, but all are asking different kinds of questions. It could be argued that the
362
analytical technique is uniquely tailored to the data which in turn will be influenced by
363
differences in the participants, the context, the researcher, the methods and the materials.
364
Thus, step by step accounts are unique to any one project and not generalisable across
365
studies as each is distinct from the next. However, results from this review illustrate there
366
to be limited consistency across articles in reporting data analysis techniques in general,
367
rather authors or editors are focussing on detailing other aspects of the research process.
368
For example, one article detailed the ethical considerations and justified using visual
369
methods when participants are considered vulnerable (Capstick, 2011). However, this came
370
at the expense of any detail on analytical techniques suggesting one part of the research
371
process supersedes another. Yet if one dimension of a project is prioritised in the reporting
this will come at the expense of another resulting in an end product that will be incoherent
373
and methodologically weak.
374
375
As indicated earlier, three important methodological issues also emerged from the scoping
376
review in addition to the findings regarding data analysis techniques. These were: concerns
377
with the ethical implications involved when utilising visual methods; a lack of a clear
378
rationale for using visual methods; and limited articles clearly stating a chosen methodology.
379
This scoping review was not intended to reach beyond the analysis of qualitative visual data
380
thus the emerging issues are not reflected in the search terms above yet warrant further
381
discussion.
382
383
Ethical considerations in research
384
This review found limited evidence regarding the appropriateness of capturing visual data in
385
general or the rational for using visual data when audio or field notes may have sufficed.
386
This is concerning, certainly from an ethical perspective. Ethical considerations are
387
heightened when utilising visual methods in all research involving human participants as
388
capturing behaviour via video or still cameras could be seen as
389
privacy. Thus, issues of confidentiality and anonymity come to the fore requiring sensitive
390
and detailed consent procedures. Yet, given the obvious importance of such procedures
391
there is limited evidence in the literature that ethical concerns were at the forefront of the
392
design, implementation and dissemination of research results.The results of this review
393
highlight that many articles omitted to address any ethical issues involved when using visual
methods; this was mainly the concern of dedicated papers wholly focussed on the topic of
395
visual ethics, Wiles et al (2012) for example. From the 29 articles reviewed only eight
396
authors reported on the possible ethical implications of their research and understandably
397
these studies involved participants that were under the age of 18 or considered as
398
vulnerable. A further thirteen have assumed that a general sentence in the methods section
399
of an academic article is sufficient clarification for the reader that the complexities involved
400
in research ethics have been thought through. Finally, eight authors omitted to mention any
401
ethical considerations of using visual methods in research.
402
403
It is possible that a large proportion of researchers do not utilise their visual data once
404
analysis is complete. In cases such as these it is also understandable that limited ethical
405
consideration would be required unless the visual data was to be disseminated. Equally, the
406
depth of ethical detail and scrutiny from ethical review committees may depend on the
407
particular review board, the individual research proposal or project time constraints. These
408
considerations are beyond the remit of this review.
409
410
Certainly, in the UK, regulating the ethical implications involved in social research requires the
411
constant and consistent review of existing and emerging ethical issues. In consequence
412
numerous ethical frameworks have become a popular source of reference for researchers
413
including the ESRC Research Ethics Framework for example (Wiles et al., 2008). As the
414
popularity and incidence of visual methods in particular increases, in accordance with the
415
g more stringent and visually
specific. These now include B“A V “ G
417
(BSA, 2006) and the International Visual Sociology Association Code of Research Ethics and
418
Guidelines (Papademas, 2009).
419
420
Given the depth of detail and the possible ethical implications of using the visual in research
421
does this mean that the visual elevates ethics to a new level of importance (Prosser, 2008)?
422
Undoubtedly, concern has been expressed from some researchers that adhering to rigorous
423
guidelines merely places unnecessary limits upon and detracts from the research project
424
(Murphy & Dingwall, 2007), although this will be dependent on the individual project.
425
Nevertheless, ethically sound research dictates that the methods and processes involved in
426
a project are explicit thus creating comprehensive transparent and replicable results. This in
427
turn should enable increased understanding of the topic under investigation and inform
428
new knowledge. An obvious link was found when reviewing this literature between those
429
studies that omitted an ethical description and the detail authors go to when rationalising
430
the using of visual methods.
431
432
Rationale when using visual methods 433
Limited articles included justification for using video based methods. Unquestionably,
434
certain populations will be considered as vulnerable which will necessarily require
435
heightened and detailed rationale for using visual methods. Nevertheless, utilising visual
436
methods should always be regarded as an intrusion into the persons privacy thus justified
437
accordingly. Questions need to be asked whether traditional audio or field notes would
have been sufficient in many of these circumstances. A recent literature review to evaluate
439
researcher choices involved in the use of visual methods also suggests clear messages need
440
to be conveyed regarding methods selection (Pain, 2012). Many of these choices will no
441
doubt be ethically driven and should require detailed consideration by the researcher and
442
the ethical review board involved.
443
444
Furthermore, the research team needs to interrogate the study design to ensure that their
445
rationale is defendable in their choice of method and distinguish whether visual methods
446
are a requirement or a necessity. These questions could include; are visual methods central
447
to the research design or secondary? How has using visual methods shaped the research
448
results? How would the results have differed using audio or field notes? Undeniably, using
449
video recorders as a data collection tool may provide the researcher with renewed freedom
450
when compared with the physical effort required when taking field notes. Yet this a
451
methodological choice that has not been addressed in the majority of articles included in
452
this scope. The appropriateness of using visual methods needs to be considered,
453
rationalised and defended in the dissemination of visual data. In contrast for others,
454
Bartlett, (2012); Galman, (2009) and Mcnaughton (2009) as examples, visual methods were
455
central and necessary to the study design and authors were explicit and detailed when
456
describing the study rationale.
457
458
459
Statement of a chosen methodology 461
Research evidence that coherently illustrates the authors chosen methodology is scarce
462
despite the popularity of visual methods which continues to gain momentum. For the
463
reader, justification of a chosen methodology can add credence and plausibility to
464
qualitative research evidence. Thus if a researcher is transparent in the methodologies they
465
adopt this will be consistently reflected in the research question, data collection methods,
466
analytical technique and reporting of findings. Despite the ongoing interest in visual
467
research methods, this review found inconsistencies in the descriptions of a coherent and
468
consistent methodological approach to reporting visual data. The results of the scope
469
illustrated these inconsistencies as only 12 of the 29 reviewed articles clearly stated a
470
chosen methodology including Sensory Ethnography, Photovoice and Ethnomethodology.
471
For the remaining articles it was necessary for the reader to infer the methodological
472
perspective as the majority were unclear but alluded to certain methodologies including
473
Phenomenology or Ethnography. Others may be using existing methodologies including
474
Grounded Theory for example, but are not specifically labelling their approach as such.
475
However, it should be acknowledged again that editor and journal stipulations may
476
influence the methodological detail of an article as some schools of thought call for the
477
integration of methods and results for example. Understandably, the articles that explicitly
478
detailed a chosen methodology were also more likely to reflect on the research process and
479
their role within it (for example Liu et al., 2012; Noy, 2011; Toole, 2013). Reflexivity requires
480
acknowledgement of the ways in which the researcher and the research process may shape
481
the data which can ultimately enhance the credibility of the findings (Mays & Pope, 1995).
482
Conclusions
484
Qualitative visual researchers are required to be more transparent during the process of
485
data collection, analysis and dissemination of research results than this scoping review
486
suggests. Predictably, those that attempt to be more methodical may be critiqued for
487
attempting to generalise and objectify their data. Nevertheless, transparency aids clarity
488
and detailed methodical reporting can remain reflexive, expressive and subjective. As
489
indicated earlier, some have proposed visual methods that may transcend disciplines whilst
490
others regard each visual method as unique and discrete from the other. However, the
491
results from this review suggest this is not a dichotomy of extremes but rather a continuum
492
of visual research methods. Authors situate their research somewhere on this continuum
493
- collection; analysis and reporting that may
494
be considered unique to their project. These novel approaches are developed and
495
undertaken as some may consider existing approaches to be unsuitable.
496
Although it is not suggested that there is a right or wrong way to undertake qualitative
497
visual research, methodological appropriateness is crucial. It is expected that methods of
498
data collection and analysis will differ across studies; it is also encouraging that researchers
499
are using innovative and creative techniques. However, coherence and consistency are
500
required when reporting if qualitative visual methods are to gain any methodological depth
501
(Pauwels, 2010). If authors are explicit about their techniques, existing knowledge may be
502
built upon and new knowledge created in areas that lack coherence such as this one. It is
503
important that academics report their methods with more transparency, given journal
504
restrictions, as well as continuing having necessary across discipline conversations and
505
debates regarding their findings.
References
507
A H O M L “
508
International Journal of Social Research Methodology, 8(1), 19 32.
509
http://doi.org/10.1080/1364557032000119616
510
Avraamidou, L., & Zembal-Saul, C. (2010). In search of well-started beginning science
511
teachers: Insights from two first-year elementary teachers. Journal of Research in 512
Science Teaching, 47(6), 661 686. http://doi.org/10.1002/tea.20359
513
Bartlett, R. (2011). Using diaries in research with people with dementia. Social Research, 1 7.
514
Bartlett, R. (2012). Modifying the diary interview method to research the lives of people
515
with dementia. Qualitative Health Research, 22(12), 1717 26.
516
http://doi.org/10.1177/1049732312462240
517
Booth, A., Carroll, C., Ilott, I., Low, L. L., & Cooper, K. (2013). Desperately seeking dissonance:
518
identifying the disconfirming case in qualitative evidence synthesis. Qualitative Health 519
Research, 23(1), 126 41. http://doi.org/10.1177/1049732312466295
520
BSA. (2006). Statement of Ethical Practice for the British Sociological Association - Visual 521
Sociology Group. Retrieved from www.visualsociology.org.uk
522
Cabassa, L. J., Parcesepe, A., Nicasio, A., Baxter, E., Tsemberis, S., & Lewis-Fernández, R.
523
(2013). Health and wellness photovoice project: engaging consumers with serious
524
mental illness in health care interventions. Qualitative Health Research, 23(5), 618 30.
525
http://doi.org/10.1177/1049732312470872
526
Capstick, A. (2011). Travels with a Flipcam: bringing the community to people with dementia
527
in a day care setting through visual technology. Visual Studies, 26(2), 142 147.
528
http://doi.org/10.1080/1472586X.2011.571890
529
Centre for Reviews and Dissemination. (2009). Centre for Reviews and Dissemination, 530
Guidance for undertaking reviews in healthcare. Retrieved from
531
http://www.york.ac.uk/inst/crd/pdf/Systematic_Reviews.pdf
532
Chivanon, N., Wacharasin, C., Homchampa, P. and Phuphaibul, R. (2011).
533
Parent/grandparent-child interactions and their influence on child development. Pacific 534
Rim Interanational Journal of Nursing Research, 15(4), 305 22.
535
Cook, A. (2003). Using Video to Include the Experiences of People with Dementia in
536
Research, 21(2).
537
Donnelly, M. P., Nugent, C. D., Craig, D., Passmore, P., & Mulvenna, M. (2008). Development
538
of a cell phone- A
539
Medicine and Biology Society, 2008, 5330 5333. Retrieved from
541
http://www.ncbi.nlm.nih.gov/pubmed/19163921
542
Drew, S. E., Duncan, R. E., & Sawyer, S. M. (2010). Visual storytelling: a beneficial but
543
challenging method for health research with young people. Qualitative Health Research,
544
20(12), 1677 88. http://doi.org/10.1177/1049732310377455
545
Emmison, M., Smith, P. & Mayall, M. (2012). Researching the Visual: 2nd Edition. SAGE
546
Publications Inc.
547
Erickson, F. (2011). Uses of video in social research: a brief history. International Journal of 548
Social Research Methodology, 14(3), 179 189.
549
http://doi.org/10.1080/13645579.2011.563615
550
Galman, S. C. (2009). The truthful messenger: visual methods and representation in
551
qualitative research in education. Qualitative Research, 9(2), 197 217.
552
http://doi.org/10.1177/1468794108099321
553
Gibson, W., Webb, H. and vom Lehn, D. (2011). Re-constituting social praxis: an
554
ethnomethodological analysis of video data in optometry consultations. International 555
Journal of Social Research Methodology, 14(3), 207 218.
556
Häggman-Laitila, A., Pietilä, A.-M., Friis, L., & Vehviläinen-Julkunen, K. (2003). Video home
557
training as a method of supporting family life control. Journal of Clinical Nursing, 12(1),
558
93 106. Retrieved from http://www.ncbi.nlm.nih.gov/pubmed/12519255
559
Heath, C., Hindmarsh, J. and Luff, P. (2010). V Q ‘ A S
560
Interaction in Everyday Life. SAGE Publications Inc.
561
Hostgaard, A.M. and Bertelsen, P. (2012). Video observation in HIT development lessons
562
learned on benefits and challenges. BMC Medical Informatics and Decision Making,
563
12(91). http://doi.org/10.1186/1472-6947-12-91
564
Hurdley, R. (2007). Focal points: framing material culture and visual data. Qualitative 565
Research, 7(3), 355 374. http://doi.org/10.1177/1468794107078516
566
Kmet, L., Lee, R. and Cook, L. (2004). Standard QUality Assessment Criteria for Evaluating
567
Primary Research Papers, (February).
568
Knoblauch, H. (2012). Introduction to the special issue of Qualitative Research:
video-569
analysis and videography. Qualitative Research, 12(3), 251 254.
570
http://doi.org/10.1177/1468794111436144
571
K H “ B V
572
ethnographic and hermeneutical exercise. Qualitative Research, 12(3), 334 356.
573
http://doi.org/10.1177/1468794111436147
Knoblauch, H., Schnettler, B., Raab, J., Soeffner, H., & Luckmann, T. (2006). Video-Analysis -
575
Qualitative Audiovisual Data Analysis in Sociology Methodologies of Video Analysis.
576
Liu, W., Manias, E., & Gerdtz, M. (2012). Medication communication between nurses and
577
patients during nursing handovers on medical wards: a critical ethnographic study.
578
International Journal of Nursing Studies, 49(8), 941 52.
579
http://doi.org/10.1016/j.ijnurstu.2012.02.008
580
M E J H J “ T “ E us Interaction in
581
Collaborative Learning Situations. Small Group Research, 43(4), 497 522.
582
http://doi.org/10.1177/1046496412437208
583
Margolis, E. and Pauwels, L. (2011). The SAGE Handbook Visual Research Methods.
584
http://doi.org/10.4135/9781446268278
585
Mason, P. (2005). Visual data in applied qualitative research: lessons from experience.
586
Qualitative Research, 5(3), 325 346. http://doi.org/10.1177/1468794105054458
587
Mays, N., & Pope, C. (1995). Rigour and qualitative research. Qualitative Research, 311(JuLY).
588
Mcna M J C P A I V
589
Recordings, 27 48.
590
Murphy, E., & Dingwall, R. (2007). Informed consent, anticipatory regulation and
591
ethnographic practice. Social Science & Medicine (1982), 65(11), 2223 34.
592
http://doi.org/10.1016/j.socscimed.2007.08.008
593
Noy, C. (2011). The Aesthetics of Qualitative (Re)search: Performing Ethnography at a
594
Heritage Museum. Qualitative Inquiry, 17(10), 917 929.
595
http://doi.org/10.1177/1077800411425008
596
Pain, H. (2012). A Literature Review to Evaluate the Choice and Use of Visual Methods.
597
International Journal of Qualitative Methods, 11(4), 303 319.
598
Papademas, D. (2009). IVSA Code of Research Ethics and Guidelines. Visual Studies, 24(3),
599
250 257. http://doi.org/10.1080/14725860903309187
600
Parry, R. (2005). A video analysis of how physiotherapists communicate with patients about
601
Physiotherapy, 91, 204 214.
602
http://doi.org/10.1016/j.physio.2005.05.004
603
Pauwels, L. (2010). Visual Sociology Reframed: An Analytical Synthesis and Discussion of 604
Visual Methods in Social and Cultural Research. Sociological Methods & Research (Vol.
605
38). http://doi.org/10.1177/0049124110366233
606
Persaud, M. L. (2009). Pleasure in the daily lives of people living with advanced dementia in a 607
long-term care facility: a multiple case study approach. Retrieved from
https://tspace.library.utoronto.ca/bitstream/1807/17816/1/Persaud_Malini_L_200906
609
_PhD_thesis.pdf
610
Pink, S. (2001). Doing Visual Ethnography. SAGE Publications Inc.
611
Pink, S. (2012). Advances in Visual Methodology. SAGE Publications Ltd.
612
Prosser, J. (1996). What Constitutes an Image- Q M Visual
613
Sociology, 11(2), 25 34.
614
Prosser, J. (1998). Image-based Research: A Sourcebook for Qualitative Researchers. London:
615
UK Falmer Press.
616
Prosser, J. and, & Loxley, A. (2008). ESRC National Centre for Research Methods Review 617
Paper.
618
Rose, G. (2012). Visual Methodologies: An Introduction to Researching with Visual Materials.
619
SAGE.
620
Schnettler, B. and Raab, J. (2008). Interpretative Visual Analysis. Qualitative Social Research,
621
9(3).
622
Tiitinen, S. and Ruusuvuori, J. (2012). Engaging parents through gaze: Speaker selection in
623
three-party interactions in maternity clinics. Patient Education and Counseling, 89(1),
624
38 43. http://doi.org/10.1016/j.pec.2012.04.009
625
Toole, P. O. (2013). Capturing Undergraduate Experience through Participant- Generated
626
Video, 18, 1 14.
627
Treloar, C., Laybutt, B., Jauncey, M., van Beek, I., Lodge, M., Malpas, G., & Carruthers, S.
628
B C -up of
629
swabbing in an analysis of video recordings of injecting practice. The International 630
Journal on Drug Policy, 19(1), 59 65. http://doi.org/10.1016/j.drugpo.2007.01.005
631
Trierweiler, S.J., Nagata, D.K. and Banks, J. V. (2000). The structure of interpretations in
632
family therapy a video-enhanced exploration. Family Process, 39(2), 189 205.
633
Wiles, R., Prosser, J., Bagnoli, A., Clark, A., Davies, K., Holland, S., & Renold, E. (2008). Visual 634
E E I V ‘ .
635
Wiles, R., Coffey, A., Robison, J. and Prosser, J. (2012). Ethical Regulation and Visual
636
Methods: Making Visual Research Impossible or Developing Good Practice?
637
Sociological Research Online, 17(1).
638
639
Table 1: Charting of articles for review
Author & Title Statement of Methodology Rationale for visual methods Study design & questions
Ethics for use of visual methods Data collection technique Data analysis technique
General findings Reflexivity
Astell et al (2010) UK
Using a touch screen computer to support relationships between people with dementia and caregivers
None mentioned To capture non-verbal behaviour
User-centred design and explicit research questions
None mentioned Video recorded reminiscence sessions
Computer assisted quantitative coding and categorizing of verbal and non-verbal behaviours
Interacting with a touch screen is engaging for people with dementia No reflexive account given Avraamidou & Zembal-Saul (2010) Cyprus/USA In Search of Well-Started Beginning Science Teachers: Insights From Two First-Year Elementary Teachers
Unclear, inquiry based approach
Not provided Qualitative case study design and explicit research questions
Not mentioned Audio-recorded interviews, video-recorded classroom observations, lesson plans and samples of students work Unclear categorising and coding mentioned Participants perceived specific learning experiences as being critical to development
No reflexive account given
Bartlett (2012) UK
Modifying the Diary Interview Method to Research the Lives of People with Dementia
Sensory ethnography Researching with participants with possible language impairments Modification of diary interview. No specific research questions stated Detailed considerations Participatory photo and audio diaries Combination of content, thematic and interpretive analysis techniques Sensory ethnography mediates an equal relationship and makes
environment in which that person lives
Reflexive account throughout
Cabassa et al (2012) USA
Health and Wellness Photovoice Project: Engaging Consumers With Serious Mental Illness in Health Care Interventions Photo- Voice methodology Photovoice method empowers participants to communicate their life experiences Study design explicit. No specific research questions stated Appropriate review boards approved procedures. Ethics of video in research not mentioned Photovoice method including images, interviews and group sessions Qualitative pile sorting techniques and constant comparative method Participatory research methods can foster engagement and social action amongst overlooked populations No reflexive account given Capstick (2011) UK
Travels with a Flipcam: bringing the
community to people with dementia in a day care setting through visual technology
Participatory Video (PV) methodology
Groups at risk of marginalisation become involved in making their own films
Study design of 3 phases, phase 2 being the focus of the article. No specific research questions stated Detailed and comprehensive ethical considerations of using video in research
Participatory Video
V
analysed but rather edited and combined with participants comments
Participatory approaches can be successful if modified when researching with people with dementia
Table 1: Charting of articles for review
Author & Title Statement of Methodology Rationale for visual methods Study design & questions
Ethics for use of visual methods Data collection technique Data analysis technique
General findings Reflexivity
Chivanon et al (2011) Thailand
Parent/Grandparent-Child Interactions and their Influence on Child Development
Ethnography Not provided Detailed study design. No specific research questions stated Approval sought from relevant Ethical Research Committee. Ethics of video in research not mentioned Video recordings of observation and interview Descriptive statistics, content analysis of transcripts and ethnographic analysis. Analysis of video data not mentioned
Improved
Parents/Grandparents interactions with their children during 5 major daily activities
No reflexive account given
Cook (2003) UK
Using Video to Include the Experiences of people with Dementia in Research
Ethnographic and inclusive
Video recordings played back to participants to elicit perspectives on the data
Study design and research aims included. No specific research questions stated The ethical implications of using video in research is stated
Participant observation and informal interviewing using field notes and video
Eliciting views from participants was problematic. Technique used in data analysis not mentioned
Video is a useful tool for involving people with dementia in research
Detailed reflexive account
Drew et al (2010) Australia
Visual Storytelling: A Beneficial But Challenging Method for Health Research With Young People
Photovoice and photo elicitation Methodology Visual approaches can accommodate various elements including communication and promoting voice
Described as a self-management study design. No specific research questions stated Approval sought from relevant Ethical Research Committee. Ethics of video in research not mentioned Photovoice and Photo Elicitation using in-depth interviews Thematic analysis using Nvivo of transcribed audio-recorded interviews. Data from visual storytelling approach coded and analysed thematically
Visual Storytelling can aid reflection and communication issues that are difficult to conceptualize
Reflexive account of key issues provided throughout Galman (2009) USA The truthful messenger: visual methods and representation in qualitative research in education
Ethnography Integrating the novel as a collaborative visual text provides a snapshot of participant experience
Study design and objectives described. No specific research questions stated Detailed ethical considerations of participants expressing themselves artistically
The graphic novel as a visual method
Content analysis, frequency counts and participant interpretation of meaning
Integrating the graphic novel as a collaborative visual text may aid data collection, analysis and representation Detailed reflexive account
Gibson et al (2011) UK
Re-constituting social praxis: an
ethnomethodological analysis of video data in optometry consultations
Ethnomethodology Analysis from this perspective would not be possible without video recorded data. Description of strategies of analysis taken from larger project. No specific research questions stated
Not mentioned Video recordings of one-to-one optometrist an patient consultations
In-depth description of data analysis using conversation analysis
Highlights the importance of video as a mechanism to the microanalysis of social praxis
Table 1: Charting of articles for review
Author & Title Statement of Methodology Rationale for visual methods Study design & questions
Ethics for use of visual methods Data collection technique Data analysis technique
General findings Reflexivity
Haggman-Laitila et al (2003)
Finland
Video home training as a method of
supporting family life control
None mentioned Video recordings allow detailed analysis of interaction
Study design described as video home training. Aims and research questions clearly stated
Ethical issues involving visual methods were discussed in depth
Video recorded episodes of family counselling
Using the general method of analysing photographs and video material developed by anthropologist-photographers
The method helped families gain better control over their lives
Detailed reflexive account
Hansebo & Kihlgren (2002)
Sweden
C
with patients suffering from severe dementia: a difficult balance to facilitate mutual togetherness Qualitative phenomenological hermeneutic methodology Video recording utilised to illuminate carers interactions with residents in a care context
Study design and aims described. No specific research questions stated Approved by Regional Research Ethics Committee. Ethical considerations of using visual methods were mentioned Video-recorded care sessions Video data transcribed in to text and analysed using a 3 step approach
The intervention contributed to an improvement in carers skills in balancing their interactions Reflexive account on method-ological considerations
Hirsch et al (2011) Germany
Reliability and validity of the German version of the OPTION scale
Quantitative no methodology stated
Assessment of the presence and characteristics of communication behaviour Cross-sectional assessment design. No research questions stated
Approved by local ethics committee. Ethics of using visual methods not mentioned
Video recorded consultations
Statistical analysis of 12-item five-point OPTION scale
The German version of the OPTION scale is reliable at total score level.
No reflexive account given
Hostgaard & Bertelsen (2012)
Denmark
Video observation in HIT development: lessons learned on benefits and challenges Hermeneutic Methodology clearly defined Visual methods enable a thorough insight into complex clinical healthcare settings Multiple case study design. Objectives clearly defined but no research questions stated
Ethics were discussed, visual images of patients were not used in dissemination
Non-participant video observation
Three step process including transcription, mapping and interpretation
Video observation is superior to other ethnographic methods when disclosing the complexity of clinical work practice Reflection on strengths and weaknesses Hurdley (2007) UK
Focal points: framing material culture and visual data
No specific methodology specified
Photographs can be taken as verbal, non-textual frames of experience
Autophotography. No research questions stated
Not mentioned Questionnaires, autophotography and interviews Multimodal and interpretive but specific technique unclear Multi-modal methods of presentation can illuminate the complex dimensions both of home lives and of enquiry into the domestic interior