THESES, SIS/LIBRARY R.G. MENZIES BUILDING N02 Australian National University Canberra ACT 0200 Australia
USE OF THESES
This copy is supplied for purposes of private study and research only. Passages from the thesis may not be copied or closely paraphrased without the
written consent of the author.
THE AUSTRALIAN NATIONAl UNMRSITY
Telephone: +61 2 6125 4631 Facsimile: +61 2 6125 4063
....___
---~---URANIUM-SERIES DATING OF CORALS
FROM THE SOUTHWEST PACIFIC
by
John F. Marshall
A thesis submitted in fulfilment of the requirements for the degree of MASTER OF SCIENCE
AUSTRALIAN NATIONAL UNIVERSITY
i
Statement
The analytical data and conclusions
presented in this thesis are my own, unless otherwise acknowledged in the
text
John F. Marshall
'
· I
-
a
~ ,_________________________________________________________________________________ ___
ii
Acknowledgements
A study involving uranium-series dating of corals was initiated by Dr V.M. Oversby and Dr P.J. Cook. The project was supervised by Dr Oversby, and her support and guideance are gratefully acknowledged.
I am also grateful to Dr H.H. Veeh of Flinders University who managed to get the a-spectrometers into working order, and to Mr N. Schram who kept them going.
Coral samp~es for this study were kindly provided by Prof. G. M. Friedman, Drs J. Chappell, P.J. Cook, P.J.
Davies, H. Hekel, D. Hopley, R. McLean, J. Pickett, B.G. Thorn, Miss A. Smith, Messrs. P. Hohnen, and J. Launay.
Although some of these corals eventually proved to be un-suitable for dating, as a result of recrystallization, I am grateful for their support.
Discussions with many people, especially Drs. J. Chappell, P.J. Davies, R. McLean, B.G. Thom and H.H. Veeh
have proved invaluable throughout the course of this study. Technical assistance was helpfully provided by Mrs
R. Maier and Mr P. Beasley.
I would like to thank my wife Ann, both for .her
expert typing of this thesis, · and together with Simon, for their patience and understanding during its preparation.
i i i
Abstract
The uranium-series technique is based on the observ-ation that carbonates precipitating in nature, in particular
corals and oolites, show an initial disequilibrium between Th230 and its parent U238 • The amount of Th230 initially
present in a coral is negligible in comparison to that sub-sequently generated by the radioactive decay of uranium. If the system remains closed then the ratio of Th230 to U238
is a simple function of time. Because there is a 15 per-cent excess of U234 to U238 in sea water this has to be taken into account when determining the age.
Corals from New Guinea, the Loyalty Islands, and the east coast of Australia were provided for dating. The New Guinea corals, from the Huon Peninsula, had been dated
prev-iously, and so they provided a check on the reliability of
the techniques used in this study. With one exception the ages from this study are within the error limits placed on
the original ages. .;
The one sample that does not agree ~s shown to have a high proportion-of void-filling low-Mg cal-cite cement.
Corals from the Capricorn Group and Hayman Island ·within the Great Barrier Reef province show relatively
young ages. One coral recovered by drilling at a depth of 17m ·on the Hayman Island reef indicates that the time of
recolonization of the reef towards the end of the Holocene
transgression is about 8,300 yr B.P. Coral samples below a
l.V
Ages of corals from the Inner Barrier of New South
Wales show that this feature 'formed duri~g the last
inter-glacial at about 120,000 yr B.P. The ages suggest that
there were two periods of high sea level at about this time.
Ages from reef terraces 2-6m above present sea level from three islands of the Loyalty Archipelago show the varying degrees of uplift of these islands. Corals from +2m on Beautemps-Beaupre are older than 200,000 yr
B.P., while a coral at +6.5m from Ouvea gave an age of
117,000 ± 6,000 yr B.P. Ages from the +2m terrace on
Lifou support the interpretation of a relatively high sea level at about 180,000 yr B.P.
Ages of corals from a slightly raised fringing reef around Mud Island, Moreton Bay indicate a sea level about
one metre higher than present during the interval 4,000 -6,000 yrs B.P. This slightly higher sea level could have
Statement Acknowledgements Abstract Chapter Chapter Chapter Chapter 1 1.1 1.2 1.3 2 2.1 2.2 3 3.1 3.2 3.3 4.1 4.2 4.3 Contents Introduction
Development of the Uranium-Series Technique
Theory
Sample Preparation and Analytical Techniques
Th230 /U234 ages from the Huon Peninsula, New
Guinea
Introduction
Ages of Selected Coras from the Huon Peninsula
Th230/U234 ages of Corals from the Great Barrier Reef
Introduction
Ages of Corals from the Capricorn ·Group
Ages from the Hayman Island Cores
Th2 3 0 /U.2 3 4 ages from the
Inner Barrier of New South Wales
Geomorphology of the Inner Barrier
Previous Ages from the Inner Barrier
Location of Corals from the Inner Barrier
Chapter Chapter Chapter Appendix Appendix 4.3.1
4. 3. 2
4.4 4.5 5 5.1 5.2 5.3 5.4 5.5 5.6 6 6.1 6.2 6.2.1 6.2.2 6.3 7 1
. 2
Grahamstown Embankment
Evans Head
Ages of Corals from the Inner Barrier
Conclusion
Th230 /U234 Ages of Corals
·from the Loyalty Islands
Introduction
Tectonic S'etting
Regional Geology of the Loyalty Islands
Ages of Corals from the Loyalty Islands
Uplift Rates of the Loy-alty Islands
Conclusions Page 35 38 42 46 49 49 49 51 54 57 59
Th230/U234 Ages of Corals 61
from Moreton Bay, Queens-land
Introduction 61
Coral Ages from Moreton 64
Bay
Bribie Island 64
Mud Island 65
Interpre.tation of High. Sea 6 7
Levels in Moreton Bay
Conclusions
Preparation of Iron Carrier
69
73
Preparation of 0. 25N (NH 4 ) 2 73
so4
solutionAppendix 3
Appendix 4
Bibliography
Preparation of. Th2 3 4 Yield Tracer
Petrography of Corals from the Huon Peninsula
,,
vii
P~ge
74
75
2.1
2.2
3.1
3.2
4.1
5.1
6.1
List of Tables
Comparison of the Mineralogy of
Corals from th~ Huon Peninsula,
New Guinea
Comparison of Th230 /U234 Ages of Corals from the Huon Peninsula, New Guinea
Radiochemistry and Ages of Corals from the Capricorn Group
Radiochemistry and Ages of Corals
from Drill Hole R2, Hayman Island
Radiochemistry and Ages of Corals from the Inner Barrier of New South Wales
Radiochemistry and Ages of Coral Samples from the Loyalty Islands
Radiochemistry and Ages of Corals from Moreton Bay, Southern Queens-land
viii
Page
16
18
23
30
44
55
1.1 3.1 3.2 3.3 4.1 4.2 4.3 4.4 5.1 5.2
6.l
7.1 lA-JList of Figures
Typical a-spectra of uranium and thorium isotopes
Reefs of the Capricorn·. and Bunker Groups
Location of Hayman Island
Location of·drill holes and general stratigraphy of the cores
Quarternary features of the
New-castle Bight Embayment ·
Cross section of the Inner Barrier
Evans Head coral locality
Stratigraphy at coral site, Evans Head
Regional bathymetry of the New Caledonia-New Hebrides area
Map of the Loyalty Islands
Bribie and Mud Islands, Moreton Bay
Position of dated corals relative
to the late Quarternary ~ea
level curve
Photomicrographs of corals from the Huon Peninsula, New Guinea
Chapter 1 - Introduction
1.1 Development of the Uranium-Series Technique
The development of dating methods based on the radioactive decay of the uranium-series commenced when
Jo1y (1908) observed that deep-sea sediments have a higher
radium content than their terrestrial counterparts.
Pettersson (1937) suggested that the high radium content
was the result of precipitation of Th230 from ocean water.
This was confirmed by Koczy et aZ. (1957) and Sackett et al~
(1958), who discovered that the amount of thorium in
deep-sea waters was less than one percent of the amount required
for secular equilibrium with the uranium content. Therefore, recently deposited sediments tend to be rich in thorium,
and if there is no exchange between the layers, then the
decay of Th230 to secular equilibrium can be used for dating
each individual layer.
Conversely, because of the deficiency of Th230 with respect to its parent, U238 , in ocean waters, carbonates
precipitating in nature would be expected to show an initial disequilibrium in the U238 series. Therefore, the amount of Th230 initially present in any fossil carbonate could be
considered negligible in comparison with that subsequently gene.rated by the radioactive decay of uranium. If this is
the case, and providing that the system remained closed to
the addition or losses of U238 and its daughter products, then the ratio of Th230 to U238 in the carbonate would be
2
This was confirmed by Barnes et a
z . (
19 56) from coresamples of co~al limestone on Eniwetok Atoll in the Pacific
Ocean. It was found that while the uranium content remained
nearly constant ( 2 • 9 to 5 • 5ppm variation) the amount of
Th2 3 0 increased with depth, and that the activity ratio of
Th2 3 0 to U2 3 8 changed more or less I~egularly from nearly zero
for recent coral unti;t i t approximated the equilibrium r.atio
(Th230 /U238~1) at depths beyond 30m. This discovery
sugg-ested that absolute age determinations could be made for
Pleistocene marine carbonates up to 300,000 years old.
. Cherdyntzev (1955) showed that the activity ratio of
U23~ to U238 in nature often differed from secular
equilib-rium. Thurber (1962) confirmed this anomaly, and suggested
that there is a 15% excess of U2 34 to U2 3 8 in the
present-day ocean. This made i t necessary to revise the relationship
between the activity ratio (Th230 /U238 ) of the sample and.its
age. However, this disequilibri urn meant that i t could also
be used as a dating technique itself, based on the
disappear-ance of the initial excess of u2s1+ 1n
.
the sample. The agelimit is about one million years.
Since these early discoveries attempts have been made
to date various materials using the uranium-series·
disequil-ibi~ium method. Marine carbonates have been extensively
studied (e.g. Thurber et
az.,
1965; Kaufman and Broecker,1965; Ku, 1965; Veeh, 1966; Lalou et aZ., 1966; Blanchard
et
az.'
1967; Mesolella et aZ. , 1969; Veeh and Chappell,1970; Konishi et
az.,
1970; Ku etaz. '·
1974; and Bloomdet-3
mined for unrecrystallized corals and oolites, but the
reliability of dating molluscs has been seriously question-ed. Studies by Kaufman et aZ. (1971) on an extensive suite of. molluscs have indicated that isotopic and/or chemical
migration takes place. Inorganically precipitated
carbon-ates, such as cave deposits and marls have been dated (e.g. Duplessy et aZ., 1970.; Kaufman, 1971; Thompson and
Lums-den, 1973; and Thompson et aZ., 1975). Dating of verteb-rate fossils (Szabo et aZ., 1969; Hansen and Begg, 1970;
and Szabo et
at.,
1973) has had some success, althoughmig-ration of uranium and daughter elements has occurred in many of the specimens. Marine phosphorites have also been dated by the uranium-series method (Baturin et
at.,
1972; Veehet
at.,
1973; Burnett, 1974). Because of the uncertaintiesthat arise from dating molluscs and other materials, only unrecrystallized corals have been used in the present study.
1. 2 · Theory
The general equation for determining the age of a sample· from the activity ratios U23 ~/U238 and Th230 /U23 ~ is given in Kaufman and Broecker (1965), and it_is .reproduced below. The equation assumes that the sample has remained
a closed system, i.e. there is no initial Th230 , and that
there is an initial 15 percent excess of U23~ to U238 that disappears at ·a rate determined by the decay constant of
..._
~·.
'
I \
·)t
~---Th230
u
234Where: ( i)
"o
X -X
0 1 1 - e-(J. -J. )t 0 1
U234/U238 and Th230 /U234 are the measured
activity ratios
4
(ii) J.
0 and J.1 are the decay constants for Th 2 30
and U234 respectively (half-lives used in this
study are 7·52 x 104 yr for Th230 and 2•48 x
10 5 yr for U234 ; A
=
9·21738 x 10-6 yr-l0
-6 -1
J.
1
=
2·79495 x 10 yr )A direct solution for t is impossible but ages can be
det-ermined using standard graphs, such as those reproduced by
Kaufman and Broecker (1965) and Gustavsson and Hogberg (1972),
and by iterative convergence.
In order to determine whether or not a particular
Th230 a~e is reliable, Thurber et aZ. (1965) used the
foll-owing criteria:
(1) The sample should contain less than a few
percent calcite. The recry stallization of
aragonite to calcite, or introduction of
calcite cement is likely to lead to a
viol-ation of the closed-system assumption. In
the present study corals with a calcite
con-tent in excess of 5 percent were rejected for
5
dating.
(2) The uranium concentration in the sample
should be 2 to 3ppm. Gvirtzman et aZ. (1973)
on the basis of fission-track analysis
in-dicated that modern scleractinian corals have
a concentration of about 2ppm uranium, and
that the presence of aragonite or
high-magnes-ium. calcite cement raises this concentration
to about 3ppm. However, uranium analyses
carried out during uranium-series dating
in-dicate that the normal values are 2-3ppm.
Aa~opo~a species commonly have a uranium
concentration of about 4ppm, and although they
generally give reliable ages (e.g. Broecker
et aZ· 1968) some doubt has been cast on their
reliability (e.g. Sample number 6 of Bloom
et
az.,
1974).(3) The U2 34 /U 238 ratio, corrected for age should
be 1·15 ± 0·03.
(4) The Ra226 /Th230 ratio should be consistent
with the age of the sample. Samples with
ages greater than 70,000 years should yield
ratios of unity v.li thin the experimental error.
No Ra226 values were determined during this
study, and mo_st. re:c.ent. workers n_o longer
apply this criterion.
( 5). The Th230 /Th232 ratio in the sample should
6
corals may be taken as evidence of secondary
addition.
(6) The Th230 /U234 age of the sample should be
consistent with its C14 age (where available).
(7) The Th230 /U234 age should be consistent with
stratigraphic data.
1.3 Sample Preparation and Analytical Techniques
Each sample was first cleaned using an ultrasonic
vibrator to remove soil or any lightly adhered material.
After this initial shaking, the sample was examined in hand
specimen for any visual signs of calcite cleavage which
may indicate recrystallization. The sample was then broken
'
up into small pieces and any external crust or remains of
encrus-ting organisms were removed with a vibratool and a dentist
drill. Particular attention was paid to the presence of any
borings, as these are often the site of secondary carbonate
cements. If borings were present then they were usually·
drilled out, or, i f the frequency of borings was high, the
sample was rejected for dating. After treatment with the
vibratool and dentist drill, the sample was cleaned once
more in the ultrasonic vibrator to remove carbonate dust and
any previously unremoved soil. The sample was then air dried
for six hours in an oven set at 50°C.
A representative split of the dried sample was ground
to a grainsize less than 65~m, and analysed by X-ray
diffrac-tion. The diffractometer was set to scan between 25° and
7
27.2° 28 and any calcite peak present (usually at 29·4° 28
for low-Mg calcite) were integrated. This was repeated
three more times~ and a mean value for the areas was
cal-culated and compared with those of prepared standards of
known mixtures of aragonite and calcite. In this way the
amount of recrystallization could be determined to within
less than one percent, for samples containing up to ten
percent calcite. If the sample contained more than five
percent calcite it was .rejected for dating.
In some cases thin sections of corals were prepared
in order to determine if aragonite and calcite cement were
present, and to delineate the sites of the cement. The
corals were impregnated with epoxy resin and both transverse
and longitudinal sections were cut for each coral. In this
way any samples which have a high aragonite cement content
were detected; these would have ordinarily been passed for
dating if only X-ray diffraction methods were used.
The sample was then ground in an agate mortar to a
fine grainsize and weighed. Normally about 20gm of ground
coral was used if available, but in some cases there was
insufficient material. The minimum amount of material used
was Sgm.
u232 and Th234 tracers were added to the coral for
chemical-yield determinations. The U232 spike, of known
activity C7. 860± 0. 065 dpm/ gm), was added in such proportions
as to approximate an activity ratio of about 1·0 with respect
to U238 and U234
• Usually about lgm of spike was added for
cal-ibrated against a gravimetric uranium standard by
a-particle spectrometry. 100~ (O·lc;c.) of Th234 yield
tracer, of known activity, was pipetted into the beaker
containing the coral. The Th23~ tracer was prepared by a
procedure similar to that described by Goldberg and Koide
(1962); the procedure is outlined in Appendix 3. To
this 4-5 drops of an iron carrier were added (the
prepar-ation of the iron carrier is outlined in Appendix 1).
8
Concentrated HN0
3 was added dropwise until all the
coral had dissolved. The sides of the beaker were rinsed
with concentrated HN0
3, and the solution was heated to
promote oxidation of organic material. In some cases a
few drops of concentrated HC10
4 were added to the solution
to effect complete oxidation. After the solution had
dig-ested for several hours, i t was allowed to cool. If any
insoluble material still remained i t was removed by
cen-trifuging, and the residue was treated with a concentrated
HF/HC104 mixture, and heated until i t had completely
de-composed. The remaining HF and. HC104 were evaporated, and
the residue was dissolved in dilute HN0
3 and returned to
the original solution.
Ammonia gas was bubbled through the solution until
a pH of 6·5-7·0 was reached. This results in the
pre-cipitation of ferric hydroxide which acts as a carrier for
U and Th. The ferric hydro.xide w.as c.ent.rifuged, washed
and then dissolved in concentrated HCl. The ferric
hydrox-ide was precipitated once more with NH3, centrifuged·, and
9
The ferric hydroxide precipitate was dissolved in distilled lON HCl and put through an anion exchange colunm.
The anion column (Bmm internal diameter) was packed with Bio-Rad AGl-XB, 200-400 mesh,.anion exchange resin to a
height of 10-12cm, and washed and rinsed thoroughly with BN HCl, prior to adding the solution. Both Fe and U are retained on the column, while Th passes through it. The resin was washed with one column volume of BN HCl to
com-pletely remove any thorium.
After removal of the thorium the anion column was
given two further column volume rinses of BN HCl. Fe was removed from the column with two column volume rinses of
0•25N (NH4>
2
so
4 solution saturated withso
2 (see Appendix 2 for preparation). After all. Fe was removed, the column • • was rinsed with three column volumes of 8N HCl to remove(NH
4>2
so
4• Finally U was eluted with three column volume rinses of 3N HBr, and evaporated to dryness.The thorium eluate was evaporated and reduced in ·
volume to about 2ml. The sides of the beaker were rinsed with 3m1 of distilled water, and the volume taken up to
15ml with 4N HCl. The Th-bearing solution was warmed ·slightly to ensure complete d.issolution, cooled, and put
through a cation exchange column. The column (Smm
inter-nal 9iameter) was packed with Bio-Rad AG SOW-XB, 100-200 mesh,
Cgtion
e.}{change resin to a height of about Bern; the column had been thoroughly washed and rinsed with 4N HCl10
with one column volume of 4N HCl, and Th eluted with two
column volumes of 0·75N oxalic acid. The eluate was
evap-orated until crystals of oxalic acid formed. The oxalic
acid was destroyed by evaporating to dryness twice with
concentrated HC10 4 , and once with 4N HCl.
Both U and Th were electroplated separately onto
stainless steel planchets. The plating solution consist~d
of 2N NH 4Cl acidified to pH 2·5. The plating time for U was 30 minutes at 10 volts, while forTh it was 90 minutes
at 6 volts. After plating the planchets were flamed to red
heat over a Bunsen Burner to completely oxidise any residue.
After electroplating,the Th-bearing planchet was
allowed to stand for five minutes so that any Pa23~ (t~=
1•2m) present had decayed. The activity of the Th23 ~ was
then measured on a Nuclear Chicago gas flow beta counter.
Th23 ~ served as a yield tracer for thorium. The Th 234 was
counted for a total of 10,000 counts, a background
correc-tion was applied, and the activity determined as counts .per
minute (cpm). This activity was compared with the known
activity of the Th 234 tracer, and the thorium yield was
expressed as a percentage. Chemical yields for thorium
varied between 10 and 40 percent.
Th2so, Th 232 , U234 , and U238 activities were
deter-mine.d by a-particle spectrometry. The counting system
con-si.sted of two· Qrtec surface barrier detectors, each
connec-ted to an Ortec 101-201 amplifier system, which in turn
were connected to a Nuclear Chicago multi-channel
11
of 400 channels, 200 channels for each system. Counts
were_ ~sually st-ored in the multi-channel analyzer for ·
twenty four hours, and then printed out. The counts were
erased, and counting continued for another twenty four
hours. The total counting time varied, depending on the
chemical yields. U isotopes were normally counted for
about 10,000 counts, i~e. until the U234 /U238 activity
ratio could be determined to within ±0·01 (at one standard
deviation). In some cases where the sample size or yield
was low, counting times in excess of 10,000 minutes had to
be used. However, most counting times were less than 8,0.00
minutes. Th isotopes were usually counted until the total
number of Th230 counts was about 6,000. If the Th230
activity was low, then the sample was counted for about
a,ooo
minutes.The separation between the peaks was good. U
iso-topes were integrated for a total of 19 channels, and the
separation between the maximum count for each isotope was
of the order of 40 channels. Figurel.lashows a typical
spectrum for U isotopes. There was complete separation
between the U238 , U23 ~ and U232 peaks, and no correction
~as needed for U235 interference. Th isotopes were
integ-rated over 11 channels, and separation between the maximum
count. for Th232 , Th230 and Th228 was again of the order of
4 0 channels. (Fig •. l .•. lb). Both U and Th peaks had low energy
tails, and so more channels were counted on the low energy
side than on the high energy side. Very little drift in
12
BOOr-~~~~~---~
746301138 Uranium Isotopes
600
.: 400
c :l 0 u 200 0 80
"'
,c 60(/) 40 0
...
c::J
0
u
0
0
Counting Time= 1580min!i
50
u 23 4
100
Channel Number
746301138 Thorium Isotopes
Counting Time= 1450mins
Th232
so
Th23o
_)
\.100
Channel Number
Th22a
Ra224
VLA
1501a
200
1b
R~2o
r
J
~\200
Figure l . l Alpha spectra of coral sample 74630ll3B
(a) Uranium isotopes
[image:23.861.85.774.78.1055.2]13
started to occur it usually indicated some electrical fault
in the amplifier.
U234 and U238 activities were calculated from the
calibrated U232 spike. Th2 32 ·and Th230 activities were
calculated from the chemical yield, as determined by the
Th234 tracer, and the efficiency of the detector (the
efficiency of each detector was calibrated using a
gravi-metric Th 232 standard). Blanks composed of all the reagents
and tracers were treated in the same manner as the sample
runs, and analyzed for U and Th isotopes. The measured
activities for the blanks were subtracted for each isotope
to give the final result. A small correction was made for
Th230 present in the Th 234 yield tracer. As U234 and U23e
were counted on the same planchet, their activity ratio
was calculated directly from the total number of counts for
each isotope, after the counter background had been
sub-tracted. The Th230 /U234 activity ratio was determined from
their respective, corrected activities. Total uranium
values, expressed as parts per m~llion (ppm), were determined
from the activity of U238 and the specific activity of U238.
The specific activity of U238 was calculated as 0.7462 dpm/~g
using the new half-life of 4.4683 x 10⁹yr. (Jaffey, eta~.,
..
---14
Chapt·er 2 - Th 2 3 0 /U2 3 '+ Ages from the Huon
Peninsula, New Guinea
2.1 Introduction
Before absolute dating of new material commenced,
it was considered essential to attempt to date corals of
known ages, so that the degree of reliability of the
tech-niques and the counting equipment used in this study could
be determined. For this purpose a suite of corals was
pro-vided by J. Chappell of the Department of Geography,
Australian National University, from the Huon Peninsula,
New Guinea. The corals come from a series of raised coral
terraces which extend along the northeast coast of the Huon
Peninsula (Chappell, 1974a). These corals had previously
-been dated at the laboratories of the Lamont-Doherty
Geo-logical Observatory, New York by W.S. Broecker, and the
ages were reported in Bloom et aZ. (1974).
The raised terraces consist of over twenty reef
complexes, and age estimates for the lower half have be.en
made by C1 ~ and Th230 /U23 ~ methods (Polach et aZ., 1969;
Veeh and Chappell, 1970; Bloom et aZ., 1974). Chappell
(1974a) has numbered the dated reef complexes from 0 to
XII; reef complex 0 represents the modern reef, which is
less than 500 years old while reef complex XII has been
dated as >250,000 yr B.P. The major reef complexes give
ages o.f 5,ooo .... 9,000 yr (reef complex I), 29,000 yr (reef complex II), 41,000 yr (reef complex III), 61,000 yr (reef
complex IV), 85,000 yr (reef complex V) ' 107,000 yr (reef
15
Each age for a particular reef complex has been
substanti-ated by a number of dates, and they agree with dsubstanti-ated
up-lifted reefs from other areas, such as Barbados (Broecker
et
az,
1968; Mesolella et ai·, 1969) and the RyukyuIs-lands (Konishi et aZ., 1970; Konishi et aZ., 1974).
2.2 Ages of Selected Corals from the Huon Peninsula
Five corals from three different terraces were
provided by J. Chappell for age determination. One coral
came from reef complex III, three samples came from reef
complex IV, and one coral came from reef complex VI.
After the corals had been cleaned, they were
analysed by x-ray diffraction for evidence of
recrystall-~
ization. The corals had previously been analysed by x-ray
diffraction by R.K. Matthews (Bloom et aZ., 1974). A
com-parison of both sets of analyses show them to be in fairly
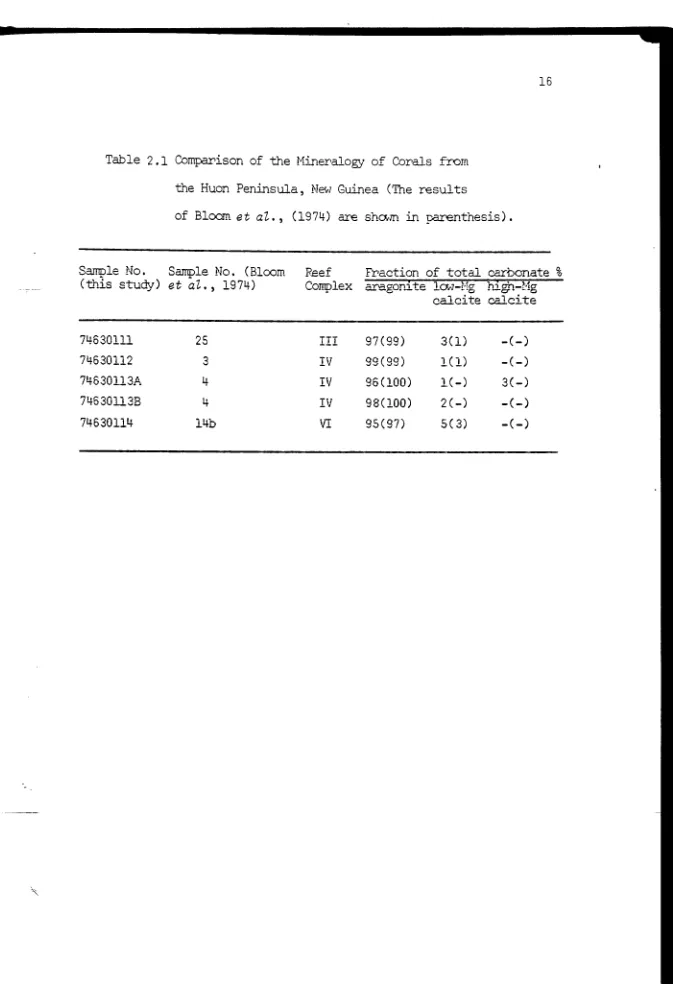
good agreement (Table 2.l).No coral analysed by both studies
contained more than 5 percent calcite. This was confirmed
by examination of the corals in thin section. Thin section
examination also showed that void-filling cement, either by
aragonite or calcite, was largely absent, and that borings
by microrganisms were rare. A petrographic description of
the corals,outlining the diagenetic changes observed, is
given in Appendix 4.
The ages of the samples determined by this study,
with one exception, fall within the error limits placed
on the original ages of Bloom et aZ. (1974), and, as such,
-16
Table 2 .1 Comparison of the Hineralogy of Corals from
the Huon Peninsula, Nev1 Gui..r1ea (The results
of Bloorn. et al. , (1974) are sha.·m in pa.r€nthesis).
S.aT'f!Dle No. Sample No. (Bloom P.eef Fr·action of total carbonate %
(th~s study) et aZ., 1974) Complex aragoP~te la.-1-Nv - --o h1 • -r::r Q"h-?·~g
--calcite --calcite
74630111 25 III 97(99) 3(1) -(-)
74630112 3 IV 00(00) ...;_, ...,.J 1(1) -(-)
74630113A 4 IV 96(100) 1(-) 3(-)
74630113B 4 IV 98( 100) 2(-) -(-)
[image:27.861.117.790.67.1051.2]--··
17
of the method (Table 2.2). Two samples from reef complex IV
(74630113A and 7463Qll3B) have an age difference of 8,000
years, although both are within the error limits of the
original age. The two age determinations were not done on
the same.piece of coral; these were two distinctly
diff-erent faviids, one having larger corallites than the other.
Bloom et al (1974) show that ages for reef complex IV range
from 57,000 to 66,000 years B.P., and so the difference in
age could be real.
One sample (74630114) did not agree with the orig-.
inal age determined by Bloom et al. (1974) there being a
difference of 15,000 years between them. This difference
is undoubtedly due to the loss of part of the sample and
spike during the dissolution stage. The sample was
rep-eated on two separate occasions, but the results were
completely unsatisfactory (the repeats are listed at the
bottom of Table 2). Both repeats show high uranium values
and.low Th230/U23 ~ activity ratios, but the U23~/U238 ac~ tivity ratios are consistent with the original data. It
has been illustrated in Appendix 4 (Figs li
&
J) that thisparticular coral has undergone partial leaching of its
aragonite skeleton, and that void-filling low-Mg calcite
cement is extensively developed within parts of the coral.
Therefore, the repeat analyses could have been done on
parts of the coral which have a high proportion o·f
void-filling calcite cement; X-ray diffraction analyses were
not ·carried·out on the repeat ·samples.
18
Table 2 . 2 Comparison of Th 2 3 0 /U:l 3 4 Ages of Corals from the Huon
Peninsula, New Guinea (The results of Bloom et aZ.,
Sample No.
(1974) are shown in parenthesis).
Coral species total U U234/U23a
(ppm)
Reef complex III
Th23o10234 Age (x103yr)
74630111 Hydnophora exesa 2.63 ± 0.03 1.15 ± 0.01 0.33 ± 0.01 43 ± 2
(25) (2.53 ± 0.05)(1.13 ± 0.02)(0.32 ± 0.02)(42 ± 3)
74630112
( 3)
Reef corrplex IV
Favia steZZigera 2.48 ± 0.06 1.06 ± 0.02 0.40 ± 0.03 55 ± 5
(2.24 ± 0.05)(1.11 ± 0.02)(0.42 ± 0.02)(58 ± 4) 74630113A Favia paZZida
(4)
2.39 ± 0.04 1.10 ± 0.02 0.40 ± 0.04 56 ± 6
(2.22 ± 0.04)(1.11 ± 0.02)(0.43 ± 0.02)(61 ± 4)
2.47 ± 0.03 1.12 ± 0.01 0.45 ± 0.03 64 ± 4 74630113B
74630114
(14b)
Reef complex VI
Favia speaiosa 2.50 ± 0.03 1.13 ± 0.01 0.69 ± 0.03 122 ± 8
(2.56 ± 0.05)(1.12 ± 0.02)(0.63 ± 0.03Xl07 ± 9)
The samples listed belc:M are repeats of 746 30114
6.11 ± 0.09 1.12 ± 0.01 0.36 ± 0.02 48 ± 3
[image:29.861.96.792.77.1069.2]19
demonstrated that low-Mg calcite that replaces the original
aragonite of the coral skeleton during subaerial diagenesis
had the highest concentration of uranium in the materials
they studied. These values ranged from 2.9 to 5.1 ppm
with a mean of 3.9 ± 0.7 ppm. Conversely, void-filling
low-Mg calcite cement had a uranium concentration lower than
that of the aragonite skeleton (0.8-l.Sppm). They concluded
that this was a result of a decrease in the availability of
uranium in the waters from which the calcite precipitated.
They regarded that the void-filling calcite cement was formed
at a later stage in the diagenetic sequence than the calcite
that replaced the aragonite skeleton. However, Figure lJ
shows that in this case the void-filling calcite cement has
formed before there has been complete dissolution of the
aragonite skeleton. Therefore, the void-filling low-Mg
calcite cement could be expected to have a high uranium
concentration. As this cement would have been formed some
time after the elevation of the coral above sea level, it
would have a lower Th230 /U234 activity ratio than the coral,
and consequently the age determined would be younger than
'
Chapter 3 Th2 3 0
/U2 3 '* Ages of ·corals from the Great
· ·Barrie·r ·Reef
3.1 Introduction
-·
20
Corals from three localities on the Great Barrier
Reef were dated using the Th230 /U234 method. A living
coral from One Tree Island (Fig. 3.1) was analysed in order
to test the closed system assumptions outlined in Chapter
l. Two corals were collected at depth from the reef flanks;
one coral was collected at a depth of 20m from Rock Cod
Shoal, and another was collected at a depth of 17m from
One Tree Island. It was thought that ages of these corals
might be, significant because they were recovered from depths
where coral growth appears to be limited.
Coral samples were provided by the Department of
Geography, James Cook University from drill holes put down
on the fringing reef of Hayman Island (Fig. 3.3). These
corals came from different depths of the drilled interval.
It was hoped that they would provide information on the
various times of coral growth in the Great Barrier Reef
Province.
3.2 Ages of Corals from the Capricorn Group
A living coral from the reef flat of One Tree
Is land was analysed in order to determine (a) that modern
corals have a U23 4 /U 238 activity ratio of 1.15 ± 0.03, thus
.·,
)
21
percent excess of U234 to U238 in the present-day ocean, and
(b) that there is no significant concentration of Th230
initially present in modern corals, and therefore the amount
of Th230 observed in fossil corals has resulted solely from
the radioactive decay of its parent uranium.
The coral analysed (74630100) was a PoaiZZopera sp .•
and the uranium concentration and U234 /U238 and Th230
;u
234 activity ratios are shown in Table 3.1. Both activityratios show that the coral obeys the assumptions mentioned
above, and that they are basically the same Dr modern corals
from other parts of the world (e.g. Veeh, 1966). No Th232
was detected in the coral.
A second coral, an Aaropora species, was collected
from the flanks of One Tree Island at a depth of 17m below
sea level. The coral was collected by a diver, and i t was
definitely in its growth position. The radiochemistry and
age of this sample (74630110) are shown in Table 3.1. The
coral has a high uranium content which is commonly shown by
species of Aaropora. The coral was dated by the Th230/U234
method as being less than one thousand years while the C14
method showed that the coral was modern.
Another coral was dredged from a depth of 20m from
Rock Cod Shoal, a submerged coral bank some 45 kilometres
sout~west of One Tree Island (Fig. 3.1). It could not be
determined i f the coral was in its original growth position,
but as corals do not appear to be growing in great abundance
on the shoa~ at the present time, i t was thought that this
_ if) Tryon Island
:•") North
'·· R~~l
I ,..•'\ I
{ ') 8roomf1~ld
"·~• R~~f
Wilson .{) Island
... ) Wr~ck ""· •· Island
CAPRICORN GROUP
Polmois' R.,l
~-~, Rock Cod
c,_ •• > Shoal
+
0 :- 10 15 20 l<ilometru ~·--~!----~·----··--~·
0 5 10 Nouticol Miles
~·~~·~·_.-·~·~_.~~·
... ·""'\
C .... ~ On~ Tr~r · Island
Lamoni _,..;:.• Rrrf '···
./"''· Fil.uoy 1 .-···; Rrrl
'··-.~·
BUNKER GROUP
- t - ... "
': ) Bau/1 Rttf ...
/~) Hoskyn .:.·· Islands
22
, • .,, Fairfax
· f!."/ Islands
Lady Musgravr ,:7')) Island (~;:.-"
~---~---~---~---J24°00'
Figure 3.1 Reefs of the Capricorn and Bunker Groups, showing location of One Tree
[image:33.861.106.791.73.1065.2]23
Table 3 .1 Radiochemistry and Ages frum the Capricorn Group,
Great Barrier Reef
Sample
Nl..JJiil:>er total (ppm) U
Th230
u
234One Tree Island
Age
(yrs B.P.)
74630100 2.49±0.04 1.15±0.02 <0.001 <500
74630110 4.18±0.07 1.13±0.02 0.006±0.002 <1000
Rock Cod Shoal
74630106 2.64±0.04 1.16±0.01 0.008±0.001 850±100
C14 Age
(yrs B.P.)
>Modern
[image:34.861.99.798.94.1061.2]24
bank. Uranium-series dating shows the coral to be less
than one thousand years old (Table 3.1) and this is
confir-med by a C14 age of 440 ± 120 yr B.P. (ANU-1499).
Although only two samples were collected from the
flanks of two reefs of the Capricorn Group i t would appear
that certain species of corals have been growing at depths
of 17-20m below sea level during the past 500 years.
P.J.
Davies (pers, aomm,) has identified that many of the reefs
of the Great Barrier Reef province grow from a platform at
about 20m below present sea level. This platform represents
an old surface on which the present reefs began growing
during the Holocene transgression. Therefore, corals on
the outer parts of the reef above 20m should be Holocene.
3.3 Ages from the Hayman Island Cores
Hayman Island is the nortre:mnost nernber of the
Whit-sunday Group and it lies some 25 kilometres off the coast of
central Queensland (Fig. 3.2). The island consists of
Cretaceous granite and acid-intermediate volcanics and
Quaternary alluvium. A fringing reef is present around
most of the island and an extensive tract of reef is
devel-oped on its southern sid~ (Fig. 3.3).
A series of six drill holes were put down on the
frin-ging reef at the southern end of the island to test if
the reef was a suitable foundation for an airport runway.
The cores from these drill holes were lodged at the James
Cook University of North Queensland. Unfortunately the cores
con-25
rr---~---~20"
• PROSERPINE
Figure 3.2
CORAL
SEA
REPULSE
BAY
~
q '
v.
WHITSUNDAY GROUP
d1
'
\
~~~.
a
·o.
pLocation of Hayman Island, Whitsunday Gr'oup
[image:36.861.94.794.75.1070.2]26
taining anything up to 3m of material.
The stratigraphy of the cores has been described by Smith (1974). The cores recovered from the reef flat
(RIO) and the reef margin (Rl~ R2 and R5) consist mainly
of solid coral, coral shingle and some beach sand while the cores seawards of the reef margin (R3 and R4) consist of
beach sand, fore-reef sediment and coral shingle (Fig. 3.3).
The cores from the reef margin have carbonate values in excess of 90 percent to a depth of about 20m, but below
this depth the carbonate values are usually lower. It was also noted that from the surface to about 20m the mineralogy
of the cores showed a high aragonite content, but below this depth low-Mg calcite became dominant. Below 20m the strat-igraphy showed a high proportion of calcareous nodules set
in a yellow silt or clay and in some cases the coral showed
signs of iron staining. Smith (1974) interpreted the presence of calcareous nodules and yellow silt and clay as indicative of pedogenic processes. From this she concluded that a
dis-continuity (the Thurber discontinuity~ existed between corals of Holocene and Pleistocene age at about 20-25m. This was
confirmed by C14 dating of material from one of the cores
(Rl). A coral from a depth of 15.0- 16.5m gave a C1 ~ age
of 8,245 ± 285 yr B.P. while a coral from 19- 22m gave a
Cl~ age of~ 39,000 yr B.P.
Previous drillings on Eniwetok and Mururoa Atolls in the Pacific Ocean had shown that there is a distinct time break between the Holocene and the Pleistocene. Cuttings
-·
50m
e DRILL SITE
~ VOLCANICS
~!I GRANITE
R4
~SOLID CORAL
~SHINGLE
R3
74630141
74630142-+ rniDill L 0 W E R
BEACH SAND
D
UPPERR2
Reef FIat
R 1
DEPTH BELOW MLWS
RIO
ZONE OF RECRYSTALLIZATION
& SOl L DEVELOPMENT
~ FOREHEEF SEDIMENT
0
NO RECOVERYFigure 3. 3 Fringing reef at the southern end of Hayman Island showing location of drill holes, and the general stratigraphy within the reef
[image:38.861.99.789.85.940.2]28
Island, Eniwetok Atoll gave Th2 30jU234 ages of 4,500 to
6,600 yrs B.P. while corresponding· C14 ages ranged from
3,800 to 5,900 yrs B.P. Corals from 14.4 to 20.7m gave
Th230 /U234 ages of 100,000 to 120,000 yrs B.P. These ages
were supported by dates from other borings at this depth
on other islands of Eniwetok (Thurber et aZ., 1965) On
Mururoa Atoll corals from sea level to a depth of -6m gave
ages of 5,300 to 8,200 yrs B.P. while coral at -7m gave
Th230 /U234 age of 120,000 yr B.P. (Lalou et aZ., 1966). The
interpretation of this hiatus by both studies was that sea
level was much lower between 120,000 years and the present.
The evidence from the Hayman Island cores suggests
that a hiatus of similar magnitude is present at about -20m.
This is deeper than that observed on Eniwetok and Mururoa,
but a hiatus has been postulated at this depth from Heron
Island in the Capricorn Group (Davies, 1974). However, the
depth to the discontinuity appears to be dependent on the
location of the drill hole in relation to the karst
topog-raphy developed on the subaerially exposed Pleistocene reef
surface. Thorn (pers. aomm.) has found that on Bewick Island
in the Great Barrier Reef province the discontinuity is
present at -3m while en Mururoa Atoll the discontinuity is
present at -11m on Dindon, but i t is at -7m on Colette
(Lalou et aZ., 1966).
Samples of co-re material from Rl and R2 were pr>ovided
by the Department of Geography, James Cook University for
uranium-series dating. The material from core Rl came from
29
depths of 17 to 26m. Apart from the topmost sample from
core R2 (74630134, Fig. 3.3) the coral samples were
exten-sively recrystallized, and as a result, unsuitable for
dating. A further search through the core material
prod-uced two very small samples of coral from core R2 which had
an aragonite mineralogy. One sample came from a depth of
21.5 to 23m and the other was from the interval 29 to 30.5m.
Although the sample weight of the two corals was considerably
smaller than is normally used for uranium-series dating, i t
was decided to try to determine their approximate ages.
The radiochemistry and ages of the corals are shown
in Table 3.2. The topmost sample from a depth of about 17m
gave an age of 8,300 ± 500 yr B.P., and ~his age is
consis-tent with the C14 age of 8245 ± 285 yr B.P. at a depth of
16m from core Rl. This age is significant as i t represents
the approximate time of recolonization of the ancient reef
surface during the Holocene transgression. It is considered
that sea level reached its present position along the east
coast of Australia by about 6,0DO yr B.P. (Thorn and Chappell,
1975). This would indicate that the vertical growth rate of
the Hayman Island reef was of the order of 0.74 cm/yr during
this period.
The two corals which are presumed to come from depths
below the discontinuity give ages that are unacceptable
(Table 3. 2). The sample from a depth of about 22m has a
U234JU238 activity ratio greater than that of modern corals,
and therefore it does not obey the closed system criteria.
The age estimate of 50,000 yrs B.P. is unrealistic in terms
-30
Table 3.2 Radiochemistry and Ages of Corals from
Sample Number
74630134
74630141
74630142
Drill Hole R2, Hayman Island
Depth In-terval (m)
16.8-17.3
21.4-22.9
29.1-30.6
total U
(ppm)
Tll30
u
2342.47±0.04 1.12±0.02 0.074±0.003 8.3±0.5
3.82±0.07 1.21±0.02 0.37 ±0.02 50±5
[image:41.861.96.801.90.1108.2]31
of prevlous eustatic sea level changes. The coral from a
depth of about 30m gives an apparertt age of 10,500 yr B.P.
which suggests that this particular sample came from a
pos-ition higher in the stratigraphic sequence than its
pres-umed position. It seems that this piece of coral had fallen
down the hole during drilling operations.
Since most of the coral below 20m examined in this
study is extensively recrystallized it has been impossible
to determine reliable uranium-series ages from this depth.
Age determinations from Pacific atolls suggest that i t is
possibly 120,000 years old, but until unrecrystallized
cor-als are found i t cannot be concluded that a hiatus of
32
Ch apter 4 Th2 3 o ;·u2 3 4 A f
: · ges rom the Inner Barrier of
New ·sou·th WaTes
4.1 Geomorpho1o·gy ·of the Inner 'Barrier
Systems of multiple bay barriers are a common
geomorphic feature along the central and northern coasts
of New South Wales. Two distinct barrier systems have
been recongised, and they are referred to as the Inner
Barrier and the Outer Barrier according to their position
relative to the hinterland (Thorn, 1965; Hails, 1968). The
two barriers are separated by a distinct hiatus, based on
morphological, stratigraphical evidence and soil
develop-ment. The bay barriers may be as long as 50 kilometres and
they may be up to 8 kilometres wide (Langford-Smith and
Thorn, 1969). The Inner Barrier usually encloses a swamp
which is considered to be a relic barrier lagoon. The two
barriers are separated by an interbarrier depression which
usually consists of a tract of shallow lagoon or swamp. ·The
Inner Barrier extends for almost 1000 kilometres along the
coast north of Newcastle. It attains an elevation of 6 to
9 metres above present sea level, and there is little
var-iation in this height along its entire length.
The Outer Barrier is a Holocene feature that
devel-oped towards the end of the last major transgression. During
this t.ransgres.sion sea level reached its present position
along the east coast of Australia at about 6000 yr B.P.
(Thorn and Chappell, 1975), and it is considered that the
33
for a hiatus between the formation of the two barriers
suggests a major period of lower sea level. The Inner
Barrier was originally thought to have formed during the
last interglacial (Thorn, 1965), but radiocarbon dating
has suggested that it is related to an interstadial high
sea level (Warner, 1971; Langford-Smith in Gill, 1970).
4.2 Previous Ages from the Inner Barrier
Most of the material that has been dated from the
Inner Barrier has been organic material. Driftwood,
fresh-water peat, in situ tree stumps and roots, and humate have
been the types of material submitted for radiocarbon dating.
The original ages from the Inner Barrier on the north coast
of New South Wales were reasonably consistent, with ages
ranging from 21,000 to 35,000 yrs B.P. On this basis the
Inner Barrier was thought to have formed during a high
interstadial sea level at about 30,000 yr B.P. (Warner,
1971; Langford-Smith in Gill, 1970).
This evidence for a high interstadial sea level at
about 30,000 yr BP. gained support from radiocarbon dating
of shell and peat material from other parts of the world
(e.g. Curray, 1961; Shepard and Curray, 1967; Milliman
and Emery, 1968). However, the reliability of many of
these
c
14 ages has been questioned because of thepossibil-ity of contamination of the samples by modern carbon, and
because glaciologic-climatic evidence indicates that sea
level was much lower at this time (Marner, 1971). Bloom
'•
34
as -4lm at this time.
There are good reasons to suspect the c1 ~ ages on
organic material from the Inner Barrier of northern New
South Wales. Apart from the ~ges reported by Warner (1971)
and Langford-Smith (Gill, 1970) other Cl4 ages on driftwood
have yielded both a background count and a finite age of
42,000 yr B.P. (Thoro, 1973) •. In one case where the organic
material of one of the original samples was broken down
into its various fractions, three different ages were
ob-tained. These varied from 11,100 to 35,200 yrs B.P.; the
original sample had an age of 21,400 ± 250 yr B.P. (Them,
1973). In this case i t is apparent that there has been
contamination by younger organic material.
The only published age so far on shell material
from the Inner Barrier is from a specimen of AnadaPa
coll-ected from 15m below mean sea level (MSL) at Grahamstown
near Newcastle (Thorn, 1965). This sample gave a C14 age of
>33,000 yr B.P.
Therefore, although a co~siderable number of age
determinations by the Cl 4 method have been made on material
from the Inner Barrier (at least twenty), some have not
yielded definite ages while o.thers can be regarded as being
too young because of contamination. The discovery of corals
from.the Inner Barrier of New South Wales, at two separate
localities, provided an opportunity to check the reliability
of the C14 ages by using the Th230 /U234 method.
35
Corals were recovered from the Inner Barrier at two
localities. The first discovery was made during the
buil-ding of an embankment at Grahamstown, near Newcastle. The
second discovery was near Evans Head on the north coast of
New South Wales.
4. 3.1 Grahamstown Embankment
The Inner Barrier that forms part of the Newcastle
Bight Embayment barrier system (Thorn, 1965) abuts bedrock
at a number of places, and it also blocks off several
swamps (Fig. 4.1 ). Such a situation occurs where the
Grahamstown Swamp is blocked at its eastern end by the
Inner Barrier; at this bcality bedrock, swamp, and barrier
are in close proximity. The Grahamstown Swamp was recently
converted into a water storage area, and the innermost
ridge of the Inner Barrier was built up to form an
embank-ment. During investigations of this site a number of corals
were recovered from a depth of about 7m below MSL. The
corals consist of two species, GoniopoPa Zobata(M.E.H.)
and B las tomus sa we Z Zs i (Wij sman-Best, 19 7 3).
The general stratigraphy of the area shows that
the Quaternary sediments form.a seawards thickening wedge,
and that these sediments are representative of a number of
facie.s (Fig. 4. 2 ). The basal section consists of sands
and gravels of fluvial origin overlain by clays and sandy
clays, locally interbedded with sands and shelly sands.
The latter sequence is considered to be estuarine in origin
trans-"'
z
Ill:
"" Ill:
a:
I ct IIIII
:::l > a: :::l
...
""...
:::l...
C[ 0
..
a.:tTI
' E]0 A. p IIIII ~z 111110 IIIII-c"'
I l l :
a: IIIia. "'"' t-0 z [] . IIIII Ill
-IIIII IIIII C[ Ill IIIII "' z z[31 •
...
I C( ~"'
~ E -" ... 0 :.lb)-...
...
C[ v 0~ ..I v ..I 0 C[
a: a:
Q
0
""
IIIII v
rt!l
-tc
(,.) ):._l
.j-J <1)
f(j ·rl
r-1 >"-•
>:-. 4-, ru
0 p::j
h >".-l () <1)
·rl !=: .j-J c.
•{I H
0
0 1,~)
,-( .-···1 ,
..
j~
t;.()
h (_'~
h
·r-1 0
, .. }'-i
::) lJ I
·.-J
·r.
'"·~--t
1\) 1 "i
(jJ •i:l
f:-1 u
n.J C>
r l
1--1
~_; r-l
<ll ru
~ ):._j
:>-.o
rd U
,.Q
~ Q)
~..c:
-~
1J ..c:ra
b.OS::
• r-1 rtl c:Q
Q) Ul rl<l)
+J ~ .•
Ul ::J rtl -IJ
u rtl
8: Q)
QllH
~ w
....
:::::> 0...
Q)...
...
0 ..0 01: w -01: ~ <( ~ ~ wz
z
...
Q)-
c c 0"'
"'
Q)...
Cl.
Q)
c
Figure 4.2
V) 0 z ct V) w z :::> 0 z < _, 0 w < E 0 Ct: w 1-:::> 0 I II) 0 z ct II) w > a:: w z z I II) 0 z < II) w > II) II) w a:: C) w a:: Ct: w z z I V) 0 z < V) w > V) V) w Ct: C) V) E 0 0 0 z < Ct: 1-37 w z >- 1-_, < U·
0 _,
[image:48.876.94.791.60.1056.2]38
gressional unit consisting of grey to grey-brown sands
with some shells. Some of the molluscs (e.g. Periglypta
sp., Fragum sp. and Gomphina sp.) have living counterparts
in Queensland wate~s, but they have not been found in New
South Wales (Iredale, 1951). The corals were recovered
from near the base of this unit. The marine sands are
overlain by well-sorted sands impregnated with orgahic
colloids and locally indurated. These sands are considered
to represent a nearshore-beach facies. Lying on top of
these are leached aeolian sands that form the dune or
beach ridges (Thorn, 1965, Fig. 2).
4.3.2 Evans Head
Corals from this locality occur on the southern
bank of the Evans River at about present sea level (Fig.
4.3). The corals were found on the western margin of the
Inner Barrier. Pickett (1974) considered that the corals
rested on bedrock that flanked the estuarine plain of the
Richmond River system. He based this assumption on the
presence of a ridge of Triassic sediments of the
Clarence-Moreton Basin extending northwards to this point. However,
R. McLean, P. Roy and B. Thorn (pers. aomm.) discovered
in situ corals which had grown on a substrate of lagoonal
or estuarine sandy muds. It would appear, however,that at
this locality, and at the Graharnstown locality, the
pres-ence of bedrock near the coral sites had some influpres-ence on
the colonization and growth of the coral community.
•
Figure
1 Locality Cora
0
er Barrier
Inn . Sediments
Back Barraer
Alluvium
Bedrock
4. 3 of the Evans Head the Map locality onits coral . er and
Rl v ' . I' Evans Barrle the Inner
39
4km
wing the area sho k of the
th
ban 'th
SOU h'p Wl
40
4.4 ) shows 2.3m of reddy brown sandy clay (A) extending
from the top of the river bank to just below the high
water tidal level of the river. Below this there is 30cm
of light grey clay (B), followed by a fine-grained,
well-sorted sand with ironstone modules up to 2 em in diameter
and scattered coral fragments incorporated (C). The coral
fragments are considered to be reworked from the horizon
below it. This unit (D) consists of coral rubble and
moll-usc shells in a dark grey sandy mud. Most of the corals
are fragmented, and they often show signs of extensive
solution. However, 20 metres downstream from the main
site, corals which are definitely considered to be in
situ, even though there is no hard substrate,were discov-
.
~
ered. Below the coral horizon there is a grey clay (E),
becoming sandy near the base, which contains shell and some
coral fragment. Below this, at about mean low water level,
there is 30 +em of coral debris (mainly AaPopora sp.) and
shell fragments set in an olive grey clay matrix.
The fauna present within the sequence consists of
corals, bryozoa, gastropods, pelecypods, and algae. The
coral fauna is quite varied, there being at least~elve
different genera. Pickett (1974) considered that the
corals came from several localities as some are abraded
while others are not. Although many of the same species
form living communities around the Solitary Islands to
the south (Veron, 1974), Pickett (op. ait.) cites the
presence of SePiatopoPa hystrix (Dana) as possible evidence