International Journal of
ELECTROCHEMICAL
SCIENCE
www.electrochemsci.org
The Oxygen Evolution Reaction on Passive Oxide Covered
Transition Metal Electrodes in Alkaline Solution
Part II - Cobalt
Michael E. G Lyons*, Michael P Brandon
Physical and Materials Electrochemistry Laboratory, University of Dublin, Trinity College, Dublin 2, Ireland
*E-mail: [email protected]
Received: 21 October 2008 / Accepted: 6 November 2008 / Published: 17 November 2008
Details are outlined of an electrochemical investigation of the oxygen evolution reaction (OER) at passive oxide covered polycrystalline Co electrodes in aqueous alkaline solution. Kinetic studies on electrodes subjected to different pre-treatment routines, yielded different values of the Tafel slope and the reaction order with respect to OH- activity. Only one mechanistic pathway could account for all
observed values of these kinetic parameters. This pathway is similar, although not identical, to that proposed, in the first paper of this series, for the reaction at oxide covered Ni anodes. Using cyclic voltammetry it was shown that the mechanism for the initial passivation of Co electrodes varies with OH- concentration. This in turn can have an effect on the experimental value of the OER Tafel slope, a
phenomenon which can be rationalized in terms of a dual energy barrier model.
Keywords: oxygen evolution electrocatalysis, oxidized cobalt electrodes, transition metal electrochemistry, oxygen evolution mechanisms, dual barrier model
1. INTRODUCTION
solution. The present article details the application of the same techniques to the investigation of the reaction at anodic oxide covered polycrystalline Co anodes. In the concluding part of the series, attention will be devoted to Fe electrodes, and also discussed, will be the relative activities of the passive oxides of the three metals for the OER.
In contrast to the significant body of work that exists on the OER at Ni anodes, we have found only one comprehensive [2, 3] and two less detailed [4, 5] reports on the reaction mechanism at Co electrodes. The authors of two of the aforementioned works [2, 5] propose (different) modified Krasil’shchikov reaction schemes, on the basis of their experimental electrochemical kinetic data. Recall, from the first article of the present series, that the most general form of the OER reaction mechanism originally due to Krasil’shchikov [6] can be written as:
S OH+ − →SOH e+ − (A I)
2
SOH OH+ − →SO−+H O (A II)
SO− →SO e+ − (A III)
2
2SO→2S O g+ ( ) (A IV)
where, S represents a catalytically active site for the reaction.
This preference for reaction mechanisms of the Krasil’shchikov family, in the description of the OER on cobalt(-oxide) electrodes, mirrors the situation that prevails in the established literature regarding the reaction at nickel(-oxide) anodes. However, in a rigourous study [1], during which, particular emphasis was placed on the determination of reproducible [OH-] reaction order data, we found that the Krasil’shchikov pathway is not suggested for the OER at passive oxide covered Ni electrodes in aqueous alkaline solution, despite its popularity in the literature. In view of the aforementioned, we set about ascertaining, whether this is also the case for Co anodes, and whether the physisorbed peroxide type mechanism that we favour for the OER at Ni electrodes [1] is also viable for the reaction at a passive oxide covered Co surface.
2. EXPERIMENTAL PART
2.1. General comments
Much of the experimental details are identical to those outlined in our previous article [1] on the OER at Ni electrodes, and it is therefore unnecessary to repeat them in any great detail. As before, a standard three electrode cell arrangement was employed. All electrolyte solutions were prepared from NaOH pellets (BDH AnalaR®, minimum 98% purity) using millipore water (resistivity
suite. Electrode roughness factors were estimated using the OHads desorption method of Ho and Piron
[6] – a schematic diagram of the appartus for such measurements was also included in the previous article [1].
2.2. Electrode preparation and pre-treatment
One point that does require explicit discussion is the preparation and pre-treatment of the working electrodes. The electrodes were prepared from a polycrystalline Co wire, diameter 2mm, purity 99.9+%, as supplied by Aldrich. An appropriate length of wire was cut, and the cross section was filed back until a flat circular surface was achieved (geometric area = 0.0314 cm2). The piece of wire was then washed with copious de-ionised water, polished thoroughly with a slurry of 0.05 micron alumina powder, degreased with acetone, and washed again with de-ionised water. Following this, a length of copper wire was wrapped around one end of the electrode metal wire using a pliers. Conductive epoxy (Circuit Works (CW2400)) was applied to the junction between the two wires, to guarantee good ohmic contact. When this bond had matured, the wire was completely sealed, using epoxy (Araldite®), into a regular vertical glass tube, with care taken to ensure that the circular disk of metal to be exposed was in line with the end of the tube. Following the hardening of the epoxy, it was polished back, using fine grit paper, to expose the circular metal surface. This surface was polished successively with 1200 grit carbimet paper and an alumina slurry until a “mirror bright” finish was achieved.
Experiments were performed on Co electrodes subjected to three different pre-treatment regimes. For clarity these will be referred to as Co electrode “types” A – C, where we define:
• Type A: Here a Bright electrode was polished in a slurry of 0.05 micron alumina powder, rinsed in de-ionised water and used directly in this condition.
• Type B: This refers to what will later be described as an “extremely aged” Co electrode. This is a Co electrode that has been electrochemically aged by its use in many (> 40) OER polarization experiments, at high anodic potentials. Although the electrode has a “bright” appearance similar to Type A, it will be shown that its characteristic CV is somewhat different, and that it yields different values of experimental kinetic parameters in OER steady state polarisation measurements. Before use “type” B electrodes were polished in the same manner as “type” A electrodes.
2.3. Reference electrode
A mercuric-mercuric oxide reference electrode (Radiometer Analytical, cat no. XR400) was used throughout the present study. As we have previously discussed [1], the equilibrium oxygen electrode potential is is 0.303 V vs. Hg/HgO in the same solution. It is common practice in the literature [2, 7, 8] on the OER, to express potential in terms of the oxygen overpotential, η, when the reference electrode is a Hg/HgO electrode in the same solution as the working anode. In this case η is related to the voltage Emeas measured on the Hg/HgO scale as follows:
η = Emeas – 0.303 V (at 25ºC) (1)
For the sake of consistency it was elected to use Hg/HgO, 1M NaOH, as the universal reference standard in this work. It is therefore appropriate to plot polarisation curves on an oxygen overpotential, η, scale, in cases where all the data has been recorded in 1.0 M NaOH solution. This approach is useful for comparing the OER catalytic performance of an electrode, with that of other anodes reported in the literature.
When used in NaOH solutions of different concentrations, the potential of the Hg/HgO electrode was checked relative to a second Hg/HgO, 1 M NaOH electode, both before and after the experiment. No significant potential drift was noted after such experiments, implying that the concentration of the NaOH in the reference electrode chamber remains effectively constant over the time scale of typical polarisation measurements (ca. 2 – 3 hours). In any case, the 1M NaOH solution in the reference electrode, was changed regularly to ensure experimental consistency. Graphs containing data recorded in electrolyte solutions other than 1.0M NaOH, are plotted in terms of the potential, E, vs. Hg/HgO, 1M NaOH. Finally it is noted that a platinum wire electrode (CH Instruments, Inc. -catalogue no. CHI 115) was employed as the counter electrode.
3. RESULTS AND DISCUSSION
3.1. The electrochemistry of cobalt electrodes in aqueous alkaline solution
A prominent theme in our previous article on the OER at passive oxide covered Ni electrodes, was the influence of the oxide properties on the electrode catalytic activity. To understand the OER at a particular oxide electrode, it is essential to understand the surface electrochemistry of that oxide. In light of this, a short review is now provided, on the nature of the passive oxide formed on Co electrodes in alkaline solution.
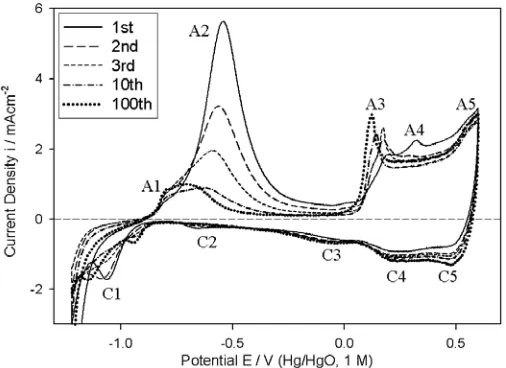
Figure 1. Analytical cyclic voltammograms (CVs) (cycle number as indicated in the legend), recorded at 40 mVs-1, of an initially bright, fresh, polycrystalline (i.e. “type”A) Co electrode in 1M NaOH solution. All CVs were recorded between –1.22 V and 0.6 V at 25°C. The intervening cycles were performed between the same limits at 300 mVs-1.
These voltammograms are very similar in appearance to others presented in the literature for this system [5, 9-13]. Regarding the interpretation of the various peaks in such CVs, there appears to be fairly good general agreement between the various workers who have tackled this problem [5, 9-13]. The approach adopted in most of the latter works is based on that of Behl and Toni [9] who compared the observed peak potentials with thermodynamic data. Thus, peak A1 is attributed to the formation of adsorbed OH species on the electrode surface:
ads
Co OH+ − →CoOH +e− (2)
The major peak, A2, is attributed to a combination of the formation of a passivating film of Co(OH)2 and/or CoO:
Co+2OH− →Co OH( )2+2e− (3)
Co 2OH CoO H O2 2e
− −
+ → + + (4)
and, on the basis of the results of ring disk electrode measurements [9], a dissolution process forming a soluble Co(II) species, possibly [5] CoO·OH-:
2 . ( ) 2
Co+ OH− →CoO OH aq +H++ e− (5)
charges associated with this set of corresponding anodic and cathodic peaks in 0.5M NaOH at 298 K, became unity after ca.15 cycles in the potential range of approximately –1.125 to -0.325 V (vs. Hg/HgO). Similar observations were made by other workers [5, 13, 14]. This behaviour has been attributed to the stabilisation of the developing anodic film with respect to the dissolution process of (5), so that after a number of cycles the anodic peak in the potential region of –0.6 to –0.8 V (Hg/HgO) should be almost entirely due to a solid state process.
The rather poorly distinguished peaks A3 and A4 are attributed to the oxidation of Co(II) species to Co(III) species. Burke and co-workers [5] commented that in view of the large background currents in the region of these peaks, the likelihood is that a hydrous Co(II) film is gradually converted to Co(III) containing species such as Co3O4, Co2O3 and CoOOH. They point out that, the situation is
further complicated by a number of other factors, such as the existence of three forms of CoOOH, i.e. CoOOH(I), CoOOH(II) and CoHO2. Gomez Meier et al.[11] also allude to the complex hydrous nature
of the anodic oxide formed on Co in alkaline solution. These authors view the oxide growth process in terms of the formation of “sandwich-type” structures, with a Co/CoO/Co(OH)2 “sandwich” formed at
ower potentials. They then envisage the oxidation of a hydrous form of this “sandwich” to form a new hydrated “sandwich” structure at more positive potentials (peak A3), according to the process,
[
Co CoO CoOOH xH O( )( . 2 )] [
Co CoO CoOOH yH O( )( . 2 )]
H zH O e2+ −
→ + + + (6)
where z=x+y. The nature of the “sandwich” will further change with increasing potential, with the CoO component being oxidised to Co3O4. According to this viewpoint, peak A4 will then correspond
to a process along the lines of:
[
Co Co O CoOOH( 3 4. )]
2H O2[
Co CoOOH( )4]
H e+ −
+ → + + (7)
Ellipsometry measurements [15, 16], on electrochemically generated passive films on Co in alkaline solution, lend support to the idea of a “sandwich” structure. The most general conclusion of these studies was that cobalt forms two types of passive layers in alkaline solution. The first is formed at lower potentials, has a pH dependent thickness, and consists of Co(OH)2 and CoO. A second passive
layer is formed outside the Co(II) layer at potentials above ca. 0 V (vs. Hg/HgO) and is envisaged to consist of Co(III) and possibly Co(IV) species. X-ray photoelectron spectroscopy (XPS) measurements by Foelske et al.[17] on polycrystalline Co in 0.1 M NaOH, also emphasise the concept of a twin layer type passive film. Below the potential region corresponding to peak A3 in our Fig. 1, the passive layer is described as being a Co(OH)2 film, which can grow to 40 nm thickness, depending on time and
potential. At potentials anodic to peak A3 the outer layers of the film are said to be dominated by Co(III) species, with the XPS measurements identifying Co3O4 and CoOOH. The “sandwich” type
model for the passivation of Co in alkaline solution is reminiscent of the duplex layer model for the metallic electrode/oxide/solution structure that was proposed by Burke and co-workers [18, 19]. In this approach the oxide film is envisaged to consist of an inner compact anhydrous layer, MOx, and an
applied by the present authors to the passivation of polycrystalline Fe electrodes in alkaline solution [20, 21].
Most workers [5, 11-13] agree that peak A5 is due to a surface Co(III) to Co(IV) oxidation. Mössbauer spectroscopy studies [22] have verified the view that at high anodic potentials, the outer surface of a CoOOH film is oxidised to a Co(IV) state. The relatively small amounts of charge associated with the cathodic peaks of Fig. 1 during the early potential cycles, indicates that the initially formed passivating film is not easily reduced. Peak C5 arises from the reduction of the surface Co(IV) species to the Co(III) valance state. Peak C4 and the broad ill-defined cathodic peak C3 are generally attributed to the reduction of Co(III) species [5, 9-14]. The well-defined C1 peak is associated with the reduction of Co(II) species [5, 10, 12, 13].
3.2. The variation of the initial passivation mechanism with hydroxide ion concentration
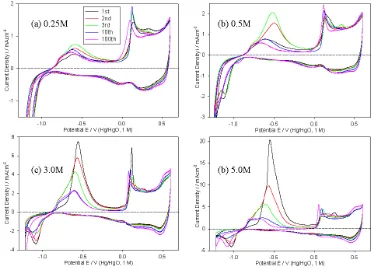
The surface redox chemistry of cobalt as a function of hydroxide ion concentration was subjected to a detailed exploration. Consequently, repetitive potential cycling experiments, identical in procedure to those depicted in Fig. 1 for 1 M NaOH, were conducted at a range of other electrolyte concentrations in order to more completely characterise the passivation of Co electrodes in aqueous alkaline media – the results are reproduced in Fig. 2. While the data presented here, may seem more relevant to an article on the (oxy-)hydroxide electrochemistry of Co, we believe that it illustrates an important aspect of the initial passivation of the metal, that will in turn assist in the interpretation of OER steady state polarisation data for Co anodes.In the case of Fig 2 (c) and (d) a broad symmetrical anodic peak (A2 if we retain the previous nomenclature), with a peak potential of ca. –550mV, is noted in the first few voltammetric cycles. The magnitude of this peak diminishes rapidly from cycle to cycle over the first number of cycles. As discussed in the previous section, this behaviour is believed to be due to a dissolution process, which is significant in the initial formation of the inner region of the passivating oxide film via a dissolution/precipitation mechanism. By the 10th cycles of Fig 2 (c) and (d) the developing oxide film has apparently become stable with respect to the dissolution reaction, and the redox peak in this potential region at this stage, is principally related to the oxidation, by a solid state electrochemical process, of Co to Co(II) species, probably at the metal-oxide interface.
dissolution/precipitation mechansim becomes progressively more significant in the initial passivation of bright Co electrodes with increasing OH- ion concentration in the range 0.25 M ≤ [OH-] ≤ 5.0 M.
Figure 2. Analytical CVs (cycle number as indicated in the legend) recorded at 40 mVs-1 of a “type”
A Co electrode in (a) 0.25 M, (b) 0.5 M, (c) 3M and (d) 5M solutions of NaOH. All CVs recorded between –1.22 V and 0.6 V at 25°C. The intervening cycles were performed between the same limits at a sweep rate of 300 mVs-1.
[image:8.612.117.491.130.401.2]terms of a rapid precipitation of the soluble Co2+ species, with the result that much of the soluble species couldn’t escape to the bulk solution and register a ring current. In 0.1 M NaOH no soluble species were detected by SECM, indicating a solid-state oxidation mechanism, in the less concentrated solution.
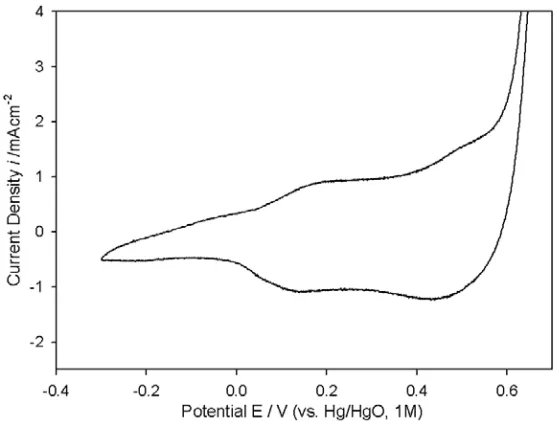
A final relevant point in relation to the surface electrochemistry of the passive oxide, is illustrated by the voltammetric data of Fig. 3. Examining the anodic sweep, it is evident that the rising edge of the OER current, develops from the redox peak associated with the surface Co(III) to Co(IV) oxidation process. This is analogous to the situation that prevails at anodic oxide covered Ni anodes [1] in alkaline solution, where the onset of significant OER current, appears just anodic to the Ni(II)→Ni(III) redox peak. In that case Ni(III) surface species are identified as the catalytic sites for oxygen evolution – it is therefore resonable to suggest that Co(IV) species provide the active centres for the reaction in the case of passive oxide covered Co electrodes. Tetravalent Co species have also been proposed to be the catalytically active sites towards the OER, for electrodes consisting of cobalt oxides (cobaltites) prepared by various means [24-26].
Figure 3. First voltammetric cycle of a “type” A Co electrode in 1.0 M NaOH solution (scan rate 40 mVs-1), indicating that, on the anodic half cycle, the OER current rises from the Co(III)→Co(IV) oxidation peak.
3.3. Co electrode ‘type’ A
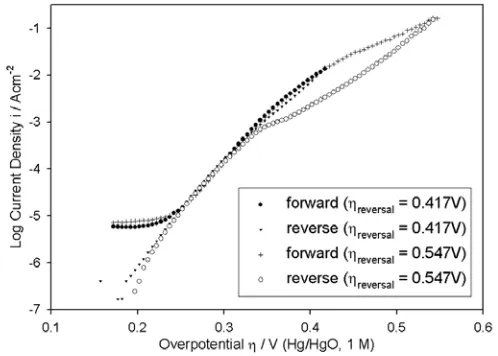
[image:9.612.157.437.316.527.2]As discussed elsewhere [1], our approach to steady state polarisation experiments has been to record data, initially in the anodic direction over the course of several hundred mVs in the potential region of significant OER current density, before reversing the sweep direction and continuing measurement down to the potential at which the net current becomes cathodic. The results of two such experiments, with different upper reversal overpotentials, conducted on a “type” A Co electrode in 1.0 M NaOH are presented in Fig. 4. As we also observed for bi-directional OER steady state polarisation curves recorded for Ni electrodes [1], there is hysterisis at higher overpotentials between the forward and reverse scans. Furthermore, the severity of the hysterisis is evidently a function of the upper reversal potential. Similar hysterisis was observed in the polarisation curves for each of the NaOH electrolyte solution concentrations employed in the study. It is worth noting that bi-directional logi – η plots, very similar in appearance to those of Fig. 4, were recorded by Willems, Kobussen and co-workers [2] for the OER on polycrystalline Co electrodes in KOH solutions of various concentration. In fact the only useful discussion, that we have encountered in the literature, of hysterisis effects in OER steady state polarisation data, was provided by the same workers [27], albeit for a different electrode material (La0.5Ba0.5CoO3). Consistent with our work on Ni [1], we have taken the view, that
[image:10.612.179.428.363.541.2]kinetic mechanistic analysis is most reliably performed on polarisation data in regions of potential, where the forward and reverse scans are largely coincident.
Figure 4. Comparison of two bi-directional, iR corrected OER steady state polarisation curves recorded for “type” A Co electrodes in 1.0 M NaOH solution, initially in the direction of increasing potential, at 25°C. The scan direction was reversed at an overpotential of 0.417 V in one experiment and at 0.547 V in the other. Otherwise all conditions were identical.
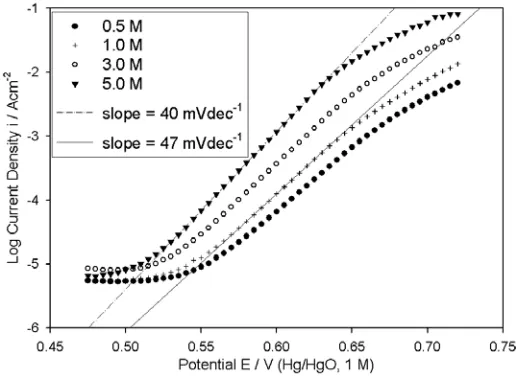
In view of this, a series of iR compensated steady state polarisation curves, recorded at lower oxygen evolution overpotentials (first scan in the direction of increasing potential) for “type” A electrodes are presented in Fig. 5. It is clear that the Tafel slope, b, increases with decreasing OH
-activity, varying from 40 mVdec-1 in 5.0 M NaOH to 47 mVdec-1 in 1.0 M NaOH. The slope of
observed for the OER at a polycrystalline Co electrode in 4.85 M KOH [2]. The Tafel slope of 47 mVdec-1 noted in the present work, also agrees with a previous literature report [4], where b = ~46 mVdec-1 was noted for oxygen evolution on a Co anode in 1 M KOH at room temperature.
Figure 5. iR corrected OER steady state polarisation curves recorded in the direction of increasing potential for a “type” A Co electrode in NaOH solutions of various concentrations at 25°C.
The observed variation in b with [OH-], implies, that for a given applied potential, the electrical
contribution (via the exp(αηF/RT) term of the Tafel equationa) to the reaction rate depends on the
electrolyte concentration. Conventionally, a change in Tafel slope is indicative of a change in reaction mechanism, or in rate determining step (RDS) within the reaction pathway – an alternative explanation will however, be forwarded later in the article. For the moment, it is noted that a meaningful value of the OH- reaction order, m
OH-, cannot be extracted from the polarisation data of Fig. 5, owing to the aforementioned variation in b.
3.4. Co electrode ‘type’ C
Figure 6. iR corrected OER steady state polarisation curves recorded in the direction of increasing potential for a “type” C Co electrode in NaOH solutions of various concentrations at 25°C.
3.5. Co electrode ‘type’ B
As discussed above, steady state polarisation measurements on “type” A Co electrodes yielded reproducible logi – η plots, like those presented in Fig. 5, over the course of approximately 15 experiments following the initial preparation of the anode. In subsequent measurements, the value of i recorded at a given applied potential, for a given electrolyte concentration, became progressively less reproducible, while increases of ~ 3 – 5 mVdec-1 were noted in the values of b at all concentrations, relative to the data presented in Fig. 5. After ~30 experiments, the level of reproducibility diminished further, with, for example, different values of b, anywhere in the range of 50 - 60 mVdec-1, being observed over the course of several succesive polarisation runs in 1.0 M NaOH. New limiting reproducible polarisation behaviour became obvious after ~40 experiments, with a lower overpotential Tafel slope of ~60 mVdec-1 being noted over a range of electrolyte concentrations.
Figure 7. Reaction order plots based upon the polarisation curves of Fig. 6 at potentials of 595 and 605 mV in the ca. 46 mVdec-1Tafel slope potential region.
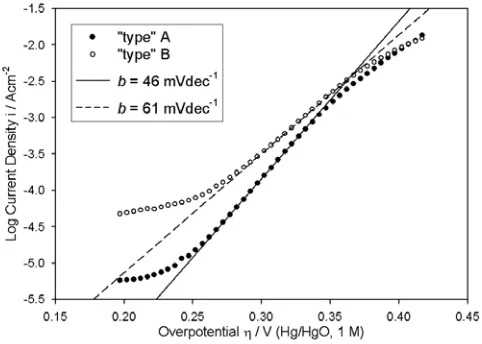
Figure 8. iR corrected OER steady state polarisation curves recorded in the direction of increasing potential on the same Co electrode specimen, aged to different degrees, in 1.0 M NaOH solution at 25°C.
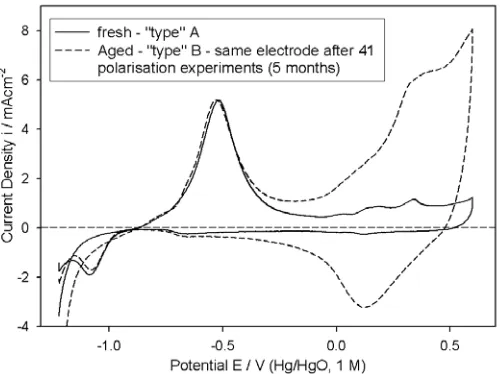
[image:13.612.184.425.314.486.2]Figure 9. Cyclic voltammograms, characterising the surface electrochemistry of the initially bright Co anodes, on which the steady state polarisation curves of Fig. 8 were recorded. The above CVs were recorded in 1.0 M NaOH between –1.22 and 0.6 V, with a scan rate of 40 mVs-1 at 25°C.
It should be emphasised at this point, that following all polarisation experiments performed on the electrode characterised in Fig. 9, it was polished, rinsed and dried (in soft tissue paper). Unlike Ni, which retains its bright metallic finish throughout the course of oxygen evolution polarisation measurements, a dark brown coloured oxide film forms on Co, when polarised at high anodic potentials. This film was apparently readily removed by polishing, so that the electrode appeared visually similar prior to voltammetric characterisation, with a bright “mirror” finish, both when it was fresh (“type” A) and aged (“type B). However it is evident from Fig. 9, that there are significant differences in the surface electrochemistry of the two “types” of electrode. The only reasonable interpretation that we can devise for the large increase in Q with ageing, is that a residual oxide layer, resistant to removal by mechanical polishing, builds up slowly with electrode usage. It is the redox transitions of the outer regions of this film that leads to the enhancement of Q for the aged electrode relative to the fresh anode. This effect may be associated with increasing surface inhomogeneity and roughness, that would be expected to accompany the continous cycle of oxide formation in polarisation experiments, and subsequent removal by polishing. Clearly, the less smooth and homogeneous the metal surface, the more difficult is the removal of oxide adjacent to that surface by abrasive polishing techniques. In any case, we have also observed effects, that we have attributed to polishing resistant residual oxides, in the cases of Ni1 and Fe21 electrodes.
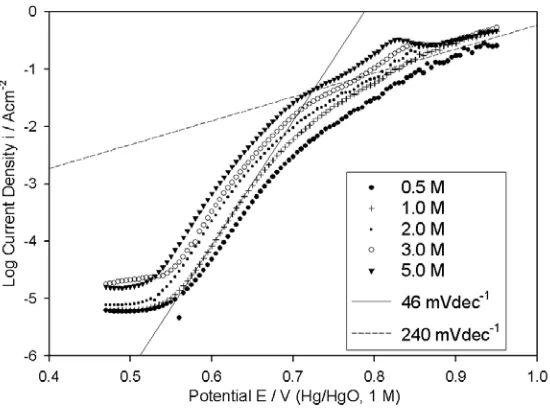
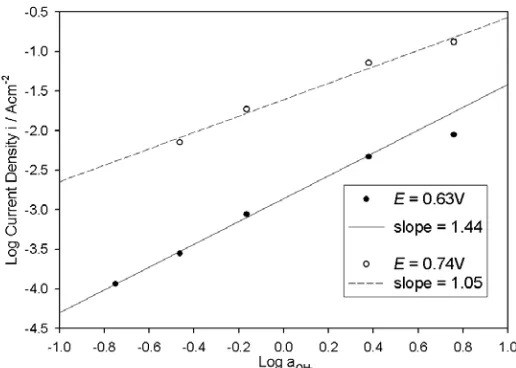
IR corrected OER steady state polarisation curves, recorded for a “type” B Co electrode in NaOH solutions with concentrations ranging from 0.25 – 5.0 M, are presented in Fig. 10. As discussed above, a Tafel slope of ~ 60 mVdec-1 is evident at lower overpotentials. In addition, it is apparent that a
second straight-line region exists at higher overpotentials, with a Tafel slope approximately twice that of the lower η slope. Reaction order plots, for both Tafel regions are constructed in Fig. 11. Note that the value of b, at lower overpotentials for the data recorded in the 5 M NaOH solution, is significantly less than 60 mVdec-1, and has thus been disregarded in the graphical determination of m
linearity was observed in reaction order graphs, plotted for several values of E in the upper Tafel region (including E = 0.74 V depicted in Fig. 11), however the overall (allbeit cautious) impresssion was that mOH- was smaller than for the lower Tafel range, tending to approximately unity. It can therefore be concluded, that the OER polarisation behaviour for a “type” B Co anode, is characterised by b = ~60 mVdec-1, mOH- = ~3/2 at lower η, and b = ~120 mVdec-1, mOH- = ~1 at higher η.
[image:15.612.181.432.163.347.2]Figure 10. iR corrected OER steady state polarisation curves recorded in the direction of increasing potential for a “type” B Co electrode in NaOH solutions of various concentrations at 25°C.
Figure 11. Reaction order plots based upon the polarisation curves of Fig. 10 at potentials of 0.630 and 0.740 V.
3.6 Electrochemical impedance spectroscopy (EIS) measurements
[image:15.612.176.434.418.602.2](complex plane) format in Fig. 13. The impedance responses of passive oxide covered Co (and indeed Ni and Fe) electrodes in the oxygen evolution potential region and the appropriate choice of equivalent circuit model will be discussed elsewhere [28] – here we restrict our treatment to aspects of the EIS data related to the kinetics of the OER and to roughness factor determination.
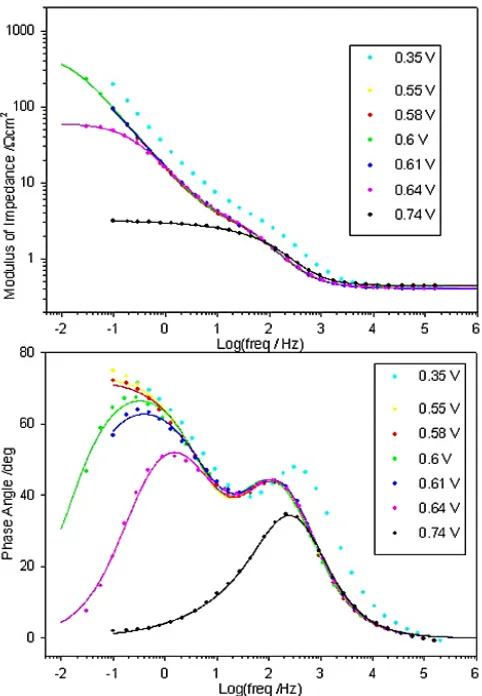
Figure 12. Bode plots recorded at various potentials for a “type” C Co electrode in 1.0 M NaOH solution at 25°C. The raw data is represented by the dots. The continuous lines are the results of CNLS fits to the equivalent circuit model of Fig. 14.
simulate frequency dispersion in the experimental capacitive response. The impedance, ZCPE, of a capacitive process displaying frequency dispersion is expressed as:
ZCPE = A j
( )
ω −α (8) [image:17.612.184.417.224.556.2]In equation (8), A = 1/Cα=1, where Cα=1 is the value of the capacitance in the absence of frequency dispersion, and α is an exponent (α ≤ 1 for a physically reasonable situation) equal to unity in the case of an ideal capacitor. The result of a CNLS fitting of raw impedance data to a CPE using the SIM program, is an output in the form of optimised values for Cα=1 and α.
Figure 13. Nyquist representation of the impedance data presented in Fig. 12. As before, the raw data is represented by the dots, while the continuous lines are the results of CNLS fits to the circuit of Fig. 14. The lower plot is a reproduction of the higher plot at a higher resolution, with the purpose of showing the high frequency data more clearly.
Figure 14. Equivalent circuit model used in the CNLS fitting of the impedance data of Figs. 12 and 13.
In comparison with the impedance data that we have previously presented [1] for the OER occurring at Ni anodes, there is superior temporal resolution between the high frequency (τhf = RpCdl) and lower frequency (τlf = RsCø ) relaxation processes in the case of the “type” C Co electrode. This is manifested in Fig. 12 by the fact that two sets of maxima are evident in the phase angle vs. log frequency plot. The higher frequency set, that appear between 102 and 103 Hz, are indicative of the
overall impedance response being dominated by the double-layer capacitance contribution over this frequency range. The lower frequency maxima appear at frequencies where the adsorption pseudo-capacitance is dominant. By contrast, the corresponding plot for Ni electrodes at lower OER overpotentialsis characterised by one broad peak, which is in fact a superposition of the frequency dependent phase angle characteristics of the two individual relaxation processes. The observation of two distinct pseudo-semi-circular regions in the Nyquist plots of Fig. 13, compared to just one in this represenation for the EIS response of Ni anodes [1], again points to the greater difference between the low and high frequency time-constants for anodic oxide covered Co electrodes, relative to similarly passivated Ni electrodes.
Table 1. Optimum fit parameters for the CNLS fitting of the data of Figs.12/13.
E V
Rs
Ωcm2
Rs %
Error
Cø
mFcm-2
α Rp
Ωcm2
Cdl
µFcm
-2
α RΩ
Ωcm2
0.55 --- 2.484 0.82
0 3.95 5 749.94 0.82 5 0.412
0.58 --- 2.209 0.80
4 3.73 5 746.50 0.82 5 0.413
0.6 503.60 22.0 2.515 0.83
5 4.41 1 729.89 0.80 7 0.414
0.61 407.15 24.8 1.775 0.78
4 3.91 1 695.83 0.82 0 0.405
0.64 56.58 3.2 2.059 0.80
7 4.01 2 699.65 0.81 9 0.411
0.74 1.05 2.6 1.631 0.52
[image:18.612.149.473.505.700.2]This greater separation of the characteristic time constants, τhf and τlf, for Co relative to Ni electrodes, arises primarily because τlf is significantly greater for the former. This is in turn related to the fact, that for a given oxygen evolution overpotential, the adsorption pseudocapacitance as characterised by EIS measurementsb, is greater for Co than for Ni electrodes – a fact that is indicated
by comparing the values of Cø listed in Table 1, with those which we have previously reported1 for Ni. As an example, at E = 0.6 V for the “type” C Co electrode, the optimised value of the pseudocapactive CPE is Cø = 2.52 mFcm-2, α = 0.835. For a pre-reduced Ni anode, also in 1.0 M NaOH solution, the best fit values at this potential were1, Cø = 67.31µFcm-2, α = 0.947.
As a direct consequence of the high pseudocapacitance of the Co electrode, the total Faradaic resistance, RF (RF = Rs + Rp), is not characterised for lower overpotentials at the low frequency limit, in the case of the EIS data presented in Fig. 12. This is reflected in the % error in the fitted values of Rs listed in Table 1. The CNLS fitting program outputs an estimate of the error in the fitted value for each circuit element, based upon the difference between the experimental and calculated impedances at the frequency at which that element has its maximum significance in determining the overall measured impedance. For the optimised values of the circuit elements other than Rs, these error estimates are small (< 3%). In contrast, the fitting program found that the Rs parameter is completely meaningless for the data recorded at potentials of 0.55 and 0.58 V. It can be appreciated from Table 1, that with increasing potential, the % error in the calculated value of Rs drops as the contribution of this resistive component to the measured impedance begins to become resolved at the lowest measurement frequencies. Only at higher potentials (0.64 V) is satisfactory characterisation of RF approached, on the timescale of these experiments. This is of course, also the reason why the lower frequency pseudo-semi-circles are only partially developed in the Nyquist plots of Fig. 13 for the lower potentials.
The reason why the high pseudocapacitance of the Co electrode, pushes the resolution of RF to lower frequencies relative to Ni electrodes [1], is most readily explained in terms of the equivalent circuit of Fig. 14. At low frequencies the magnitude, ZΣ, of the total impedance of the circuit is dominated by the RsCø loop. Therefore, we can write:
( )
11 1 1 1 1
S S
Z Z Zφ R ωCφ − Σ
≅ + = + (9a)
Or
1
S
S
R Z
R Cω φ
Σ≅ + (9b)
The greater the magnitude of Cø, the lower the frequencies for which RsωCø << 1 (for similar values of Rs) – thus explaining why RF is not resolved for the “type” C Co anode at lower η in the impedance spectra of Figs. 12 and 13, but is accessible in the case of EIS experiments carried out on a similar timescale for Ni (and indeed Fe [21]) electrodes in the same electrolyte solution.
In a trial EIS measurement [30], performed at E = 0.575 V in 1.0 M NaOH, and extended to a lower frequency of 10-3 Hz, it was found, that, even at this low frequency limit, RF was not completely resolved – although with a measured phase angle of ~ 10 degrees, a reasonable estimate was possible. It must be remembered, that using FRA based EIS equipment, the time required for the acquisition of data of satisfactory quality down to a lower frequency limit of 10-3 Hz, is significant. While one single measurement period at 10-3 Hz is obviously 1000s, it is necessary to repeat this measurement over a number of periods to facilitate the integration of the impedance response. Bearing in mind, that this process must be repeated at several other measurement frequencies within the 10-2 – 10-3 Hz decade, it is clear that the experimental timescale would be of the order of hours at each measurement potential. Ageing of the oxide film on Co electrodes over such a timescale has however, been shown to affect measured OER kinetic parameters [3]. On this basis we would suggest, that FRA based impedance spectroscopy is not a useful method for obtaining a kinetically significant OER Tafel slope value in the case of Co electrodes in 1.0 M NaOH, despite being successfully applied to this problem in the case of Ni [1] and Fe [21] anodes in that electrolyte. Similar issues regarding the lack of resolution of RF at the low frequency limit, arose in EIS measurements on “type” A Co electrodes in 1.0 M NaOH at lower OER overpotentials.
The question arises as to the origin of the greater pseudocapacitive response for Co, relative to Ni and Fe electrodes, at potentials associated with the lower OER linear Tafel region. A survey of the literature reveals, that just as with the data of Figs. 12 and 13, capacitive behaviour dominates the impedance responses of cobalt oxide and Co containing alloy electrodes in 1.0M OH- solutions at lower oxygen evolution overpotentials. Kessler et al.[31] conducted EIS studies, to a lower frequency limit of 10-3 Hz, on the OER behaviour of the amorphous alloys G14 (Fe60Co20Si10B10) and G16
(Co50Ni25Si15B10) in 1.0M KOH. For lower overpotentials, RF was well resolved, even at 0.1 Hz, for the G14 anode - however for G16 alloy, with its greater Co content, RF remained poorly resolved at 10-3 Hz.. Wu and co-workers [32] used impedance to characterize the electrocatalytic activities for oxygen evolution, of an electrodeposited cobalt oxide phase and several Co+Ni mixed oxide phases. Nyquist representations of EIS data recorded in 1M NaOH, at a potential associated with a lower Tafel slope (b = 40 – 48 mVdec-1 dependent on the oxide composition) region in steady state measurements, show that while RF is well resolved for the mixed oxides at the lower frequency limit, this is not the case for the exclusively Co based oxide. Dominant capacitive responses, extending to the lowest measurement frequency, have also been reported for EIS studies at lower oxygen evolution overpotentials on, thermally prepared NiCo2O4 electrodes (1.0 M NaOH) [33], electrodeposited cobalt
oxide films (1.0 M NaOH) [25] and pre-oxidised Ni50Co25P15B10 alloy anodes (1.0 M KOH) [34]. The
pseudocapacitance, in parallel to the adsorption pseudocapacitance associated with the potential dependent coverage of OER intermediate species.
3.7. Mechanistic assignment of the OER at Co electrodes
In contrast to fresh non-pre-treated (“type” A) Co electrodes, for which b varied from ~2.303×4RT/5F in 1.0 M NaOH to ~2.303×2RT/3F in 5.0 M NaOH, it was possible to obtain a value of mOH- for pre-reduced fresh Co anodes (“type” C), as was discussed above. The experimental kinetic data recorded for “type” C electrodes (b = ~2.303×4RT/5F with associated mOH- = ~1) would therefore seem to provide a good starting point for a kinetic mechanistic determination of the operative pathway for the OER at passive oxide covered Co electrodes in alkaline solution. However a problem arises immediately, in that b = 2.303×4RT/5F is not predicted by a conventional kinetic analysis of any of the commonly cited candidate pathways for the OER, regardless of which step is chosen as rate-limiting or whether the Langmuir or Temkin isotherm is admitted to describe the potential dependent coverage of the reaction intermediates – cf. ref. 35, Table II. Such a value for b, can however be rationalised in terms of a so-called dual barrier model, under which it is assumed that not all of the potential difference across the metal/solution interface has a effect on the kinetics of the interfacial electron transfer reaction.
3.8. The dual barrier model
Several dual barrier models [3, 4, 36 – 43] have been outlined in the literature. Of these, we believe, that the model most relevant to the present work, is that of MacDonald and Conway [37], developed to rationalise oxygen evolution Tafel slopes of ~ 2.303×4RT/5F observed for gold electrodes in acid and alkaline solutions. This was, in turn, a development of a model, first proposed by Meyer [36] to explain very high Tafel slopes observed for cathodic processes occurring at zirconium electrodes covered by a barrier layer of ZrO2. The model envisages that only a fraction of the total
potential difference, E, between the metallic electrode and the solution is effective in charge transfer at the electrode/solution interface, with the remainder of the potential drop occurring across an electronically conductive barrier oxide layer, through which the charge passed during the course of the OER must migrate.
Applying the dual barrier model, the total applied potential, E, is expressed as E = Vf + Vs, where Vs is the potential affecting the normal electrochemical charge transfer barrier at the electrode/solution interface, while Vf is the potential affecting the charge migration process across the
exp ze i K RT δΦ ⎡ ⎤ = ⎢ ⎥
⎣ ⎦ (10)
where, i, is the current through the film, δ is the half jump distance of the charge carriers, and Φ is the magnitude of the electric field and K denotes a constant. Rewriting equation (10) in terms of the potential Vf, yields,
exp f exp f f
f
ze V ze V
i K K
LRT RT
δ β
⎡ ⎤ ⎡ ⎤
= ⎢ ⎥= ⎢ ⎥
⎣ ⎦ ⎣ ⎦ (11)
where, L is the thickness of the barrier film, and βf =δ L is the symmetry factor for the field assisted migration of the charge carriers in the film. The expression for the flux or rate fsof the interfacial
electrochemical charge transfer reaction takes the standard form, i.e.,
,
'0
, exp
i s
m s s
s s i s
i
FV
f k a
RT β
⎡ ⎤
= ⎢ ⎥
⎣ ⎦
∏
(12)where,
( )
mi s, is ia
∏
is the product of the activities of the reactants raised to the appropriate power mi andβs, is the symmetry factor for the reaction. For mathematical convenience, equation (11) is rewritten in the same form as (12):
'0 ,
, exp
j f
m f f
f f j f
j
FV
f k a
RT β ⎡ ⎤ = ⎢ ⎥ ⎣ ⎦
∏
(13)Meyer [36] commented that an equation such as (13), should be regarded purely as a formal expression giving the rate of charge transport through an oxide film of constant thickness, as a function of the activities
( )
pj f,jf
a
and the potential Vf. The activities in equation (13) depend on the nature of the oxide charge migration process and may be thought of, in terms of the effective concentration of the barrier oxide film charge carriers. When the interfacial electrochemical charge transfer process (oxygen evolution in the present case) is occurring at a steady state, the rate detemining step (RDS) of that process must be in equilibrium with the charge transfer process through the film. Therefore, equating equations (12) and (13), and eliminating the Vf and Vs terms by recalling that the overall applied potential, E, is equal to the sum of these two potential terms, we achieve, after some rather laborious algebra, the following expression for the net steady state electron transfer rate fΣ,(
,)
(
,)
, , exp
f s
j f i s s f m s f
m
i s j f
i j
FE
f k a a
RT
β β
β β
β β+ + βΣ
Σ Σ ⎧ ⎫⎧ ⎫ ⎪ ⎪⎪ ⎪ ⎡ ⎤ = ⎨ ⎬⎨ ⎬ ⎢ ⎥ ⎣ ⎦ ⎪ ⎪ ⎪ ⎪⎩ ⎭
⎩
∏
⎭∏
(14)Where s f s f β β β β β
And
'0 '0
f s
s f s f
f s
k k k
β β
β β+ β β+
Σ = (16)
The term βΣ as defined in equation (15) is an overall symmetry factor taking account of the
two charge transfer barriers.
It was shown by MacDonald and Conway [37] that for a particular OER pathway (with a particular step chosen as rate controlling), the conventional kinetic analysis of which yielded a prediction of b=2.303 2
(
RT F3)
, application of the dual barrier model changed this prediction to(
)
2.303 4 5
b= RT F . In our previous article [1] on the OER at Ni anodes, a reaction scheme was proposed that gave satisfactory account for the experimental observation of b=2.303 2
(
RT F3)
and mOH- =~ 1 at lower overpotentials. An analogous pathway for passive oxide covered Co anodes in aqueous alkaline solution could be written as follows:[
( ) ( )]
[
( ) ( ) 1]
p p
m n m n
Co IV O OH −+OH− → Co IV O OH + −+e− (B I)
[
]
[
]
( 1)1 1 2 2
( ) m( )n p ( ) m( )n p
Co IV O OH − Co IV O OH − − H O e−
+ → − − + (B II)
[
]
( 1)[
]
1 2 2 2 2
( ) m( )n p 2 ( ) m( )n p
Co IV O OH − − −−H O + OH− → Co IV O OH −−HO +H O e+ − (B III)
[
( ) ( )]
2[
( ) ( )]
2( ) 2p p
m n m n
Co IV O OH −−HO +OH−→ Co IV O OH −+O g +H O e+ − (B IV)
The details of this somewhat novel pathway were discussed in the first part of this series [1]. In contrast to the Ni(III) catalytic centre envisaged for Ni, the active site on oxidised Co electrode surfaces is likely to be tetravalent as discussed above (Fig. 3). The concept of complex anionic surface species, formed by the coordination of extra hydroxide ions facilitated by the acidic properties of hydrous oxides at significant anodic potentials in solutions of high pH, was discussed elsewhere [1, 21, 45, 46] and is retained here. As was discussed in our review of the electrochemistry of Co electrodes in aqueous alkaline solution, it is to be expected that the outer regions (where reside the reaction sites for the OER) of the passive oxide should be dispersed and hydrous in nature and it is therefore reasonable (after O’Sullivan and Burke [45]) to represent the OER catalytic entities as [Co(IV)Om(OH)n]p-, where
p=2m+n-4.
We now examine, whether pathway (B) can, with the adoption of the dual barrier model, account for the experimental kinetic parameters observed for the “type” C Co electrode (b≅2.303 4
(
RT F5)
and mOH- =~ 1). We have previously outlined [1] a conventional kinetic analysis of this type of OER pathway where the second step was considered to be the rate determining step (RDS). In that analysis it was shown, that at lower overpotentials with the Langmuir isotherm assumed, the fractional coverage, θ, of the only reaction intermediate to achieve any significant coverage ([Co(IV)Om(OH)n+1]p- in the present case), can be written as:exp
OH
FE Ka
RT θ = ⎡⎢ ⎤⎥
In equation (17) '0 '0 '0
1 1 exp
K =k k− = ⎣⎡− ∆G RT⎤⎦, where k k1'0, −'01 are respectively, the standard
electrochemical rate constants for the initial discharge step in the forward and reverse directions. Under the dual barrier model, with step (B II) taken as rate limiting, the rate equation for the interfacial OER (expressed now in terms of its current density is-c.f.eqn.12) becomes c:
'0 2
'0 2
2 exp
2 exp exp
s s s sc s s sc OH FV i Fk RT FV FE
Fk K a
RT RT β θθ β θ ⎡ ⎤ = ⎢ ⎥ ⎣ ⎦ ⎡ ⎤ ⎡ ⎤ = ⎢ ⎥ ⎢ ⎥ ⎣ ⎦ ⎣ ⎦ (18)
Equating the expressions outlined in eqn. 18 and eqn.13, and eliminating, as before, the Vf and Vsterms, yields the following expression for the overall current density (through the two barriers),
(
)
(
)
' 1
2 sc OH s f f exp
FE
i FK a
RT
β
β β β
θ + Σ
Σ
+
⎡ ⎤
= ⎢ ⎥
⎣ ⎦ (19)
Where we note that ' '0
( )
,2 ,
s j f s f
m j f j
K k KK a
β β β+
Σ Σ ⎧ ⎫ ⎪ ⎪ = ⎨ ⎬ ⎪ ⎪ ⎩
∏
⎭.Assuming that both barriers are symmetrical (i.e. βf = βs = ½) and inserting these values into equation (15), gives βΣ=1/ 4. Inserting this value for the overall symmetry factor into equation (19) yields:
' 1/ 2 5
2 exp
4
sc OH
FE
i FK a
RT θ
Σ ⎡ ⎤
= ⎢ ⎥
⎣ ⎦ (20)
The predicted values for b and mOH, are thus: 4 2.303 log 5 log 1 log 2 OH a OH OH E E RT b i F i m a ⎛ ∂ ⎞ ⎛ ⎞ =⎜ ⎟ = ⎜ ⎟ ∂ ⎝ ⎠ ⎝ ⎠ ⎛ ∂ ⎞ =⎜ ⎟ = ∂ ⎝ ⎠ (21)
It is clear that while, application of the dual barrier model to the oxygen evolution pathway of scheme (B) (with (B II) as RDS and θ → 0), leads to the prediction of the experimentally observed Tafel slope for “type” C Co electrodes, it cannot account for the observed reaction order of approximately unity. Reaction order considerations were not treated in the original paper of MacDonald and Conway [37], however it is obvious from equation (14) that the apparent reaction order with respect to the activity as of a particular reactant species in the electrochemical charge transfer reaction, as measured by (∂logi/∂logas)E is given by the expression:
log log
s f
s E s f
m i a β β β ⎛ ∂ ⎞ = ⎜∂ ⎟ +
That is to say, that in cases where a potential dependent, field driven charge migration process occurs in series with the interfacial charge transfer reaction, the experimentally measured (∂logi/∂logas)E quantity is actually a fraction, βf/βf+βs, of the true reaction order ms for the latter reaction. If it is again assumed that βf = βs = ½, then the quantity βf /βf +βs= ½. This explains why the kinetic analysis of scheme (B) under dual barrier conditions, yielded a value of (∂logi/∂logaOH)E = ½, rather than the order of unity that is derived [1] in the conventional (single barrier) analysis of such a pathway.
From the point of view of our experimental data, if we admit the applicability of the dual barrier model (assuming again that βf = βs = ½ and thus, βf /βf +βs = ½), the observation of an experimental apparent reaction of ~1 in association with a lower overpotential Tafel slope of ~2.303×4RT/5F, implies that the analysis of an appropriate pathway for the OER on “type” C Co electrodes must predict b = 2.303×2RT/3F and a reaction order of two, when the oxygen evolution reaction is considered in isolation from the oxide film charge transfer process. It should be clear, that this would arise if there was a additional factor of aOH in rate equation (18) – in other words in a suitable reaction pathway, as well as the mole discharged in the initial step, a further mole of OH- ions are adsorbed from the bulk solution, per mole of active surface sites, in the RDS, or in another step that occurs between the initial step and the RDS. Furthermore, to account for the low Tafel slope of 2.303×2RT/3F, the RDS must be an electrochemical rather than chemical reaction.
It can be shown [35] that several previously proposed pathways, satisfy the criteria outlined above. These include the Krasil’shchikov pathway (A), if step (A III) is considered to be rate-controlling (with θSO-→ 0) and the Bockris Electrochemical path [35] again with the second electron transfer step taken as the RDS and low coverage Langmuir adsorption conditions assumed. Indeed, on the sole basis of the experimental kinetic data of Figs. 6 and 7, it is impossible to further discriminate between several possible OER pathways.
3.9. A consistent mechanism for all ’ types’ of Co electrodes
In an attempt to advance the problem of mechanistic determination beyond the deadlock outlined in the previous paragraph, we turn to the experimental kinetic parameters obtained for the “type” B electrode: b = ~60 mVdec-1, m
OH- = ~3/2 at lower η, and b = ~120 mVdec-1, mOH- = ~1 at higher η. These results are identical to those that we have reported elsewhere [21] for the OER at multicycled and aged Fe anodes. The only pathway that we could identify to suitably account for the aforementioned set of kinetic parameters, was of the following general form,
S OH+ −→ −S OH e+ − (CI)
2 2
S OH OH− + − → −S H O +e− (C II)
2 2 2 2
S H O− +OH− → −S HO−+H O
(C III)
2 2 2 2( ) 2
S H O− + −S HO− →O g +H O OH+ − (C IV)
where, as before, S is a catalytically active surface site and -H2O2 represents physisorbed hydrogen
S-OH (Langmuir isotherm, θS-OH → 1), a conventional kinetic analysis predicts b=2.303 2
(
RT F)
(118.3 mVdec-1 at 25ºC) with mOH- = 1. On the other hand, over the potential window where an intermediate coverage of S-OH prevails (Temkin isotherm, 0.2 ≤ θS-OH ≤ 0.8), values of
(
)
2.303
b= RT F (59.2 mVdec-1 at 25ºC) and m
OH- = 3/2 are predicted. The reason behind the requirement for a physisorbed, as opposed to chemisorbed, product in step (C II) was also discussed in that article [21]. Pathway (C) was originally devised by Bockris and Otagawa [35], for the OER on cobaltate and ferrite electrodes in alkaline solution.
Consider the form of the overall rate equation for scheme (C), if again the second step is rate limiting, but on this occasion the fractional coverage of S-OH is considered to follow the Langmuir isotherm at lower overpotentials. If the quasi-equilibrium principle is applied to step (C I), it is clear that the fractional coverage of S-OH is again given by equation (17). The overall OER current density, i, is then given by:
(
)
'0 2 '0 2 2 2 exp 1 2 exp OH OH F i Fk aRT F Fk Ka RT β η θ β η ⎡ ⎤ = ⎢ ⎥ ⎣ ⎦ + ⎡ ⎤ = ⎢ ⎥ ⎣ ⎦ (23)
Assuming that β = ½ we can readily show that eqn.23 yields the following expressions for b and mOH:
2 2.303 log 3 log 2 log OH a OH OH RT b i F i m a η η ⎛ ∂ ⎞ ⎛ ⎞ =⎜ ⎟ = ⎜ ⎟ ∂ ⎝ ⎠ ⎝ ⎠ ⎛ ∂ ⎞ =⎜ ⎟ = ∂ ⎝ ⎠ (24)
As discussed in the previous section, where a conventional (single barrier) electrode kinetic analysis gives rise to these values for b and mOH, a treatment under the dual barrier model would lead to b=2.303 4
(
RT F5)
and mOH = 1.Notwithstanding the fact that physisorbed species are classically considered to have greater surface mobility relative to chemisorbed entities, it is somewhat difficult to envisage how the recombination step (C IV) could proceed at a sufficient velocity under low coverage Langmuir conditions, such as not to render it rate-determining overall. We therefore present the following modification to the original physisorbed peroxide pathway of Bockris and Otagawa, which avoids the latter difficulty:
[
( ) ( )]
[
( ) ( ) 1]
p p
m n m n
Co IV O OH − OH− Co IV O OH − e− +
+ → + (D I)
[
( ) ( ) 1]
[
( ) ( ) 2 2]
p p
m n m n
Co IV O OH − OH− Co IV O OH H O − e−
+ + → − + (D II)
[
( ) ( ) 2 2]
[
( ) ( ) 2]
2p p
m n m n
Co IV O OH −H O −+OH− → Co IV O OH −HO −+H O e+ − (D III)
[
( ) ( ) 2]
[
( ) ( )]
2( ) 2p p
m n m n
As we commented elsewhere [1], the extreme irreversibility of the oxygen evolution and reduction reactions prevents the accurate and meaningful evaluation of the stoichiometric number, ν, thus removing the possibility of experimental discrimination between pathway (C) (ν = 2 with (C II) as RDS) and pathway (D) (ν = 1 with (D II) as RDS).
It is obvious that the formal kinetic analysis of scheme (D), with the second step rate-determining under low coverage Langmuir adsorption conditions, is identical to that considered in equations (23) and (24). This means, of course, that (D) is yet another mechanism that can account for the experimental kinetic parameters observed for the “type” C Co electrode. However, exclusively amongst the candidate mechanisms, the physisorbed peroxide pathway of (C) or (D) can also rationalise the steady state polarisation data obtained for the “type” B Co anode, as was discussed earlier in the present section. On this basis we would suggest that (D) is the most likely reaction pathway for the OER on passive oxide covered Co electrodes in aqueous alkaline solution. Attributing the changes, with electrode ageing, in the experimental values of the diagnostic parameters, to changes in intermediate adsorption conditions, while maintaining a consistent reaction pathway, would seem to provide a more coherant solution than envisaging entirely different mechanisms for the “type” B and C anodes, considering that both are fundamentally passivated Co electrodes. Furthermore, the same pathway and adsorption conditions are likely for the “type” A Co electrode (fresh non-pre-treated) as the “type” C anode (fresh pre-reduced). The slope of b2.303 4
(
RT F5)
observed for the “type” A electrode in 1.0 M NaOH is similar to that which characterises the “type” C electrode at all electrolyte concentrations. The lower slope of b 2.303 2(
RT F3)
recorded for the “type” A electrode in 5.0 M NaOH is characteristic of pathway D proceeding without a series oxide layer potential barrier – the reason for the applicability of the dual barrier model to this type of electrode in 1.0 M NaOH but not in 5.0 M NaOH will be discussed in the next section. For the moment it is noted that a change in the operative adsorption isotherm at lower overpotentials, from the low coverage Langmuir isotherm for the “type” A electrode, to the Temkin isotherm for the “type” B electrode, would certainly appear to be consistent with the comparitive polarisation plots presented in Fig. 8.The question arises as to why the concentration of the adsorbed intermediate [Co(IV)Om(OH)n+1]p-, is greater over the range of potentials associated with the lower linear Tafel
region, for the aged (“type” B) Co electrode relative to the fresher electrodes (“types” A and C) of the same metal. On the basis of the voltammetric profile of the “type” B electrode (Fig. 9), with its unusually large background charge, we speculate that a more hydrous and dispersed oxide phase forms on this electrode surface compared to that of the fresher anodes. We commented previously, this probably arises as a cumulative result of a continuous cycle, over a long period of service, of mechanical polishing (which we have shown to be not completely effective in the removal of oxide phases) and subsequent re-passivation of surfaces containing some residual oxide material. It may also be related to the long term ageing of a thin residual oxide phase, adjacent to the metal, which is particularly resistant to removal by polishing.
catalytically active, complex anionic [Co(IV)Om(OH)n]p- species at lower oxygen evolution
overpotentials, in comparison to the fresher electrodes. The polarisation data of Fig. 9 indicates that as η is increased, the concentration of the surface catalytic centres on the fresher electrode effectively “catches up” with that of the aged electrode, and consequently the oxygen evolution current densities for both electrodes become convergent at higher overpotentials.
Returning momentarily to the dual barrier model, some further evidence for its applicability in the rationalisation of the OER steady state polarisation behaviour of “type” C Co electrodes, can be obtained by considering the situation at higher overpotentials. The approximation that gave rise to equation (17) is no longer applicable, and it is necessary to return to the full expression (that we have derived elsewhere [1]) for θ:
exp 1 exp OH OH FE Ka RT FE Ka RT θ ⎡ ⎤ ⎢ ⎥ ⎣ ⎦ = ⎡ ⎤ + ⎢ ⎥ ⎣ ⎦ (25)
For sufficiently high E, the KaOHeEF/RT term becomes very much larger than unity, and therefore θ approaches unity. By analogy with equations (18) and (23), the rate equation for the OER proceeding via pathway (D) (step (D II) as RDS), under dual barrier conditions is given by:
'0 2
2 exp s s
s OH
FV
i Fk a
RT β
θ ⎡ ⎤
= ⎢ ⎥
⎣ ⎦ (26)
In the limit of θ →1, the expression for the overall current through both barriers becomes,
2 ''
(
)
f exps f
OH
FE
i FK a
RT
β
β β+ βΣ
Σ ⎡ ⎤
= ⎢ ⎥
⎣ ⎦ (27)
where we note that K'' K K'
Σ = Σ .
If, as before, it is assumed that βf = βs = ½, and logarithms are taken of each side of equation (27), it follows that:
4 2.303 log log 1 log 2 OH a OH OH E E RT b i F i m a ⎛ ∂ ⎞ ⎛ ⎞ =⎜ ⎟ = ⎜ ⎟ ∂ ⎝ ⎠ ⎝ ⎠ ⎛ ∂ ⎞ =⎜ ⎟ = ∂ ⎝ ⎠ (28)
≤[OH-]≤ 5.0 M) are resolved into a linear region with a slope of b 2.303 4RT F
⎛ ⎞
≈ ⎜ ⎟
⎝ ⎠ (~236 mVdec
-1 at
25ºC). While further, specifically targeted experimentation is required, to obtain a more complete understanding of this region of the polarisation plot (for example the origin of the “maximum” feature), it is worth commenting, with reference to the analysis of equations (25) – (28), that the observation of log i vs. E slopes of b 2.303 4RT
F
⎛ ⎞
≈ ⎜ ⎟
[image:29.612.175.431.315.515.2]⎝ ⎠ is consistent with our proposed reaction pathway, (D), proceeding with θ →1, under dual barrier conditions. A summary is provided in Table 2 of the various values of the experimental kinetic parmeters (b and associated mOH) that we have observed for the OER at oxidised Co electrodes and the conditions under which they can be rationalised by pathway (D).
Table 2. Summary of the various experimentally observed kinetic parameters, and the conditions under which they can be rationalised by pathway D.
Co Electrode
type
Experimental
b, mOH
Dual Barrie
r ?
b, mOH
for analysis Adsorption Isotherm A 2RT/3F
(5M) →4RT/5F
(1M)
lower [OH-]
---- ----
B, low η RT/F, 3/2 No As listed
left rTemkin, I >>rIIa B, upper
η
2RT/F, 1 No As listed left
Langmuir, θ→1 C, low η 4RT/5F, 1 Yes 2RT/3F, 2 Langmuir,
θ→0 C, upper
η 4RT/F Yes 2RT/F Langmuir, θ→1
ar
I , rII are the Temkin parameters for the intermediates formed in the first and second steps respectively. See reference 21
for more details.
3.10. The physical origin of the oxide layer charge transfer barrier
The most pressing outstanding issue, relates to the polarisation curves of Fig. 5, recorded for a “type” A Co electrode in solutions with different OH- ion concentrations. Specifically, it might be asked, why there is an oxide film charge transport barrier in series with the interfacial electrochemical charge transfer barrier in the case of the data recorded in 1.0 M NaOH solution (giving rise to
(
)
2.303 4 5
It is our view, that the key to answering this question lies in the identification of the oxide film charge transfer barrier with the inner inner compact anhydrous region of the anodic oxide films, or with the interface between this inner region, and the outer more disperse and hydrated region of these films. Recall from our review of the surface electrochemistry of Co electrodes, that passivation is generally accepted to occur, initially by the formation of a Co(II) based oxide on the metallic surface, the outer regions of which are then further oxidised to hydrous higher oxides (sandwich model). In the general model of this type of passive oxide, developed by Burke and co-workers [18, 19] and discussed by us elsewhere [21], it is envisaged that the majority of the potential drop across the oxide film occurs at the compact layer/dispersed layer interface. According to this model, under conventional steady state anodization conditions, the inner compact layer is likely to be of limited thickness since the activation energy for atom or ion migration is generally quite large. This is due to the fact that in this amorphous, anhydrous inner layer, the ions are held in a rigid manner, in a network of polar covalent bonds that drastically reduce ion transport through this region of the oxide, in turn inhibiting its expansion. In contrast, the model envisages that the outer more dispersed region of the oxide has a similar morphology to redox polymers with transfer of electrons along the “polymer” chains via a process of self exchange between neighbouring oxy metal groups [21]. In terms of this dual layer model, it would certainly seem that the inner anhydrous oxide region fits the profile of the barrier oxide envisaged by Meyer [36], and MacDonald and Conway [37].
Earlier, it was concluded, with reference to the voltammetric data of Figs. 1 and 2, that in solutions of lower OH- ion concentration, the initial passivation of the electrode occurs essentially via a solid state Co→Co(II) oxidation process. With increasing concentration, especially for [OH-] > 1M, a rapid dissolution/precipitation mechanism becomes progressively more important in the formation of the initial Co(II) oxyhydroxide film. The oxide formed primarily by the solid state route is expected to be a compact structure based on polar covalent bonding – in fact just the type of oxide that we have proposed to form a significant barrier to charge transfer. It is therefore not surprising that the dual barrier model is apparently applicable to the kinetics of the OER at bright Co electrodes in solutions where [OH-] ≤ 1 M.
On the other hand, the oxide film formed by a rapid dissolution/precipitation reaction, is lightly to be a somewhat crystalline phase albeit with a high defect concentration, owing to the rapid rate of re-precipitation, as envisaged by Erts et al. [23]. Such a phase, would be expected to be characterised, by significantly higher electronic conductivity and ionic mobility, than the inner oxide region formed at lower [OH-], and thus present a much lower potential barrier to charge migration. The aforementioned considerations provide a satisfactory explanation for the appearance of dual barrier Tafel slope behaviour in the 1.0 M steady state polarisation curves of Fig. 5, while such behaviour is absent from the data recorded in 5.0 M NaOH solutions.
In the case of “type” C Co electrodes (Fig. 6), for which a reproducible Tafel slope of
(
)
2.303 4 5