THERAPY ON THE MICRONUCLEI FREQUENCY, SERUM MALONDIALDEHYDE AND SERUM HIGH SENSITIVE C – REACTIVE PROTEIN LEVELS IN CHRONIC PERIODONTITIS
PATIENTS WITH AND WITHOUT WELL CONTROLLED TYPE 2 DIABETES MELLITUS”
DISSERTATION
Submitted to The Tamil Nadu Dr. M.G.R Medical University
in partial fulfillment of the requirement for the degree of
MASTER OF DENTAL SURGERY
BRANCH II
PERIODONTOLOGY
Urkund Analysis Result
Analysed Document: Download File.pdf (D46656630)
Submitted: 1/11/2019 6:22:00 AM
Submitted By: [email protected]
Significance: 9 %
Sources included in the report:
SUHAIL EDITED 3.pdf (D46620148) with citation.docx (D46082812)
https://www.ncbi.nlm.nih.gov/pubmed/28746320
https://pdfs.semanticscholar.org/bab3/26672b3559dc925da4ceec1895f9806847b8.pdf https://www.science.gov/topicpages/c/c-reactive+protein+results
https://www.hindawi.com/journals/dm/2014/931083/
https://www.science.gov/topicpages/p/periodontal+index.html
https://worldwidescience.org/topicpages/p/periodontal+attachment+loss.html
https://pdfs.semanticscholar.org/4415/5dbbefcddb2d1d2313bae51c4519d3fe278b.pdf https://www.ncbi.nlm.nih.gov/pubmed/29899268
https://www.ncbi.nlm.nih.gov/pmc/articles/PMC4296459/
http://laserrdh.com/resources/Periodontal+therapy+may+lower+heart+disease+risk.htm https://worldwidescience.org/topicpages/c/chronic+periodontitis+clinical.html
https://www.omicsonline.org/open-access/statistical-study-on-serum-crp-levels-in-aggressive--chronic-periodontitispre--post-nonsurgical-periodontal-therapy-2161-1173-1000152.php? aid=61464
http://europepmc.org/articles/pmc5427433
https://conservancy.umn.edu/bitstream/handle/11299/198978/ Chatzopoulos_umn_0130M_19129.pdf?sequence=1&isAllowed=y Instances where selected sources appear:
‘Not by might nor by power, but by my Spirit,’ says the Lord Almighty.
- The Bible
I firstly bow in gratitude to the Lord Almighty, for showering His blessings upon me that gave me the courage to venture out this thesis. The reason I am, is all
because of him, and all that is in me rejoices, in his most marvelous doings.
My utmost thanks to my guide Dr. Arun Sadasivan MDS, Professor for his invaluable guidance, constant encouragement, immense patience and untiring
inspiration in every step of my research work. He showed that constancy is
necessary in the path to success. Through the three years of my post-graduation,
each and every day his skills and patient care has made me stand in awe. Without his
kind and patient instruction, it could have been impossible for me, to finish this
thesis.
I am ever grateful to my co-guide, Dr. Elizabeth Koshi MDS, Principal, Professor and Head, Department of Periodontics, Sree Mookambika Institute of
Dental Sciences for her valuable insight, suggestions and meticulous supervision
which shaped this work. Her words have always enlightened me.
I submit my bouquet of thanks to Dr. C.K. Velayuthan Nair MBBS, MS.,
Chairman, Dr. Rema V Nair MBBS, MD, DGO., Director, Dr. Vinu Gopinath MS, Mch.
and Dr. R.V. Mookambika MD, DM., Trustees Sree Mookambika Institute of Dental Sciences for the sanction of resources and facilitating the conduct of my
MDS, Dr. Chitra Girija Vallabhan MDS, Dr. Steffi Vijayakumar MDS, Dr. Indhuja MDS and especially to Dr. Sheethel Menon in the Department of Periodontics, for their practical advice and constant encouragement.
I would like to acknowledge the staff of Genetika Centre for Advanced Genetic Studies, Pettah, Thiruvananthapuram, Dr. Dinesh Roy D, Pallavi J S, Vysakh N, and Anaswara A A for their constant help provided.
I am thankful to Dr. Muraleedharan Nair for providing me with his timely statistical analysis involved in this study.
I gratefully acknowledge my batch mate Dr. Anina Mohan and my fellow Post graduates Dr. Christina Ann Jose, Dr. Hudson Jonathan T, and Dr. Mitha Mathew fortheir constant support, motivation and encouragement.
I owe my sincere thanks to my patients who actively participated in the
study, and have been instrumental in the completion of my thesis.
With a deep sense of gratitude, I remember the love, support and
encouragement I received from my family, especially the two God-given gifts, my father Mr. Peter Thiagarajan N, and my mother Mrs. Thamilarasi P, who have been the backbone through all endeavours in my life. Their prayerful support has
Sl. No Index Page No
1. List of Abbreviations i
2. List of Tables iii
3. List of Graphs iv
4. List of colour plates v
5. List of Annexures vi
6. Abstract vii
7. Introduction 1
8. Aims and objectives 7
9. Review of literature 8
10. Materials and Methods 23
11. Results and Observations 37
12. Discussion 46
13. Summary and Conclusion 54
14. Bibliography x
i ABL - Alveolar bone loss
AGES - Advanced glycation end products
AgP - Aggressive periodontitis
ANOVA - Analysis of variance
BMI - Body mass index
BI - Bleeding index
CAL - Clinical attachment level
CAD - Coronary artery disease
CBMN - Cytokinesis block micronuclei
CP - Chronic periodontitis
CRP - C-Reactive protein
CVD - Cardiovascular diseases
CVS - Cardiovascular system
DMCP - Diabetes mellitus chronic periodontitis
DM - Diabetes mellitus
DNA - Deoxyribo nuclei acid
ELISA - Enzyme linked immuno sorbent assay
GAP - Generalized aggressive periodontitis
GCF - Gingival crevicular fluid
GI - Gingival index
HbA1c - Glycated haemoglobin
HCL - Hydrochloric acid
HDL - High density lipoprotein
ii KCL - Potassium chloride
LDL - Low density lipoprotein
LPO - Lipid peroxidation
IL-6 - Interleukin - 6
MDA - Malondialdehyde
MN - Micronuclei
MNF - Micronuclei frequency
NA - Nuclear abnormalities
NO - Nitric oxide
PD - Periodontal disease
PHA - Phytohaemagglutinin
PPD - Probing pocket depth
qPCR - Quantitative polymerase chain reaction
RBC - Red blood cell
RBS - Random blood sugar
ROS - Reactive oxygen species
SOD - Superoxide dismutase
SRP - Scaling and root planing
TAOC - Total antioxidant capacity
TBA - Thiobarbituric acid
TCA - Trichloroacetic acid
TNF-α - Tumour necrosis factor - α
TOS - Total oxidant status
UNC - University of North Carolina
iii
LIST OF TABLES
Table No Title
Table 1
Baseline Demographic, Metabolic, Periodontal and Laboratory data
of the participants [Mean (SD)]
Table 2
Three Months Post-Operative Metabolic, and Periodontal data of the
participants [Mean (SD)]
Table 3
Changes in Probing Pocket Depth and Clinical Attachment Level at
Baseline and after 3 Months (%)
Table 4
Comparison of Periodontal and Laboratory data at baseline and 3
months after treatment [Mean (SD)]
Table 5
Differences in Metabolic, and Periodontal data of the participants at
iv
LIST OF GRAPHS
Graph No Title
Graph 1 Comparison of mean Plaque Index score of different groups at baseline and after 3 months
Graph 2 Comparison of mean Gingival Index score of different groups at baseline and after 3 months between the groups
Graph 3 Comparison of mean Probing Pocket Depth (mm) of different groups at baseline and after 3 months
Graph 4 Comparison of mean Clinical Attachment Level (mm) of different groups at baseline and after 3 months
Graph 5 Comparison of mean RBS (mg/dl) of different groups at baseline and after 3 months
Graph 6 Comparison of mean Total cholesterol (mg/dl) of different groups at baseline and after 3 months
Graph 7 Comparison of mean triglyceride (mg/dl) of different groups at baseline and after 3 months
Graph 8 Comparison of mean HbA1c (%) of different groups at baseline and after 3 months
Graph 9 Comparison of mean CBMN frequency (out of 1000 binucleated cells) of different groups at baseline and after 3 months
Graph 10 Comparison of mean MDA (U/L) of different groups at baseline and after 3 months
v
Color plate No. Title of color plate
1 Recording clinical parameters
2 Armamentarium for non-surgical periodontal therapy
3 Blood collection
4 Vacutainer and clot activator tube for blood sampling
5 REMI laboratory centrifuge
6 Serum separation
7 Semi auto analyzer (MISPA neo)
8 Laminar air flow chamber
9 Reagents for CBMN assay
10 Cell culturing
11 Microbiological incubator (LAB LINE)
12 Cell harvesting
13 Laboratory microscope (OLYMPUS CX 31)
14 Cytokinesis block binucleated cells with micronuclei
15 Hs-CRP Kit (EURO DIAGNOSTIC SYSTEMS)
vi
Annexure No. Title
Annexure-1 Permission letter from GENETIKA Laboratories Trivandrum.
Annexure-2 Certificate from Institutional Research Committee
Annexure-3 Certificate from Institutional Human Ethics Committee
Annexure-4 Patients Information sheet
-English
-Malayalam
-Tamil
Annexure-5 Patient Consent form
-English
-Malayalam
-Tamil
Annexure-6 Case Record form
Page vii
BACKROUND
The over-production of reactive oxygen species (ROS) associated with the
pathogenesis of several disorders such as diabetes mellitus (DM) and periodontal
disease (PD) can contribute to injury of the host tissue, significant impairment to cell
integrity and can cause oxidative damage to a large number of molecules such as
carbohydrates, lipids and DNA. Because the oxidative stress is intrinsically related
to the pathogenesis of type 2 diabetes, dyslipidemia and PD, and it lead to DNA
damage. One of the most established methods for evaluating DNA damage is the
micronucleus (MN) test. The ROS-mediated tissue destruction could be measured
by the final product of lipid peroxidation (LPO), such as malondialdehyde (MDA).
C-reactive protein (CRP) an acute-phase protein found in the blood, the levels of
which rise in response to inflammation is linked closely to diabetes and periodontal
infection.
AIM OF THE STUDY
The aim of the study was to evaluate the effect of non-surgical periodontal
therapy on the micronuclei frequency, serum Malondialdehyde and serum Hs – CRP
levels in chronic periodontitis patients with and without well controlled type 2
diabetes mellitus and healthy controls.
OBJECTIVES
(i) To assess the micronucleus frequency (MNF), as a biomarker for DNA
damage in peripheral blood, in chronic periodontitis patients, with and
Page viii
(ii) To evaluate and compare free radical damage in the form of serum
malondialdehyde (MDA) levels in chronic periodontitis patients, with and
without well controlled type 2 diabetes mellitus and healthy controls.
(iii) To assess the serum high sensitive C – Reactive protein level in chronic
periodontitis patients, with and without well controlled type 2 diabetes
mellitus and healthy controls.
MATERIALS AND METHODS
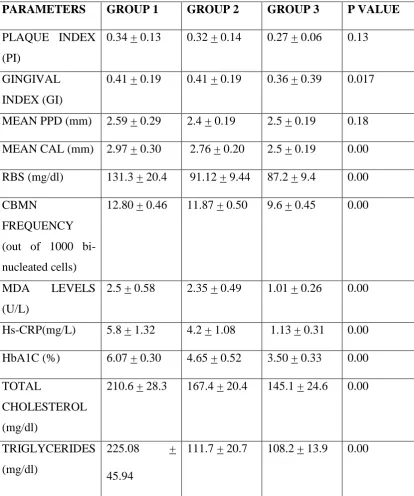
This was an interventional study including a total of 83 participants (28
chronic periodontitis with well controlled type DM, 27 chronic periodontitis and 28
healthy controls) of which 75 patients completed the three months foloow-up
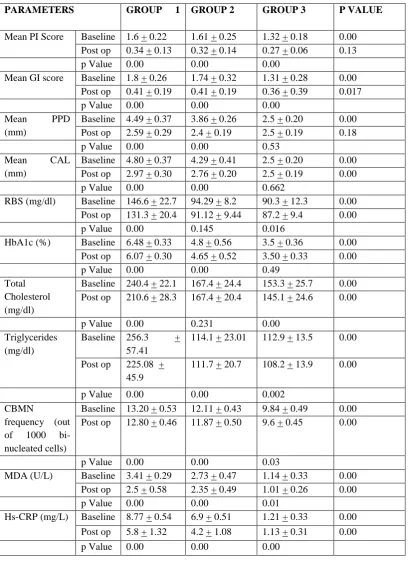
protocol. Clinical parameters (PI, GI PPD and CAL) and laboratory parameters
(RBS, total cholesterol, triglycerides, CBMN frequency, HbA1c (%), MDA, and
Hs-CRP) were recorded at baseline and three months following non-surgical periodontal
therapy.
RESULTS
In the present study at baseline all the periodontal parameters like PI, GI,
PPD, and CAL were elevated in group 1 and group 2 than group 3. There was no
statistical difference in PI, GI at baseline among three groups. In terms of mean PPD
and mean CAL was more in DM group compared to CP group. In other words
chronic periodontitis with well controlled type 2 DM had more periodontal
breakdown than in patients with chronic periodontitis alone. This shows that DM
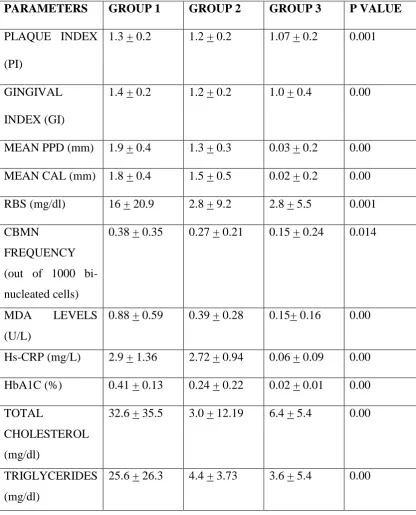
has additional effect on periodontium. 3 months after SRP all the clinical parameters
are reduced significantly in all the groups. Similarly laboratory parameters like RBS,
Page ix
elevated in group 1 and group 2 than group 3. These values significantly declined
three months after non-surgical periodontal therapy.
CONCLUSION
Mean CBMN frequency, MDA, and Hs-CRP levels were elevated in
individuals with chronic periodontitis and chronic periodontitis patients with well
controlled type 2 diabetes mellitus. This study provides evidence that non-surgical
periodontal therapy contributes to reduction in CBMN frequency, serum MDA, and
serum Hs-CRP levels in these patients. Larger clinical trials are needed to confirm
Page 1
Periodontitis is a term used to describe an inflammatory process, initiated by
plaque biofilm, that leads to loss of periodontal attachment to the root surface and
adjacent alveolar bone and which ultimately results in tooth loss. The gram-negative
anaerobic or facultative bacteria within the subgingival biofilm are the primary
etiologic agents but the majority of periodontal destruction occurs due to an
inappropriate host response to this pathogens.1
A diverse range of endogenous chemical mediators organize the host
response and controls the inflammatory response. These chemical signals regulate
the traffic of leukocytes and control the leukocyte response. The classic eicosanoids
such as prostaglandins and leukotrienes exert a wide range of actions and play a key
role in inflammation. The chemical mediators include lipid derived mediators,
cytokines, chemokines, reactive oxygen species (ROS), reactive nitrogen species
etc.2
The initial host response is the release of reactive oxygen species (ROS) via
the metabolic process of respiratory burst in the Polymorphonuclear leukocytes
(PMNL’s), macrophages and monocytes. Excessive production of these ROS results
in oxidative stress in the body. Reactive oxygen species (ROS) have a very short life
(10-6-10-9 seconds), so it is not easy to detect its presence. The ROS-mediated tissue
destruction could be measured by the final product of lipid peroxidation (LPO), such
as Malondialdehyde (MDA).1
No longer can periodontal diseases be considered simple bacterial infections.
Rather, they are complex diseases of multifactorial nature involving an intricate
Page 2
responses, and environmental modifying factors.3 Thus, periodontal health must not
be considered solely in the context of plaque/bacteria levels and control but must
embrace a holistic consideration and evaluation of all factors responsible for the
emergence of disease, as well as the restoration and maintenance of health.4
The relevance of recognizing such important determinants of periodontal
health and disease as controllable and uncontrollable predisposing and modifying
factors cannot be underestimated, and their assessment for each patient is crucial to
attaining and maintaining clinical periodontal health. Diabetes mellitus has, for
many years, been recognized as an important risk factor for periodontal diseases and
associated with significantly higher prevalence and severity of periodontitis.5
Diabetes mellitus (DM) is a metabolic disorder characterized by
hyperglycemia and insufficiency of secretion or action of endogenous insulin and is
an established risk factor for periodontitis6. There are two main types of diabetes (i)
Type 1 diabetes mellitus and (ii) Type 2 diabetes mellitus. More recent data have
confirmed a significant association between chronic hyperglycemia and a high
prevalence of severe periodontitis6, 7. Furthermore, in many diabetic patients DM is
undiagnosed, and the prevalence of these individuals is increasing. Hence, DM
represents an enormous public health challenge and is by far the principal systemic
disease affecting periodontitis in terms of extent of population affected.8 In addition,
there is accumulating evidence that periodontal inflammation may itself contribute
to the onset and persistence of hyperglycemia, in that inflammation is associated
with poorer glycemic control in individuals with DM and may be associated with an
Page 3
A factor associated with complications of DM is the process of
non-enzymatic glycation of proteins, lipids and nucleic acids, with subsequent formation
of advanced glycation end products (AGEs). One of the main consequences of this
adverse action is the formation of oxidative stress.10 ‘‘Oxidative stress’’ can be
defined as any disturbance in the balance of antioxidants and pro-oxidants in favor
of the later due to different factors such as aging, drug actions and toxicity,
inflammation and/or addiction.11 Oxidative stress induces cellular damage and
insulin resistance, and emerges as the major mechanisms for related co-morbidities.
In addition, patients with type 2 diabetes present a deficient antioxidant defense
compared to normal individuals. The increased production of the ROS has also been
assigned to the glycation of proteins and/or auto-oxidation of glucose during the
process of hyperglycaemia. Therefore, besides to the AGEs, the oxidative stress
presents an important role in the pathogenesis and complications of DM.10
DM is well recognized as a risk factor for periodontal disease. Diabetic
individuals present an increased prevalence, severity and progression of
periodontitis, when compared to non-diabetic individuals. Subjects with type 2 DM
are 2.8 times more likely to have destructive periodontal disease and 4.2 times more
likely to have significant alveolar bone loss compared to systemically healthy
subjects. Periodontal disease was proposed to be the sixth complication of DM.
The over-production of ROS associated with the pathogenesis of several
disorders such as DM, dyslipidemia and periodontal disease, can contribute to injury
of the host tissue, significant impairment to cell integrity and can cause oxidative
damage to a large number of molecules such as carbohydrates, lipids and DNA.
Page 4
diabetes, dyslipidemia and PD, and it lead to DNA damage. One of the most
established methods for evaluating DNA damage is the micronucleus (MN) test.12
Micronuclei (MN) and other nuclear anomalies such as nucleoplasmic
bridges and nuclear buds are biomarkers of genotoxic events and chromosomal
instability. These genome damage events can be measured simultaneously in the
cytokinesis block micronucleus cytome (CBMN) assay.
The MN test analyses is based on the identification of a secondary nucleus
(MN), which is originated from acentric chromosome fragments, acentric chromatid
fragments, or whole chromosomes that fail to be included in the daughter nuclei at
the completion of telophase during mitosis because they did not attach properly with
the spindle during the segregation process in anaphase. These displaced
chromosomes or chromosome fragments are eventually enclosed by a nuclear
membrane and except for their smaller size are morphologically similar to nuclei
after conventional nuclear staining. Previous studies suggested that periodontal
treatment may be effective in maintaining systemic health by decreasing circulating
ROS.12
The hyperglycaemia associated to uncontrolled DM increases the formation
of AGEs, including low density lipoprotein (LDL)-AGE, and is associated with the
largest amount of LDL-oxidised. Both AGEs and LDL-oxidised, present at the same
time in the blood of patients with DM, have several biological effects on
lymphocytes and monocytes. These cells are involved in the pathogenesis of various
diseases associated with DM, such as lower resistance to infections, vascular disease
Page 5
C-reactive protein (CRP) an acute-phase protein found in the blood, the
levels of which rise in response to inflammation is linked closely to diabetes and
periodontal infection. All studies on periodontitis patients with diabetes clearly
demonstrate that the inflammatory response in such patients is related to increase in
CRP.13 Recent investigations emphasized the role of moderate elevation of CRP
levels as a risk factor for cardiovascular diseases.14 Studies suggested that
non-surgical periodontal therapy significantly suppress the serum C-reactive protein
level in chronic periodontitis patients with type 2 diabetes mellitus.15
Elevated concentrations of a variety of oxidative stress markers were linked
with a more frequent occurrence of cardiac events. High levels of micronuclei have
been detected to be significantly correlated with Type 2 diabetes mellitus as well as
with the occurrence and the severity of coronary artery disease (CAD). An elevated
level of MDA indicates increase in production of oxygen free radicals suggesting the
possible risk in atherogenesis, leading to coronary heart diseases16. There is strong
evidence that inflammation plays a key role in the cascade of atherosclerosis, from
its beginning to development of instability and plaque rupture. Raised levels of
inflammatory mediators particularly CRP predict cardiovascular events. HsCRP is a
powerful marker of vascular risk in a wide range of populations and, as such, is a
powerful research tool in assessing at-risk populations. Determination of these
markers contributes to understanding the development of and prevention of CVS
disorders.17 All three bio markers include Micronuclei, Malondialdehyde, and
HsCRP will be higher in patients with periodontitis, Type 2 diabetes mellius and
cardiovascular diseases. Non-surgical periodontal therapy includes scaling and root
Page 6
Various studies suggested that non-surgical periodontal therapy effectively reduce
the levels of MDA and hs-CRP thus reducing the cardiovascular risk. Kanduluru et al 201418 showed that nonsurgical periodontal treatment resulted in lower glycemic levels and the reduction of clinical parameters of periodontal infection, confirming
the existing relation between type 2 DM and periodontal disease. Katagiri et al 200915 demonstrated that periodontal treatment with topical antibiotics was effective towards the improvement of glycemic control in type 2 diabetic patients with
periodontal disease when associated with a decrease in serum hs-CRP.
The present study designed to compare the micronuclei frequency in
peripheral blood, serum Malondialdehyde level, and serum high sensitive C -
reactive protein at baseline and 3 months after non-surgical periodontal therapy in
chronic periodontitis patients with and without well controlled type 2 diabetes
Page 7 Aim of the study
The aim of the study was to evaluate the effect of non-surgical periodontal
therapy on the micronuclei frequency, serum Malondialdehyde and serum Hs – CRP
levels in chronic periodontitis patients with and without well controlled type 2
diabetes mellitus and healthy controls.
Objectives of the study
(i) To assess the micronucleus frequency (MNF), as a biomarker for DNA
damage in peripheral blood, in chronic periodontitis patients, with and
without well controlled type 2 diabetes mellitus and healthy controls.
(ii) To evaluate and compare free radical damage in the form of serum
Malondialdehyde (MDA) levels in chronic periodontitis patients, with
and without well controlled type 2 diabetes mellitus and healthy
controls.
(iii) To assess the serum high sensitive C – Reactive protein level in
chronic periodontitis patients, with and without well controlled type 2
Page 8
Diabetes mellitus (DM) is a metabolic disorder characterized by
hyperglycemia and insufficiency of secretion or action of endogenous insulin and is
an established risk factor for periodontitis.6 There are two main types of diabetes (i)
Type 1 diabetes mellitus and (ii) Type 2 diabetes mellitus. More recent data have
confirmed a significant association between chronic hyperglycemia and a high
prevalence of severe periodontitis.6,7 Furthermore, in many diabetic patients DM is
undiagnosed, and the prevalence of these individuals is increasing. Hence, DM
represents an enormous public health challenge and is by far the principal systemic
disease affecting periodontitis in terms of extent of population affected.8 In addition,
there is accumulating evidence that periodontal inflammation may itself contribute
to the onset and persistence of hyperglycemia, in that inflammation is associated
with poorer glycemic control in individuals with DM and may be associated with an
Page 9
Exacerbated and dysregulated inflammatory responses are at the heart of the
proposed two-way interaction between diabetes and periodontitis, and the
hyperglycaemic state results in various proinflammatory effects that impact on
multiple body systems, including the periodontal tissues. Adipokines produced by
adipose tissue include proinflammatory mediators such as TNF-α, IL-6 and leptin.
The hyperglycaemic state results in deposition of AGEs in the periodontal tissues (as
well as elsewhere in the body), and binding of the receptor for AGE (RAGE) results
in local cytokine release and altered inflammatory responses. Neutrophil function is
also altered in the diabetic state, resulting in enhancement of the respiratory burst
and delayed apoptosis (leading to increased periodontal tissue destruction). Local
production of cytokines in the periodontal tissues may, in turn, affect glycaemic
control through systemic exposure and an impact on insulin signalling. All of these
factors combine to contribute to dysregulated inflammatory responses that develop
in the periodontal tissues in response to the chronic challenge by bacteria in the
subgingival biofilm, and which are further exacerbated by smoking.19
The hyperglycaemia associated to uncontrolled DM increases the
formation of AGEs, including low density lipoprotein (LDL)-AGE, and is associated
with the largest amount of LDL-oxidised. Both AGEs and LDL-oxidised, present at
the same time in the blood of patients with DM, have several biological effects on
lymphocytes and monocytes. These cells are involved in the pathogenesis of various
diseases associated with DM, such as lower resistance to infections, vascular disease
and greater severity of the periodontitis.10
Elevated concentrations of a variety of oxidative stress markers were linked
Page 10
been detected to be significantly correlated with Type 2 diabetes mellitus as well as
with the occurrence and the severity of coronary artery disease (CAD). An elevated
level of MDA indicates increase in production of oxygen free radicals suggesting the
possible risk in atherogenesis, leading to coronary heart diseases.16 There is strong
evidence that inflammation plays a key role in the cascade of atherosclerosis, from
its beginning to development of instability and plaque rupture. Raised levels of
inflammatory mediators particularly CRP predict cardiovascular events. HsCRP is a
powerful marker of vascular risk in a wide range of populations and, as such, is a
powerful research tool in assessing at-risk populations. Determination of these
markers contributes to understanding the development of and prevention of CVS
disorders.17
MICRONUCLEI IN PERIODONTITIS AND DIABETES MELLITUS
Periodontal tissue destruction and local inflammation were significantly
more severe in diabetics. Frequency of binucleated cells with MN and MNF, as well
as nucleoplasmic bridges, were significantly higher for poor controlled diabetics
with dyslipidemia and PD in comparison with those systemically healthy, even after
adjusting for age, and considering Bonferroni’s correction. Elevated frequency of
micronuclei was found in patients affected by type 2 diabetes, dyslipidemia and PD.
This result suggests that these three pathologies occurring simultaneously promote
an additional role to produce DNA impairment. In addition, the micronuclei assay
was useful as a biomarker for DNA damage in individuals with chronic degenerative
Page 11
There is an increasing effort worldwide to determine the impact of
environmental, genetic and life-style factors on genomic stability in human
populations. One technique that has been adopted by numerous laboratories is the
measurement of micronuclei (MN) in peripheral blood lymphocytes, epithelial cells,
erythrocytes and fibroblasts.20
Srinivasan et al 2017 demonstrate cytologic changes of the exposed oral epitheial cells using H&E staining, concluded that micronuclei frequency, enlarged
nucleus, perinuclear halo, binucleation, cytoplasmic streaks, candida and
inflammation were found to be statistically significant.21
Rathod et al 2016 assess the micronucleus frequency (MNF), as a biomarker for DNA damage, in individuals with type 2 Diabetes Mellitus and chronic
periodontitis. A total of 60 subjects were recruited for the study and divided into
three groups. 20 subjects of group 1 had diabetes mellitus along with chronic
periodontitis, Subjects with Diabetes mellitus and healthy periodontium were
allotted to group 2 and group 3 include Subjects without Diabetes melilitus and with
Chronic Periodontitis. Periodontal clinical examination was done. Blood sample
collected was use to prepare a slide which was fixed in 5% giemsa solution and was
analyzed in microscope then scoring of micronuclei was done. The mean
micronuclei observed in group 1, 2 and 3 were 14.8, 11 and 10.85 respectively i.e.
group 1 shows significantly greater damage than other two groups. It was concluded
that CBMN method was useful as a biomarker for DNA damage in individuals with
chronic degenerative systemic diseases such as type 2 DM, as well as chronic local
Page 12
Zamora Perez et al 2015 evaluate DNA and oxidative damage in subjects with chronic or aggressive periodontitis and healthy controls. Buccal mucosa cells
and whole saliva were collected from 160 subjects, who were divided into three
groups: subjects with chronic periodontitis (CP) (n = 58), subjects with aggressive
periodontitis (AgP) (n = 42) and a control group (n = 60). DNA damage was
determined by counting micronuclei (MN) and nuclear abnormalities (NAs) in
exfoliated cells, including binucleated cells, cells with nuclear buds and karyolitic,
karyorrhectic, condensed chromatin and pyknotic cells. The degree of oxidative
stress was determined by quantifying 8-hydroxy-20-deoxyguanosine (8-OHdG) in
whole saliva. Subjects with CP or AgP presented significantly more (p < 0.05) MN
and NAs and higher levels of 8-OHdG (p < 0.05) compared with the control group.
Their results indicate that subjects with periodontitis (CP or AgP) exhibited an
increase in the frequency of MN, NAs and 8-OHdG, which is directly related to
DNA damage. In addition, a positive correlation exists between oxidative stress
produced by periodontitis disease and MN.22
Corbi et al 2014 assess the micronucleus frequency (MNF), as a biomarker for DNA damage, in individuals with type 2 DM, dyslipidemia and PD. One
hundred and fifty patients were divided into five groups based upon diabetic,
dyslipidemic and periodontal status (Group 1 – poor controlled DM with
dyslipidemia and PD; Group 2 – well-controlled DM with dyslipidemia and PD;
Group 3 – without DM with dyslipidemia and PD; Group 4 – without DM, without
dyslipidemia and with PD; and Group 5 – without DM, dyslipidemia and PD).
Blood analyses were carried out for fasting plasma glucose, HbA1c and lipid profile.
Page 13
processed for micronucleus (MN) assay. The frequency of micronuclei was
evaluated by cell culture cytokinesis-block MN assay.10
Bastos-Aires et al 2013 characterize the frequency of micronuclei according to the periodontal status. For this purpose, we analysed oral exfoliated cells of 30
patients matched by age and sex (15 control patients with healthy periodontum to
mild periodontitis and 15 patients with moderate to severe periodontitis). Our results
indicated a 2.3-fold increase in MN basal levels in patients with moderate to severe
periodontitis compared to the control patients (P < 0.001), suggesting that the
periodontal status may affect MN reference levels. Periodontal disease can cause
changes in baseline levels of MNs. These preliminary results indicate that a better
characterization of oral health factors, which might influence MN levels in oral
epithelial cells.23
Avula et al 2012 in their study Micronuclei frequency was analyzed in the peripheral lymphocytes of 10 patients with chronic periodontitis (CP), 10
patients with generalized aggressive periodontitis (GAP) and 10 healthy controls.
Various clinical parameters like the probing depth, clinical attachment level, and
percentages of sites with bleeding and plaque were recorded. The results indicated
that the cytogenetic damages in the periodontitis groups were not different from
those in the control group.24
Shettigar et al 2012 evaluated the induction of micronuclei due to increased glycosylation in type 2 diabetes. Forty-nine subjects divided into two
groups of normoglycemic controls and type 2diabetic cases were recruited in the
Page 14
was correlated with age, sex, blood glucose levels and glycosylated hemoglobin.
Age and sex matched diabetic patients had an increased micronuclei frequency in
response to elevated glycosylation of haemoglobin compared to normoglycemic
subjects. The increased glycosylation seems to induce oxidative damage in the DNA
of the diabetic patients, which manifests as an increased micronuclei frequency. This
has a potential to be used as a biomarker for subsequent diabetic complications.25
Zuniga-Gonzalez et al 2007 demonstrated that either controlled (glycosylated haemoglobin levels 7%) or uncontrolled diabetic patients
(glycosylated haemoglobin levels.7%) had 2-fold higher frequency of MNs in
buccal mucosa samples than healthy subjects.26
Martinez Perez et al 2007 A case–control study was carried out on a sample of 15 Mexican patients (40–56 years old) with type 2 diabetes mellitus
(DM2) that had developed five years and been treated with oral hypoglycemic drugs
(sulfonylurea and/or metformin), with no microvascular or macrovascular
complications. Result showed a MN frequency significant increase in DM2 patients
(6.53 ± 2.03 per 1000 cells) relative to that of the control group (3.10 ± 1.79 per
1000 cells). MN may constitute a possible component of a panel of biomarkers for
the risk of DM2.27
MDA IN PERIODONTITIS AND DM
Periodontitis is a term used to describe an inflammatory process, initiated by
plaque biofilm, that leads to loss of periodontal attachment to the root surface and
adjacent alveolar bone and which ultimately results in tooth loss.The gram-negative
Page 15
etiologic agents but the majority of periodontal destruction occurs due to an
inappropriate host response to these pathogens. Polymorphonuclear leukocytes
(PMNs) are the primary mediators of host response against pathogens and they
generate increased levels of reactive oxygen species (ROS).Reactive oxygen species
(ROS) is a term collectively describing oxygen free radicals and other non-radical
oxygen derivatives involved in oxygen radical production. Reactive oxygen species
(ROS) have a very short life (10-6-10-9 seconds), so it is not easy to detect its
presence. The ROS-mediated tissue destruction could be measured by the final
product of lipid peroxidation (LPO), such as malondialdehyde (MDA). Oxidative
stress is implicated in various pathological conditions such as rheumatoid arthritis,
DM, and Periodontitis.1
Trivedi et al 2014 evaluate and compare free radical damage in the form of malondialdehyde (MDA) levels in whole saliva and plasma in diabetic chronic
periodontitis patients and systemically healthy chronic periodontitis patients. Sixty
CP patients (30 type 2 diabetics [DMCP] and 30 systemically healthy [CP]) and 60
periodontally healthy (30 type 2 diabetics [DMPH] and 30 systemically healthy
[PH]) were included in the study. After clinical measurements, blood and saliva
samples were collected. SOD, GR, and CAT activities in red blood cell (RBC) lysate
and saliva and MDA levels in plasma and saliva samples were
spectrophotometrically assayed. ANOVA test followed by post-hoc test was used to
compare the intra and inter group variances amongst the study groups. MDA levels
in both the periodontitis groups were higher than periodontally healthy groups but
the difference between CP and DMCP groups did not reach statistical significance
Page 16
periodontitis. It shows that the compensatory mechanism of the body is partially
collapsed due to excessive production of free radicals during periodontitis, and is not
able to cope with increased free radical generation due to diabetes thereby
worsening the situation.1
A meta-analysis by Liu et al 2014 show that periodontitis patients had higher MDA levels than periodontal healthy controls (SMD = 0.99; 95% CI: 0.12,
1.86; 𝑃 = 0.026). This meta-analysis systematically summarized the results of 16
independent studies from different countries and suggested that oxidative stress
biomarkers TAOC levels in peripheral blood were lower and MDA and NO levels in
peripheral blood were higher in periodontitis patients than healthy subjects, which
indicated an elevation in systemic oxidative stress status in periodontitis patients.
This evidence suggested that chronic periodontitis was associated with systemic
oxidative stress in human bodies. Our findings further indicated that clinical
intervention of periodontitis may be beneficial for periodontitis patients systemic
oxidative stress control and reduce its potential effect to systemic diseases.28
Al-Rawi et al 2011 assess the salivary content of lipid peroxidation and antioxidants in patients with type 2 diabetes. They studied 25 patients with type 2
diabetes and other 25 age- and sex-matched health control. To evaluate the oxidative
status we measured the levels of malondialdehyde (MDA) in the saliva and serum of
all participants. Lipid profile was also estimated through measuring total cholesterol,
triglycerides, low-density lipoprotein cholesterol (LDL-C), high-density lipoprotein
cholesterol (HDL-C) and very low-density lipoprotein cholesterol (VLDL-C) levels.
Antioxidant levels were also assessed through measuring the salivary and serum
Page 17
The high concentration of lipid fractions in saliva usually follows that recorded in
serum. Salivary MDA levels, a product of lipid peroxidation, were significantly
increased among diabetics together with uric acid. However, GSH levels were
similar to those of the control group. In this study concluded that Lipid peroxidation
and antioxidant parameters assessed in saliva of diabetic patients may be of great
importance in evaluating the disease activity and severity. The increase in lipid
peroxidation and the tendency of antioxidants to rise in diabetes is probably due to
an adaptive response to the pro-oxidant status of diabetes.29
Akalin et al 2007 investigatedMDA levels and total oxidant status (TOS) in serum, saliva and gingival crevicular fluid (GCF) in patients with chronic
periodontitis (CP). Thirty-six CP patients and 28 periodontally healthy controls were
included in the study. Following clinical measurements and samplings, MDA and
TOS levels were measured by high-performance liquid chromatography and a novel
automatic colorimetric method, respectively. While the saliva and GCF MDA levels
and serum, saliva and GCF TOS values were significantly higher in the CP group
than the control group, no significant difference in serum MDA levels was found.
Strong positive correlations were observed between periodontal parameters and
MDA and TOS levels. The results revealed that LPO significantly increased locally
in the periodontal pocket/oral environment, while TOS displayed both systemic and
local increases in periodontitis. The findings suggest that increased LPO and TOS
may play an important role in the pathology of periodontitis, and are closely related
Page 18
Hs-CRP IN PERIODONTITIS AND DM
The role of periodontal disease in the etiology of cardiovascular
disease (CVD) has recently received considerable attention. Several observational
epidemiologic studies have found that poor periodontal health status is associated
with an increased risk for CVD.31
C-reactive protein an acute-phase protein found in the blood, the levels of
which rise in response to inflammation is linked closely to diabetes and periodontal
infection. In various diseases that result in tissue injury or inflammation, the CRP
levels may rise within hours after an acute event. It is though that elevated CRP
levels assist in complement binding to foreign and damaged cells and enhance the
humoral response to the disease.
The function of immune cells including neutrophils is decreased in
diabetes but the monocyte/macrophage cell line may be hyper responding when
faced with bacterial antigenic contact. This hyper response results in a greater
production of pro-inflammatory cytokines as tumor necrosis factor alpha and IL-6,
which result in elevation of CRP levels. The measurement of elevated CRP levels in
periodontitis and diabetes are helpful in clinical diagnosis, therapy and monitoring
of inflammatory conditions.13
Gupta et al 2017 assessed the levels of CRP in patients with and without periodontitis and their relation with BMI and smoking behaviour. Total 31 subjects
in each group: Case (periodontitis) and Control (without periodontitis) were selected
using convenience sampling technique. All subjects underwent periodontal
Page 19
periodontal treatment. Results showed increase in mean CRP levels in periodontitis
(5.8595mg/L) with high statistical significance (P=0.000) in comparison to subjects
without periodontitis (1.1214mg/L) was observed. BMI showed positive association
with periodontitis (P=0.046) but not with CRP (0.213). Smoking behaviour showed
no significant relation with either CRP (P=0.344) or periodontitis (P=0.541). They
found highly significant association between periodontitis and CRP levels but not
always with BMI and smoking. CRP, which is an established marker for CVD was
significantly increased in periodontal infections. Hence, a close interaction among
Physician, Periodontist and Patient to prevent adverse health situations is
recommended.32
Martu et al 2017 investigated the serum C-reactive protein (CRP) values in the presence of A.actinomycetemcomitans, P. gingivalis, T. denticola or T. forsythia
bacteria, as an indicator of the cardiovascular risk. The study consisted of 64 male
and female subjects, aged 55 to 75 years. Periodontal parameters were examined,
serum CRP was analyzed, and Porphyromonas gingivalis, A.
actinomycetemcomitans, T. forsythia and T. denticola from the subgingival bacterial
plaque were detected by real-time quantitative polymerase chain reaction (qPCR).
Pathogen prevalence rates were: 45.0% P. gingivalis; 20.5% A.
actinomycetemcomitans; 86.1% T. forsythia; 86.3% T. denticola. The mean CRP
was 1.5 mg / L. There was a significant difference in CRP values between subjects
who had P. gingivalis compared to those without. There were no significant
differences for any of the other pathogens. The presence of P. gingivalis was
Page 20
investigated, only the presence of P. gingivalis in subgingival plaque samples was
significantly associated with a high level of C-reactive protein.33
Anwar et al 2016 examined the plasma C-reactive protein levels in Pakistani population in association with periodontitis and diabetes. Patients were divided in
four groups; group I (normal healthy), group 2 (periodontitis), group 3 (diabetes)
and group 4 (both periodontitis and diabetes). Each group comprised 20 patients.
Patients who have at least 15 teeth and age between 30-60 years were included. The
obtained values of the patient samples and control sera were multiplied by dilution
factor of 100 to obtain CRP results in mg/l. Statistically significant difference of
C-reactive protein levels is present between periodontitis, diabetes and periodontitis
diabetes group as compared to control group (P<0.05). They concluded that the CRP
levels are raised with periodontitis and diabetes, and if both are present in a person,
these levels are further elevated.13
Shojaee et al 2013 compared of the amount of salivary C - reactive protein (CRP) in healthy subjects and patients with periodontal disease. In this study
subjects were divided into three groups of healthy (n = 30), gingivitis (n = 30), and
chronic periodontitis (n = 30), based on Gingival Index (GI) and Clinical
Attachment Loss (CAL) indices. 2ml saliva samples were collected from these
people and clinical indicators including GI, CAL, Periodontal Pocket Depth (PPD),
and Bleeding Index (BI) were assessed. ELISA method was used to evaluate the
salivary CRP levels. The statistical analysis showed a significant difference in
salivary CRP concentrations between the periodontitis patients and healthy subjects.
The results indicate that there is a significant association between periodontitis and
Page 21
Nakajima et al 2010 found out that the concentrations of hs-CRP and IL-6 in the sera of periodontitis patients was significantly higher than those in control
subjects. They concluded that Although periodontal infection does affect the
concentration of hs-CRP and IL-6 in serum, a subgroup of patients exist who are
highly susceptible to an increased risk of CHD associated with periodontitis,
suggesting that there may be subjects who have an elevated risk of CHD
independent of susceptibility to periodontal tissue destruction per se.35
A systematic review and meta-analysis by Paraskevas et al 2008 explored the robustness of observations that CRP is elevated in periodontitis. Similarly, the
effect of periodontal therapy on CRP levels was investigated. In conclusion, this
systematic review provides evidence that periodontitis elicits a mild acute-phase
response with elevation of CRP levels compared with healthy controls. Periodontal
treatment results in lowered CRP levels.36
Salzberg et al 2006 were working on elevated levels of C-reaction protein in periodontitis. The elevated inflammatory cytokines levels associated with
destructive periodontal diseases cause an increase in CRP levels.37
Persson et al 2005 assess periodontal status and hsC-rp serum levels in consecutive subjects hospitalized and diagnosed with acute myocardial infarction
(AMI) and in a group of carefully matched subjects (gender, age social, ethnic, and
smoking habits) without clinical evidence of CVD. They found that the hs-CRP
level to be above 10.0 mg/l in all the subjects in which evidence of significant
alveolar bone loss was present indicating periodontitis. Thus, the level of CRP tends
Page 22
Joshipura et al 2004 evaluated cross-sectionally the association between periodontal disease and C-reactive protein (CRP), fibrinogen, factor VII, tissue
plasminogen activator (t-PA), LDL-C, von-Willebrand factor, and soluble tumor
necrosis factor receptors 1 and 2. They concluded that periodontal disease showed
significant associations with biomarkers of endothelial dysfunction and
dyslipidemia, which may potentially mediate the association between periodontal
Page 23
STUDY DESIGN
This is a comparative interventional study for evaluating the
Micronuclei frequency, serum Malondialdehyde levels and serum High sensitive
C-reactive protein levels in chronic periodontitis patients with and without well
controlled type 2 diabetes mellitus before and 3 months after scaling and root
planning procedures.
STUDY SETTING
Chronic periodontitis patients with and without diabetes mellitus
patients for the study were selected from the outpatient of department of
periodontics, Sree mookambika institute of dental sciences, Kulasekaram.
STUDY DURATION
The study duration was of one year, which lasted from January 2018
to December 2018.
INFORMED CONSENT AND ETHICAL CONSIDERATIONS
The study protocol was approved by the institutional research
committee of Sree mookambika institute of dental sciences (Ref No: 17/09/2017)
and also by the Institutional Human Ethics Committee of Sree mookambika institute
of medical sciences, Kulasekaram (SMIMS/IHEC No: 2/PROTOCOL No: 36/2017)
and was registered under the Clinical trials Registry of India
Page 24
Study protocol was explained to patient and the information on the nature
and potential benefit of their participation in the study was also explained. Informed
consent was obtained from all subjects after screening.
SAMPLE SIZE CALCULATION
Sample size was calculated based on the previous study by Rathod et al
2016.
The sample size N= ( )
= 0.84
Power = 1- = 80%
N= ( ) = 15.7x = 21.8 rounded off to 25 for each group.
The number of participants required in each intervention group is 25.
Page 25
The selected patients were assigned into three groups, each group consisting
of 25 patients
Group I – Twenty five chronic periodontitis patients with well controlled
type 2 diabetes mellitus.
Group II – Twenty five chronic periodontitis without type 2 diabetes mellitus
Group III – Twenty five healthy control patients
INCLUSION CRITERIA
Group I – Twenty five chronic periodontitis patients with well controlled
type 2 diabetes mellitus.
1. Patients with chronic periodontitis was diagnosed when there was
two or more interproximal sites with CAL > 4 mm, not on the same
tooth, or two or more interproximal sites with PPD > 5 mm, not on
the same tooth. (Page and Eke 2007)
2. Patients with > 20 teeth
3. Patients with clinical bleeding on probing
4. Patients were considered to be well controlled Type 2 diabetic when
presenting with fasting blood glucose levels of 126mg/dL, and
glycated hemoglobin (6.0 to 6.5%). [According to the criteria of
American Diabetes Association 2010]
Page 26
1. Patients with chronic periodontitis was diagnosed when there was
two or more interproximal sites with CAL > 4 mm, not on the same
tooth, or two or more interproximal sites with PPD > 5 mm, not on
the same tooth. (Page and Eke 2007)
2. Patients with > 20 teeth
3. Patients with clinical bleeding on probing
Group III – Twenty five healthy control patients
1. Patients with clinical bleeding on probing
2. Patients with > 20 teeth
EXCLUSION CRITERIA
Subjects will be excluded if
1) They suffer from any systemic condition (except Type 2 Diabetes mellitus)
that could affect the progression of periodontal disease (immunological
disorders), smokers and former smokers, alcoholics and former alcoholics,
obese, pregnant and lactating women and those taking oral contraceptive
drugs.
2) There is a presence of an active infection other than periodontitis.
3) There is an intake of antibiotics/ corticosteroids and or non-steroidal
anti-inflammatory drugs during the previous 4 weeks.
Page 27
5) They had received professional periodontal treatment during the 6 month
period prior to the study.
6) They had used mouth rinses containing antimicrobials in the preceding 2
months.
7) Subjects with periapical pathology, orthodontic appliances and multiple
systemic complications of diabetes mellitus, inflammatory bowel disease,
psoriasis, RA, Nephritis will also be excluded from the study.
CLINICAL PARAMETERS
Periodontal examination was conducted in the Department of
Periodontics, Sree Mookambika institute of dental sciences, Kulasekaram. The
following clinical parameters were assessed using UNC 15 probe (Colour Plate – 1). Clinical parameters were measured at six sites of all teeth (mesiobuccal, miduccal, distobuccal, mid lingual and distolingual) at baseline and 3 months
following non-surgical periodontal therapy.
1. Plaque index(PI)
2. Gingival index (GI)
3. Probing pocket depth (PPD)
4. Clinical attachment level (CAL)
LABORATORY PARAMETERS
Page 28
2. Serum Malondialdehyde (MDA) level
3. Serum High sensitive C-reactive protein level (Hs-CRP)
4. Glycated haemoglobin (HbA1C)
5. Random blood sugar (RBS)
6. Total cholesterol level
7. Triglycerides
ARMAMENTARIUM
The collection of blood and non-surgical periodontal therapy were
performed with the following equipment’s (Colour Plate – 2)
1. Mouth mirror
2. UNC 15 periodontal probe
3. Gracey area specific curette
4. 23 Gauge 6 ml disposable syringe
5. Clot activator tube
6. Vacutainer
Page 29
PROCEDURE
After the patients were included in the study, the 6 ml of blood was collected
by venepuncture (Colour Plate – 3). PI, GI, PPD, and CAL were recorded from each patient of the three groups. The clinical and laboratory parameters recorded at
baseline were given as T0. After baseline evaluation all the patients received
non-surgical periodontal therapy, which include oral hygiene instructions, supragingival
and subgingival scaling and root planing under local anaesthesia using ultrasonic
instruments and hand instruments as needed. Patients were recalled after 3 months
during which clinical parameters were recorded
SAMPLE PREPARAION
Collect fresh blood by venepuncture and 3 ml of blood was transferred to
heparinised vacutainers and remaining 3 ml blood was transferred into clot activator
tube (Colour Plate – 4). This clot activator tube was centrifuged at 3000 rpm for 3 minutes to separate serum (Colour Plate – 5, 6). Collected serum was transferred into ependorf tube. All the samples send on the same day to Genetika centre for
Page 30
PATIENTS WITH CHRONIC PERIODONTITIS, TYPE 2 DIABETES
MELLITUS HEALTHY CONTROLS PATIENTS WITH CHRONIC
PERIODONTITIS
Blood Sample Taken
PERIODONTAL PARAMETERS Plaque Index (Silness and Loe ,
1964)
Gingival Index (Loe and Silness, 1963)
Probing pocket depth Clinical Attachment Level (CAL) LAB PARAMETERS
Micronuclei frequency Malondialdehyde level
Hs – CRP level HbA1C level
RBS Total cholesterol
Triglyerides
SCALING AND ROOT PLANING DONE AFTER THREE MONTHS
LAB PARAMETERS Micronuclei frequency Malondialdehyde level
Hs – CRP level HbA1C level
RBS Total cholesterol
Triglycerides
PERIODONTAL PARAMETERS Plaque Index (Silness and Loe ,
1964)
Gingival Index (Loe and Silness, 1963)
Probing pocket depth Clinical Attachment Level (CAL)
Page 31
Protocol for CBMN assay
Collect fresh blood by venepuncture and transfer to heparinised vacutainers
and the collected blood samples are send on the same day to Genetika centre for
advanced genetic studies, Trivandrum.
1.
Isolate lymphocytes on lymphoprep (pharmacia) gradients as follows: Add2ml of lymphoprep to a 10ml centrifuge tube and carefully overlay 4ml of
diluted blood sample (Colour Plate – 8).
2.
Centrifuge at 1000rpm for 10min.3.
Drawn off the lymphocyte layer using a sterile Pasteur pipette and transfer toa 10ml tube.
4.
Suspend the cell pellet in RPMI 1640 medium and centrifuge for 10 minutes.5.
Remove the supernatant and repeat step 5.6.
Culture the lymphocytes in sterile bottles using RPMI 1640 mediumcontaining 15% foetal calf serum. Lymphocytes stimulate to divide with
phytohaemagglutinin (PHA) and incubate for 72 hours at 37ºC (Colour Plate – 9).
7.
44 hr after PHA stimulation, add cytochalasin-B to the cultures to give aPage 32
8.
28 hr after addition of cytochalasin –B, transfer the whole contents into asterile centrifuge tube and centrifuge for 10 minutes; remove the supernatant,
shack the pellet in a cyclomixer.
9.
Add 10 ml of 0.075 M KCL solution to the cell button and kept at 37ºC for10 minutes (Colour Plate – 11).
10.
After this, add 2 drops of freshly prepared fixative (Methanol: Acetic acid) inthe ratio 3:1.Again centrifuge at 1000 rpm for 10 minutes.
11.
Remove the supernatant and mix the cell button in a cyclomixer and add 10ml of freshly prepared fixative and centrifuge at 1000 rpm for 10 minutes.
12.
Repeat this process until the supernatant becomes clear and the cell buttonbecomes white.
13.
From the cell button, prepare cell suspension.14.
Drop the cell suspension drop by drop on to pre cleaned, labeled, and chilledslides (Colour Plate – 12).
15.
Air-dry the slides for 10 min, then fix in absolute methanol for 10 min andstain with May-Grunwald Giemsa for 10 minutes.
16.
Code the slides before scoring and examine at 100X magnification (Colour Plate – 13). The number of MN in no less than 1000 binucleated cells should be scored and the distribution of MN among binucleated cells should bePage 33
CRITERIA FOR IDENTIFYING BINUCLEATED CYTOKINESIS BLOCK CELLS
The cytokinesis blocked cells scored for micronucleus frequency have to
satisfy the following criteria:
Cells should have two nuclei of approximately equal size;
The 2 nuclei may be attached by a fine nucleoplasmic bridge; and
The 2 nuclei may overlap slightly or touch each other at the edges.
Cells should not contain more than 6 micronuclei.
CRITERIA FOR IDENTIFYING MICRONUCLEI
Micronuclei are morphologically identical to, but smaller than normal nuclei.
They also have the following characteristics.
Diameter between 1/6 and 1/3 that of the main nuclei.
They are non-refractile.
They are not linked to the main nuclei via a nucleoplasmic bridge.
Micronuclei may sometimes overlap the boundaries of the main nuclei.
PREPARATION OF REAGENTS
Phytohaemagglutinin (PHA-M: 5mg stock):-
Page 34
Hypotonic KCl solution (0.075M):-
Dissolve 5.6gm of KCl (99.9%), (MW-74.55) in 1000ml of distilled water.
Fixative [Methanol and Glacial Acetic acid in the ratio 3:1 (v/v)]:-
Mix three parts of absolute methanol (99.8%) (32.04g/mol) and one part of
glacial acetic acid (99.7%) (MW-60.05). Methanol acts as a fixative and acetic acid
as the scavenger. Better morphological fixation occurs at low temperatures.
Cytochalasin-B: - Dissolve 1mg Cytochalasin-B in 1ml of dimethyl sulpoxide and store in freezer.
PREPARATION OF MEDIA
1) RPMI 1640 medium
1. Suspend the content of one unit vial in 950 ml of sterililized tissue culture
grade water at room temperature with constant, gentle stirring until the
medium is completely dissolved. Rinse the container with tissue culture
grade water to remove all traces of powder and add to the above solution. Do
not heat the water.
2. Add the required amount of sodium bicarbonate (2.25gm/l) as per the
requirement and stir until dissolved.
3. Adjust the pH to 0.2-0.3 pH unit below the desired pH (7.4) using 1N
Hydrochloric acid or Sodium Hydroxide since the pH tends to rise during the
Page 35
4. Aseptically add sterile supplements (100μgm/ml Benzyl penicillin,
100units/ml streptomycin, 50μgm/ml Amphoterecin B, 15% foetal bovine
serum, etc). Make up the final volume to 1000 ml with tissue culture grade
water.
5. Sterilize the medium immediately by filtering through a sterile membrane
filter with porosity of 0.2 micron or less using positive pressure to minimize
the loss of carbon dioxide and dispensed the desired amount of sterile
medium in to sterile containers. Store at 2-6°C till use.
Malondialdehyde (MDA) Malondialdehyde in serum is separated and determined as conjugate with Thiobarbituric acid (TBA). Serum proteins were precipitated by
Trichloroacetic acid (TCA) and then removed by centrifugation. The MDA – TBA
complex was measured at 540 nm11.
Reagents
Reagent A- 15% TCA in 100ml 0.25N Hydrochloric acid
Reagent B- 0.375% TBA in 100ml 0.25N Hydrochloric acid
Mix reagent A & B well and keep it in 2-8 ºC.
Protocol
1. Collect venous blood and transferred to a free tube, then allow clotting.
2. Centrifuged at 3000 rpm for 5 minutes & the serum are then removed to
another plain tube & store at -2 ºC until the time of analysis.
Page 36
4. The tubes were mixed well & incubated in boiling bath for 15 minutes.
5. Allow cooling, and then the tubes are left to stand at room temperature for 20
minutes.
6. Centrifuge at 2000 rpm for 15 minutes & then the supernatant layer was read
at 540 nm (Colour Plate – 7).
The concentration of MDA (nmol/ml) was calculated by using the following
formula:
Concentration of the test = ( )
Reference range = 0.7 – 1.9 U/l
High sensitive C Reactive Proteins or hs-CRP (Turbidometric Immunoassay)
Principle: The hs-CRP is a turbidmetric immunoassay for ultrasensitive determination of C-reactive protein in human serum. It is based on the principle of
agglutination reaction. The test specimen is mixed with latex reagent and activation
buffer and allowed to react (Colour Plate – 15). The presence of CRP in the test specimen results in the formation of insoluble complex producing turbidity, which is
measured at a wavelength between 505-578 nm. The increase in turbidity
Colour plate 1 – Recording clinical parameters
Colour plate 3 – Blood collection
Colour plate 5 – REMI Laboratory centrifuge
Colour plate 7 – Semi auto analyser (MISPA – NEO) for MDA evaluation
Colour plate 10 – Cell culturing
Colour plate 12 – Cell harvesting
Colour plate 15 – Hs-CRP kit (EURO DIAGNOSTIC SYSTEMS)
Page