A cross-sectional analysis to explore the theoretical link between multimodality and the
intention to change mode choice.
.
White Rose Research Online URL for this paper:
http://eprints.whiterose.ac.uk/129602/
Version: Accepted Version
Article:
Heinen, E orcid.org/0000-0001-8428-5709 (2018) Are multimodals more likely to change
their travel behaviour? A cross-sectional analysis to explore the theoretical link between
multimodality and the intention to change mode choice. Transportation Research Part F:
Traffic Psychology and Behaviour, 56. pp. 200-214. ISSN 1369-8478
https://doi.org/10.1016/j.trf.2018.04.010
(c) 2018 Elsevier Ltd. All rights reserved. Licensed under the Creative Commons
Attribution-Non Commercial No Derivatives 4.0 International License
(https://creativecommons.org/licenses/by-nc-nd/4.0/).
[email protected] https://eprints.whiterose.ac.uk/
Reuse
This article is distributed under the terms of the Creative Commons Attribution-NonCommercial-NoDerivs (CC BY-NC-ND) licence. This licence only allows you to download this work and share it with others as long as you credit the authors, but you can’t change the article in any way or use it commercially. More
information and the full terms of the licence here: https://creativecommons.org/licenses/
Takedown
If you consider content in White Rose Research Online to be in breach of UK law, please notify us by
Are multimodals more likely to change their travel behaviour? A cross-sectional analysis to
explore the theoretical link between multimodality and the intention to change mode choice.
Eva Heinen
University of Leeds
Institute for Transport Studies Faculty of Environment LS2 9JT Leeds
United Kingdom
Phone +44(0) 113 2431790 e-mail: [email protected]
and
Delft University of Technology
Faculty of Technology, Policy & Management Department of Transport & Logistics
Abstract
Existing research suggests that being more multimodal (i.e. the use of more than one transport mode within a given period of time) increases the likelihood of changing travel behaviour over time. However, alternative explanations may have contributed to these findings. Many well-known
psychological theories state that the actual demonstration of a behaviour is preceded by an intention to demonstrate this behaviour. Therefore, one essential step towards the determination of a causal relationship between multimodality and behaviour change is to investigate whether multimodality increases the intention to change.
This paper explored to what extent multimodality was associated with the intention to change the level of cycling, walking, car use, and train use. Our findings showed that the more multimodal individuals were, the more likely they intended to decrease their car use.However, most associations between multimodality and the intention to change mode choice were non-significant. This could be interpreted to mean that there is no relationship between multimodality and the intention to change. However, the significant findings for car use, and the direction of most (non-significant) associations in our analyses were intuitive. Therefore, our analyses are not conclusive on whether or not the level of multimodality is associated with the intention to change and actual behavioural change. Additional research will be necessary to test the proposed link between multimodality and behavioural change. Three lines of additional research that focus on associations between multimodality and behavioural change, multimodality and the intention to change behaviour, and variability and stability of
individual behaviour over time, respectively, are particularly important.
Research highlights:
Multimodality may be a predictor of behavioural change;
We investigated whether it was associated with the intention to change mode choice;
Our analyses revealed mostly non-significant, but intuitive associations;
Multimodal individuals were more likely to intend to decrease their car use;
Additional research will be necessary on multimodality and behavioural change.
1. Introduction
Transport has negative consequences on our health, the environment and urban liveability. In particular, the dominance of the car in the transport system may contribute to this. Policies have aimed to generate a modal shift away from the car with initiatives that include subsidies, improving the facilities for active travel and public transport, and restrictive car access. Recently, increased policy attention has been placed on encouraging a partial shift instead of a full modal shift (EC 2014).
In the scientific debate, the mixed use of different transport modes—referred to as
multimodality, the use of more than one transport mode within a given period of time—has recently gained increased attention (e.g. Jones and Clarke 1988; Huff and Hanson 1986; Kuhnimhof 2009; Nobis 2007; Buehler and Hamre 2015; Heinen and Chatterjee 2015; Susilo and Axhausen 2014; Kroesen 2014). Despite the fact that the number of studies on multimodality is still small, various topics have been addressed. The majority of studies have either focused on the prevalence of multimodality in a geographical area such as a country (e.g. Nobis 2007; Buehler and Hamre 2015; Heinen and Mattioli 2017), or have tried to identify the predictors of multimodality (e.g. Heinen and Chatterjee 2015; Susilo and Axhausen 2014; Kroesen 2014; Molin et al. 2016).
However, few studies have investigated whether variability may be a predictor itself of behavioural change. Two studies (Kroesen 2014; Heinen and Ogilvie 2016) have explicitly addressed this. Kroesen (2014) investigated the predictors of transitions between data-driven travel behaviour clusters and showed that individuals who used multiple modes compared to those that relied on one mode had a higher likelihood of changing from one travel behaviour cluster to another over time. Heinen and Ogilvie (2016) tested whether individuals who were more multimodal in their mode choice before an intervention were more likely to change their share of trips made entirely by car, partially by active travel and partially by public transport when facing an intervention. They
concluded that a higher level of multimodality at baseline was significantly associated with changes in all mode shares. More importantly, they also found a significant interaction effect between the
exposure to an intervention and multimodality for an increase in active travel and a decrease in car use, implying that individuals who had more variable behaviour at baseline were more receptive to the intervention.
Despite the fact that these results provide an indication that the level of multimodality may be a predictor of travel behaviour change, two other mechanisms may also explain these findings, both of which are related to the possibility that the predictor and outcome may not be independent. First, changes in travel behaviour and variability in travel behaviour cannot always be easily separated, and measured changes may, in part, be a result of variability. A ‘change in travel behaviour’ refers in here to a shift towards or away from a given mode of transport over time. Variability refers to the level of variation in modes of transport used by an individual within a certain period. Second, statistical coupling (Gilthorpe 2011) may be present between the measures of interest (change in travel behaviour on the one hand and group membership or baseline level of multimodality on the other). The first mechanism relates to the measurement of the variables, whereas the second relates to the mathematical calculation. Both mechanisms may result in the measurement of a significant
association between multimodality and change in travel behaviour, even if such an association is not present in reality (i.e. a type-1 error).
One essential step towards a better understanding the relationship between multimodality and changes in travel behaviour is to investigate the relationship between multimodality and the intention to change. Many well-known psychological theories state that the actual demonstration of a behaviour is preceded by an intention to show this behaviour (e.g. theories such as: the theory of planned
behaviour (Ajzen 1991) and the theory of reasoned action (Fishbein and Ajzen 2010)). Theories and models based on stages of change (e.g. Prochaska et al. 1992; Prochaska and Velicer 1997) also include the contemplation of new behaviour before experimentation with new behaviour. Therefore, if variability predicts the intention to change, this would offer support to the notion that previous
findings are not statistical artefacts, but rather that these findings support the proposed
literature is provided, followed by a discussion of the methods. Section 4 will present the results of our analyses, which will be discussed in Section 5. A short conclusion of the research is provided in Section 6.
2. Literature review
This section will discuss three aspects of multimodality: the measurement of multimodality, predictors of multimodality, and, finally, to what extent multimodality predicts changes in travel behaviour. The focus of this paper is this last aspect, but a discussion of the wider context of the topic in the scientific research helps to understand the phenomenon, provides a perspective to how multimodality is
distributed over the population, and illustrates the complexities of measuring multimodality.
2.1 Measurements of Multimodality
The topic of variability of travel behaviour and multimodality (mode choice variability) specifically has received attention in the travel behaviour research literature over the past few decades.
Multimodality is, broadly speaking, defined in three ways. The first definition method used to investigate multimodality is to define the use of modes in different predefined groups, such as multimodal car, monomodal car, and multimodal active travel groups (e.g. Nobis 2007; Buehler and Hamre 2015). The second measure is based on data-driven groups (e.g. Kroesen 2015), whereas the third method of multimodality characterisation is by using a continuous indicator to describe the level of variability (e.g. Heinen and Chatterjee 2015; Susilo and Axhausen 2014; Heinen and Mattioli 2017). These approaches to characterising multimodality vary from each other, but also within these approaches of characterisation much variation exists. Diana and Pirra (2016) reviewed several continuous indicators, some of which are often used in studies on multimodality and others that have potential to be applied. The measures Gini, Dalton, Atkinson, entropy, and Herfindahl indices were compared and the authors concluded that none of these indicators outperformed any other in all qualities considered. They however recommend the use of a variation of the Herfindahl index, as well as two variations of the Shannon entropy. However, the guidelines for which indicator to use are not clearly agreed upon yet. Perhaps more importantly, although these indicators may be more suitable to measure multimodality correctly, the interpretability of these indicators is more difficult, which makes it harder to use them as predictors.
In addition to the index of the level of multimodality, the duration over which travel behavior data are collected as well as how mode choice is measured differ among studies. In some surveys, the main mode is requested, whereas other surveys ask for all modes used for each trip. As a consequence of questionnaire design, some studies, therefore, are able to investigate multimodality only on a trip level, whereas others may also investigate multimodality at the stage level. These three potential differences among studies (indicator, duration, and survey question) complicate comparisons of the level of multimodality as well as the determinants and predictive power of multimodality among studies.
2.2 Predictors of multimodality
Various studies have investigated the predictors of variability (e.g. Nobis 2007; Buehler and Hamre 2015; Heinen and Chatterjee 2015; Susilo and Axhausen 2014; Kroesen 2014; Scheiner et al., 2016; Molin et al., 2016). Although some findings are unique to only few studies, and some findings are contradictory, overall, it appears that multimodality is more prevalent among women and in areas with higher population densities. Unimodal car users are, on average, more likely to be male, white, fulltime employees, individuals with young children, car owners, and (less often) students. Age results appear to vary among countries. Additionally, life events have been shown to predict changes in multimodality (Scheiner et al., 2016). For example, if a child moves out, this increases the
multimodality of their parents, as does leaving the labour market. Entering the labour market reduces the level of multimodality, whereas improvements in public transport increase the level of
multimodality and vice versa, as do reductions in car parking.
2.3 Multimodality as a predictor of behavioural change
variability in mode choice on the likelihood of travel behaviour change. They used three indicators of variability: the Hirfindel–Hirschman index (HHI), the number of different modes of transport used over a week, and the proportion of trips made by the main (combination of) mode(s) based on self-reported commute journeys over a seven-day period. Using data from a cohort study in Cambridge (n=450), they tested the influence of baseline variability on behaviour change, both independently and as an interaction effect with exposure to the intervention. They concluded that variability predicted changes in mode share for active travel, car travel, and public transport. Commuters with higher baseline variability were also more likely to increase their active mode share and decrease their car mode share in response to the intervention (as an interaction effect).
In another study, the predictors of transitions between data-driven travel behaviour clusters were investigated (Kroesen 2014). The clusters were based on three variables: the number of car trips, the number of public transport trips, and the number of bicycle trips. The author’s results showed that individuals who used multiple modes compared to those that relied on one mode had a higher
likelihood of changing from one cluster to another cluster over time. In particular, individuals who mainly relied on a bicycle or mainly relied on a car were the least likely to change. He also reported that transitions were predicted by individual characteristics and experiencing certain life events, in particular age, the residential environment, moving house and changing jobs.
Although these two studies suggest that being more multimodal increases the likelihood of behavioural change over time, these measurements could be explained differently, as discussed in the introduction. In the remainder of this paper, we will therefore investigate the relationship between multimodality and changing travel behaviour, by exploring the relationship between multimodality and the intention to change travel behaviour, which is theoretically a concept or phase before actual behavioural change. Additionally, as our search of the literature revealed that a consensus has not yet been reached on which indicator to use for multimodality, we therefore decided to explore this relationship by indices as well as determined groups.
3. Method
3.1 Setting and Data collection
Data were collected in Utrecht, the Netherlands (approximately 335,000 inhabitants). The city of Utrecht is the fourth largest in the Netherlands, and is home to a university and other higher
educational institutions. The city is centrally located in the Netherlands with Utrecht Central station serving as the main train station in the nation’s train network.
Questionnaire data were collected by post in June 2015. Municipality data were used to randomly approach individuals over 18 years of age and living in several areas of the city. To avoid biasing recruitment and responses, the study was presented to participants as a study on travel behaviour and travel behaviour change. The aim of investigating specific predictors of behaviour and behavioural change was not made explicit to potential respondents. One-thousand-sixty-two
individuals completed the online survey.
3.2 Outcomes
The outcome measures were the intention to change mode choice for several transport modes. This information was obtained by asking ‘to what extent do you intend to increase or decrease the use of the following modes (in the coming years)?’. We measured this intention on a seven-point scale for five modes: car, train, bus, bicycle, and walking. Given the distribution of the answers, we grouped the answers into ‘intend to decrease’, ‘intend not to change’, and ‘intend to increase’. We considered car use, bicycle use, walking, and train use in this paper (Table 1), given they had the largest variation in responses.
3.3 Covariates
3.4 Predictors
Given the debate in the literature whether to use an index or whether groups are more insightful to measure multimodality, we calculated both indices as well as determined groups, which were predefined as well as data-driven. These groups and predictors were based on self-reported travel diary. Individuals were asked to report their mode choice to and from work for a 14-day period in which respondents were asked to report all modes used during each trip (see also Heinen, 2016). Given that we use multimodality as a predictor, we gave preference to indicators that were more intuitive and widely used.
We calculated five indicators, which comprised three measures of variability at the stage level (a stage is a part of a trip; for example, a trip involving both cycling and bus travel would be
composed of two stages, one by bicycle and one by bus) and two measures of variability at the trip level (based on the mode or combination of modes of transport used for the entire trip). Variability at the stage level reflects the variation in all possible modes used, independent of whether these are used in combination with other modes and independent of the length of each stage. Variability at the trip level reflects the variation in the mode or combination of modes used between trips, and considers each combination of modes as a unique choice. We selected the variables that were easiest to interpret.
The first measure at the trip level was the number of different modes/modal combinations used in all trips. The second measure at the trip level was the highest share of a mode/modal combination use. Three indicators were calculated based on the modes used in the trip stages. The first of these indicators was a count variable of the number of different modes used in all legs. This is a very intuitive measure of the variety of modes being used. However, as it does not take the level of variation into account, we considered two other measures. The second indicator was an index, the Hirfindel–Hirschman index (HHI). The HHI, a measure of market concentration, which is one of the most commonly applied measures of mode choice variability (Heinen and Chatterjee 2015; Susilo and Axhausen 2014; Scheiner et al., 2016), is calculated as the sum of the squared values (S) of the share of each mode within all commuting trips (Rhoades 1993). A normalised index ranges from 0 to 1, where the closer to 1 the more one mode dominates an individual’s travel (see Heinen and Chatterjee 2015 for formulas). The third was one of the indicators recommended by Diana and Pirra (2016): OM_PI, which is based on the Shannon Entropy. OM_PI is appropriate when considering a set number of travel means, independent on whether an individual has access to it (Diana and Pirra 2016). Given the large number of modes we considered (10), this likely applies. The indicators ‘number of modes’ and OM_PI are indices of variabilityand higher values correspond with a greater level of multimodality, whereas HHI is an index for concentration where higher values correspond with less multimodality.
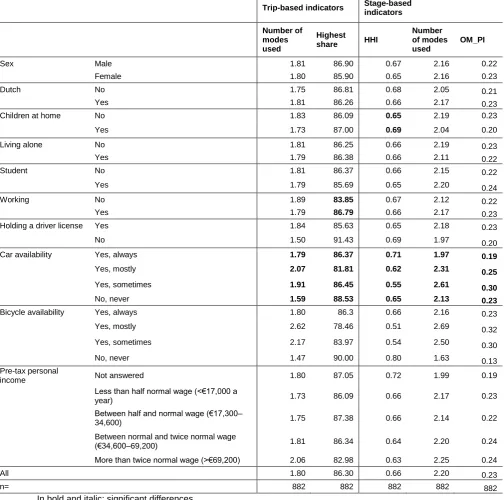
Table 1 shows the mean values for the numeric indicators of multimodality by
socio-economic group. This table reveals that several groups had higher levels of multimodality than other groups, but the overall differences were small. For example, individuals who were employed
generally rely more on one mode, indicated by a higher value of the highest mode share. Individuals with children at home showed less variable mode choice behaviour, which is indicated by a higher HHI. In general, individuals who did not own a car were more multimodal. An opposite trend was present for bicycle ownership: individuals who owned a bicycle were generally more multimodal. Individuals with a higher income (more than twice the mode) appeared to be more multimodal at a trip level, but only small differences were present at a stage level. These findings largely correspond with existing studies.
Table 1: Summary statistics of numerical indicators
Trip-based indicators
Stage-based indicators
Number of modes used
Highest share HHI
Number of modes used
OM_PI
Sex Male 1.81 86.90 0.67 2.16 0.22
Female 1.80 85.90 0.65 2.16 0.23
Dutch No 1.75 86.81 0.68 2.05 0.21
Yes 1.81 86.26 0.66 2.17 0.23
Children at home No 1.83 86.09 0.65 2.19 0.23
Yes 1.73 87.00 0.69 2.04 0.20
Living alone No 1.81 86.25 0.66 2.19 0.23
Yes 1.79 86.38 0.66 2.11 0.22
Student No 1.81 86.37 0.66 2.15 0.22
Yes 1.79 85.69 0.65 2.20 0.24
Working No 1.89 83.85 0.67 2.12 0.22
Yes 1.79 86.79 0.66 2.17 0.23
Holding a driver license Yes 1.84 85.63 0.65 2.18 0.23
No 1.50 91.43 0.69 1.97 0.20
Car availability Yes, always 1.79 86.37 0.71 1.97 0.19
Yes, mostly 2.07 81.81 0.62 2.31 0.25
Yes, sometimes 1.91 86.45 0.55 2.61 0.30
No, never 1.59 88.53 0.65 2.13 0.23
Bicycle availability Yes, always 1.80 86.3 0.66 2.16 0.23
Yes, mostly 2.62 78.46 0.51 2.69 0.32
Yes, sometimes 2.17 83.97 0.54 2.50 0.30
No, never 1.47 90.00 0.80 1.63 0.13
Pre-tax personal
income Not answered 1.80 87.05 0.72 1.99 0.19
Less than half normal wage (<€17,000 a
year) 1.73 86.09 0.66 2.17 0.23
Between half and normal wage (€17,300–
34,600) 1.75 87.38 0.66 2.14 0.22
Between normal and twice normal wage
(€34,600–69,200) 1.81 86.34 0.64 2.20 0.24 More than twice normal wage (>€69,200) 2.06 82.98 0.63 2.25 0.24
All 1.80 86.30 0.66 2.20 0.23
n= 882 882 882 882 882
In bold and italic: significant differences
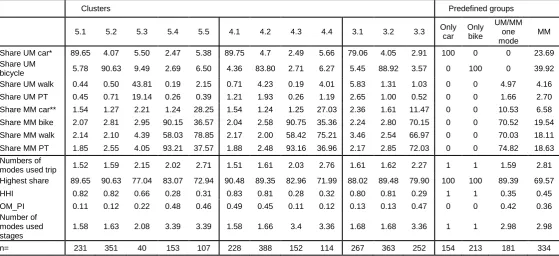
Third, we conducted cluster analyses on the individual mode shares based on the following variables: the share of trips made entirely by car, the share of trips made entirely by bicycle, the share of trips made entirely on foot, the share of trips made entirely by public transport, the share of trips partly made by car (using a car together with another mode in a trip), the share of trips partly made by bicycle, the share of trips partly made on foot, and the share of trips partly made by public transport. We used k-means clustering and explored the results varying the number of clusters (6, 5, 4, 3 and 2 clusters). The optimal number of clusters using the Calinski–Harabasz criterion was three. However, these three clusters could roughly be described as ‘mainly unimodal car’, ‘mostly unimodal bicycle’,
and ‘mostly multimodal’. These clusters do not discriminate well between the level of multimodality
grouping revealed five clusters. Cluster 5.1 mainly consisted of individuals who solely used a car and cluster 5.2 mainly of individuals who only used a bicycle. Cluster 5.3 was a relatively small cluster and consisted of individuals who predominantly walked or used public transport for the entire trip. Cluster 5.4 and 5.5 both consisted of mostly multimodal individuals. The former included individuals who used all kind of modes except a car, whereas the latter contained multimodals who also used a car. We also considered a cluster analyses that revealed four groups. Cluster 4.1 contained mostly car only users and cluster 4.2 mostly bicycle-only users. Cluster 4.3 was very diverse group with many individuals who used a large variety of modes, whereas cluster 4.4 contained individuals who did not use a car, but used a variety of other transport modes. The last cluster analyses revealed three clusters. Cluster 3.1 contained individuals with high shares of trips made using a car alone. Individuals in cluster 3.2 mostly had a high share of trips made using a bicycle alone and cluster 3.3 contained individuals with mostly evinced a mixed modal use.
The clusters and groups that mostly contained only car or only bicycle use (clusters 5.1, 5.2, 4.1, 4.2, 3.1, 3.2, and the groups only car and only bike) had very low scores for the numeric
[image:9.595.21.581.427.683.2]indicators of multimodality. In contrast, the multimodal clusters, and, in particular, clusters 5.5 and 4.4, had very clear multimodal patterns with relatively many modes being used, at both the stage and trip level (Table 2). The clusters and groups differed significantly in composition in several ways (Appendix 2). Men were more likely to be in the car only groups and clusters. Individuals who work also appeared to be more likely to only use a car compared to those not working. A relatively large share of individuals in only-car groups were part of the higher income group and students were less likely to be in this group. The segments that rely heavily on a bicycle contained a higher share of students, lower-income individuals, and those who always have a bicycle available. Individuals in such groups were on average less likely to have a car available, and less likely to be working. Most multimodal clusters/groups were in between the two main unimodal clusters/groups. Individuals in such groups only sometimes had a bicycle and car available more often instead of always or never, and some multimodal groups were less likely to have children at home.
Table 2: Relationship between clusters, predefined groups and modal shares
Clusters
Predefined groups
5.1 5.2 5.3 5.4 5.5 4.1 4.2 4.3 4.4 3.1 3.2 3.3 Only car
Only bike
UM/MM one mode
MM
Share UM car* 89.65 4.07 5.50 2.47 5.38 89.75 4.7 2.49 5.66 79.06 4.05 2.91 100 0 0 23.69 Share UM
bicycle 5.78 90.63 9.49 2.69 6.50 4.36 83.80 2.71 6.27 5.45 88.92 3.57 0 100 0 39.92 Share UM walk 0.44 0.50 43.81 0.19 2.15 0.71 4.23 0.19 4.01 5.83 1.31 1.03 0 0 4.97 4.16
Share UM PT 0.45 0.71 19.14 0.26 0.39 1.21 1.93 0.26 1.19 2.65 1.00 0.52 0 0 1.66 2.70
Share MM car** 1.54 1.27 2.21 1.24 28.25 1.54 1.24 1.25 27.03 2.36 1.61 11.47 0 0 10.53 6.58
Share MM bike 2.07 2.81 2.95 90.15 36.57 2.04 2.58 90.75 35.36 2.24 2.80 70.15 0 0 70.52 19.54
Share MM walk 2.14 2.10 4.39 58.03 78.85 2.17 2.00 58.42 75.21 3.46 2.54 66.97 0 0 70.03 18.11
Share MM PT 1.85 2.55 4.05 93.21 37.57 1.88 2.48 93.16 36.96 2.17 2.85 72.03 0 0 74.82 18.63
Numbers of
modes used trip 1.52 1.59 2.15 2.02 2.71 1.51 1.61 2.03 2.76 1.61 1.62 2.27 1 1 1.59 2.81 Highest share 89.65 90.63 77.04 83.07 72.94 90.48 89.35 82.96 71.99 88.02 89.48 79.90 100 100 89.39 69.57
HHI 0.82 0.82 0.66 0.28 0.31 0.83 0.81 0.28 0.32 0.80 0.81 0.29 1 1 0.35 0.45
OM_PI 0.11 0.12 0.22 0.48 0.46 0.49 0.45 0.11 0.12 0.13 0.13 0.47 0 0 0.42 0.36 Number of
modes used stages
1.58 1.63 2.08 3.39 3.39 1.58 1.66 3.4 3.36 1.68 1.68 3.36 1 1 2.98 2.98
n= 231 351 40 153 107 228 388 152 114 267 363 252 154 213 181 334
*UM=Unimodal. This indicate that an entire trip is made by this mode only. **MM=multimodal. This indicate that trip is made by use of more than one mode.
Cluster 5.2: Mostly only bicycle; Cluster 5.3: Mostly only walk or only public transport; Cluster 5.4: Using a variety of modes, but little car; Cluster 5.5: Using a variety of modes including car.
Cluster 4.2: Mostly only bicycle; Cluster 4.3: Using a variety of modes, but little car; Cluster 4.4: Using a variety of modes including car.
3.5 Analyses
The primary aim of this paper was to test whether the individual level of multimodality is associated with the intention to change one’s mode choice. For this, we estimated several multinomial logistic regression analyses, with ‘no intention to change’ as a reference category. The dependent variables were the intention to change the level of car use, the intention to change the level of bicycle use, the intention to change the frequency of walking, and the intention to change the level of train use. The multivariate analyses were stepwise adjusted by first including the measure of multimodality, second also adding age and gender, and third including all other covariates. Each covariate was tested independently on every outcome variable and only adjusted for if p<0.25 in the unadjusted models.
4. Results
The next sections focus on the key questions of this paper, and will subsequently address whether multimodality predicts the intention to change car use, bicycle use, walking, and train use. The tables only present the estimates of the associations between multimodality and the intention to change in the maximally adjusted models. The reference category in all analyses is ‘no intention to change’, and the clusters and groups are compared to the cluster/group that can be described as (predominantly) car alone. The results of all the multivariate models on the same dependent variable are presented in one table, however, the predefined groups, each indicator and each cluster were modelled separately (i.e. in different multivariate statistical models).
[image:10.595.70.555.656.762.2]4.2.1. Intention to change level or car use
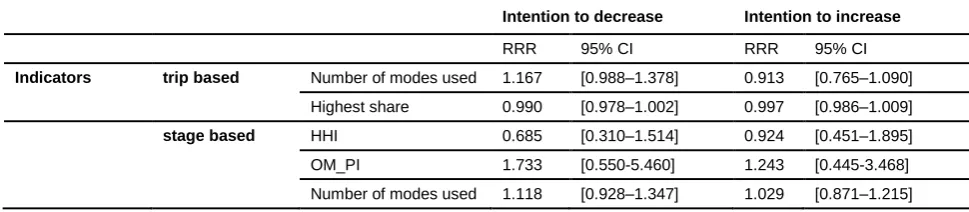
Table 3 shows the results of the maximally adjusted models (i.e. separate models were estimated for each indicator/group/cluster) that estimated the association between different indicators of
multimodality and the intention to change car use. The general trend among all indicators and groups is that the more multimodal individuals were, the more likely they intended to decrease their car use. The groups and multimodality indicators showed a mixture of positive and negative associations (and only non-significant) with the intention to increase car use.
In more detail, all indices showed non-significant associations with intended changes in levels of car use both before and after adjustment. Despite these non-significant results, the direction of the relative risk ratios are intuitive for the intention to decrease. For all four indicators, they showed that there is a tendency among individuals who are more multimodal to be more likely to intend to decrease their level of car use.
Analyses using clusters as the dependent variables revealed that individuals in clusters 5.5 and 4.4—i.e. the very multimodal clusters—showed a greater likelihood of intending to decrease car use. For example, individuals in cluster 5.5 compared to cluster 5.1 (predominantly car users) were 2.5 times more likely to indicate the intention to decrease car use (relative risk ratio (RRR): 2.71; 95% confidence interval (95% CI): 1.22–6.03).
The analyses on pre-defined groups revealed several significant association in the unadjusted models that remained significant in the maximally adjusted models. Compared to individuals who exclusively travelled by car all other three groups were more likely to intend to decrease their car use. For example, individuals belonging to the ‘UMbike’ group were three times more likely (compared to
the ‘only car’ group) to have an intention to decrease car use (RRR: 2.96, 95% CI: 1.13–7.84), and
also the other two groups were approximately three times more likely to intend to decrease car use (RRR: 3.133 and 2.545, respectively).
Table 3: Intention to change the level of car use
Intention to decrease Intention to increase
RRR 95% CI RRR 95% CI
Indicators trip based Number of modes used 1.167 [0.988–1.378] 0.913 [0.765–1.090]
Highest share 0.990 [0.978–1.002] 0.997 [0.986–1.009]
stage based HHI 0.685 [0.310–1.514] 0.924 [0.451–1.895]
OM_PI 1.733 [0.550-5.460] 1.243 [0.445-3.468]
Clusters Cluster 5.2 1.862 [0.882–3.931] 0.971 [0.480–1.963]
(ref: Mostly only car (i.e. cluster 5.1. 4.1, 3.1))
Cluster 5.3 2.070 [0.581–7.370] 0.478 [0.132–1.736]
Cluster 5.4 1.103 [0.455–2.677] 0.800 [0.352–1.817]
Cluster 5.5 2.716* [1.223–6.034] 1.059 [0.477–2.352]
Cluster 4.2 1.544 [0.735–3.241] 0.912 [0.454–1.835]
Cluster 4.3 1.006 [0.415–2.438] 0.761 [0.336–1.722]
Cluster 4.4 2.664* [1.212–5.852] 1.065 [0.481–2.359]
Cluster 3.2 1.354 [0.687–2.671] 1.146 [0.591–2.221]
Cluster 3.3 1.178 [0.597–2.325] 0.991 [0.512–1.917]
Predefined
groups UM bike 2.959* [1.133–7.729] 0.983 [0.433–2.230] (ref: UM car) UM/MM one mode 3.133* [1.253–7.835] 0.701 [0.310–1.583]
MM 2.545* [1.101–5.883] 0.969 [0.480–1.957]
Each measurement of multimodality was separately tested (whilst adjusting for covariates) on the intention to change. Maximally adjusted model for the intention to change the level of car use.
Reference is no intention to change the level of car use.
The analyses are adjusted for: gender, having children living at home, living alone, being a student, working, commute distance, car availability, bicycle availability, education, income, BMI, and age.
RRR=relative risk ratio; 95% CI=95% confidence interval. *=p<0.05
In bold: significant associations
Cluster 5.2: Mostly only bicycle; Cluster 5.3: Mostly only walk or only public transport; Cluster 5.4: Using a variety of modes, but little car; Cluster 5.5: Using a variety of modes including car.
Cluster 4.2: Mostly only bicycle; Cluster 4.3: Using a variety of modes, but little car; Cluster 4.4: Using a variety of modes including car.
Cluster 3.2: Mostly only bicycle; Cluster 3.3: Using a variety of modes.
[image:11.595.73.548.70.240.2]4.2.2. Intention to change levels of bicycle use
Table 4 shows the results of the maximally adjusted multivariate models that tested the association between indicators of multimodality and the intention to change bicycle use. Although many associations between multimodality and the intention to decrease bicycle use were significant in the unadjusted models (including the stage-based indicators, all predefined groups and many clusters), these attenuated and became non-significant in the maximally adjusted models. For an increase in cycling levels, only some clusters were significantly associated in the unadjusted models, but these also attenuated and became non-significant in the maximally adjusted models.
The associations between the continuous indicators of multimodality and the intention to change cycling suggest (although they are non-significant) that individuals who were more
multimodal were less likely to decrease their cycling levels. The strength of the associations was less strong for an increase in cycling, but the results suggest that individuals with higher levels of
multimodality may be more likely to intend to increase cycling. The associations found for the clusters also suggest that compared to individuals who (primarily) only use a car (the control group) other clusters are less inclined to decrease their bicycle use. There is a tendency for individuals who were more multimodal to be more likely to increase cycling. For the predefined groups, the maximally adjusted models suggest that compared to individuals who only use the car (UMcar), the other groups (UMbicycle, UM/MM one mode, MM) are all less likely to intend to decrease their cycling levels.
Table 4: Intention to change the level of bicycle use
Intention to decrease Intention to increase
RRR 95% CI RRR 95% CI
Indicators trip based Number of modes
used 0.742 [0.400–1.376] 1.037 [0.911–1.180] Highest share 0.996 [0.969–1.024] 0.996 [0.987–1.004]
stage based HHI 2.421 [0.449–13.060] 0.675 [0.396–1.151]
OM_PI -1.349 [-3.876-1.177] 0.500 [-0.522-0.206]
Number of modes
[image:11.595.73.549.638.769.2](ref: Mostly only car (i.e. cluster 5.1. 4.1, 3.1))
Cluster 5.3 0.624 [0.052–7.467] 1.161 [0.418–3.226]
Cluster 5.4 0.110 [0.009–1.375] 0.800 [0.441–1.451]
Cluster 5.5 1.173 [0.235–5.860] 1.313 [0.704–2.449]
Cluster 4.2 0.243 [0.044–1.325] 0.689 [0.413–1.151]
Cluster 4.3 0.095 [0.008–1.197] 0.700 [0.384–1.277]
Cluster 4.4 1.006 [0.199–5.076] 1.307 [0.700–2.439]
Cluster 3.2 0.323 [0.071–1.474] 0.793 [0.489–1.285]
Cluster 3.3 0.562 [0.135–2.348] 0.946 [0.575–1.556]
Predefined
groups UM bike 0.390 [0.061–2.483] 0.862 [0.462–1.606] (ref: UM car) UM/MM one mode 0.480 [0.085–2.724] 1.369 [0.732–2.560]
MM 0.507 [0.106–2.434] 1.403 [0.812–2.424]
Each measurement of multimodality was separately tested (whilst adjusting for covariates) on the intention to change. Maximally adjusted model for the intention to change the level of car use.
Reference is no intention to change the level of car use.
The analyses are adjusted for: gender, having children living at home, being a student, working, car availability, bicycle availability, education, income, being Dutch, and age.
RRR=relative risk ratio; 95% CI=95% confidence interval. *=p<0.05
In bold: significant associations
Cluster 5.2: Mostly only bicycle; Cluster 5.3: Mostly only walk or only public transport; Cluster 5.4: Using a variety of modes, but little car; Cluster 5.5: Using a variety of modes including car.
Cluster 4.2: Mostly only bicycle; Cluster 4.3: Using a variety of modes, but little car; Cluster 4.4: Using a variety of modes including car.
Cluster 3.2: Mostly only bicycle; Cluster 3.3: Using a variety of modes.
4.2.3. Intention to change levels of walking
Although all associations of the numerical indicators were non-significant in the maximally adjusted models, these results suggest that individuals with higher levels of multimodality were less likely to have an intention to decrease walking. The associations of the numerical indicators with an intention to increase walking hardly deviated from 1, meaning that the level of multimodality was not
associated with a higher likelihood of intending to increase walking (Table 5).
These analyses revealed that individuals in cluster 5.3 were more likely than individuals in cluster 5.1 (predominantly car alone) to increase their levels of walking in the unadjusted models, and this association remained significant in the maximally adjusted models (RRR: 3.07; 95% CI: 1.14– 8.30). This indicates that individuals in cluster 5.3 (mostly only walking or only using public transport) were three times more likely to have an intention to increase walking.
[image:12.595.71.552.605.767.2]In the predefined groups, no significant associations were found. The results suggest that compared to individuals who only use a car, the other three groups have a higher intention to increase their level of walking and are also less likely to intend to decrease walking, except for the ‘MM one mode’, possibly because this group includes individuals who walk frequently.
Table 5: Intention to change the level of walking
Intention to decrease Intention to increase
RRR 95%CI RRR 95%CI
Indicators trip based Number of modes
used 0.885 [0.619–1.266] 1.001 [0.874–1.148] Highest share 1.008 [0.984–1.031] 1.001 [0.991–1.010]
stage based HHI 3.544 [0.856–14.68] 0.945 [0.525–1.699]
OM_PI 0.186 [0.024-1.471] 0.974 [0.417-2.276]
Number of modes
used 0.836 [0.591–1.184] 0.980 [0.851–1.129] Clusters Cluster 5.2 1.262 [0.384–4.147] 1.102 [0.664–1.831]
(ref: Mostly only car (i.e. cluster 5.1. 4.1, 3.1))
Cluster 5.3 - - 3.069* [1.136–8.297]
Cluster 5.4 0.455 [0.108–1.918] 0.869 [0.487–1.551]
Cluster 4.2 1.001 [0.317–3.161] 1.218 [0.735–2.020]
Cluster 4.3 0.485 [0.118–1.987] 0.855 [0.476–1.535]
Cluster 4.4 0.142 [0.016–1.269] 1.264 [0.697–2.290]
Cluster 3.2 1.472 [0.460–4.708] 0.995 [0.612–1.618]
Cluster 3.3 0.362 [0.105–1.255] 0.886 [0.551–1.427]
Predefined
groups UM bike 1.761 [0.442–7.014] 1.121 [0.596–2.108] (ref: UM car) UM/MM one mode 0.281 [0.048–1.635] 1.461 [0.813–2.627]
MM 1.251 [0.369–4.237] 1.433 [0.823–2.494]
Each measurement of multimodality was separately tested (whilst adjusting for covariates) on the intention to change. Maximally adjusted model for the intention to change the level of car use.
Reference is no intention to change the level of car use.
The analyses are adjusted for: gender, having children living at home, living alone, working, commute distance, bicycle availability, education, income, BMI, and being Dutch.
RRR=relative risk ratio; 95% CI=95% confidence interval. *=p<0.05
In bold: significant associations
Cluster 5.2: Mostly only bicycle; Cluster 5.3: Mostly only walk or only public transport; Cluster 5.4: Using a variety of modes, but little car; Cluster 5.5: Using a variety of modes including car.
Cluster 4.2: Mostly only bicycle; Cluster 4.3: Using a variety of modes, but little car; Cluster 4.4: Using a variety of modes including car.
Cluster 3.2: Mostly only bicycle; Cluster 3.3: Using a variety of modes.
4.2.4. Intention to change levels of train use
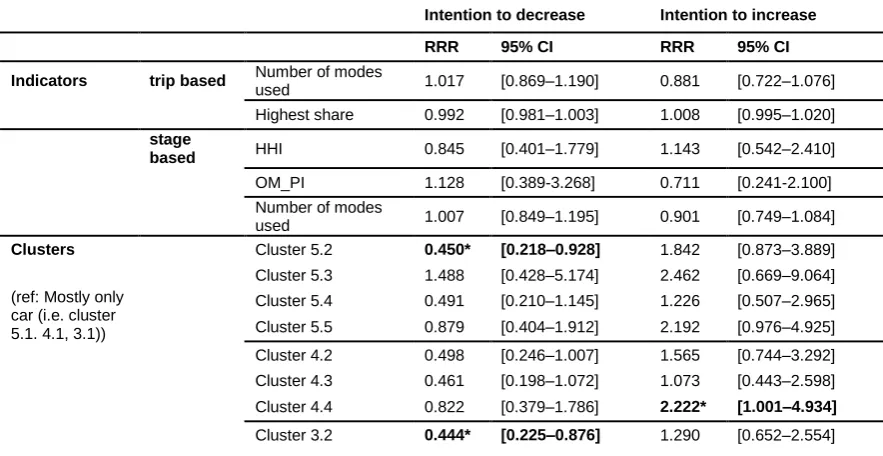
[image:13.595.72.514.535.763.2]Finally, in Table 6, the associations between the multimodality and intention to change levels of train use are presented. None of the numerical multimodal indicators were significantly associated with intentions to change train use, neither in the unadjusted or the adjusted models. In contrast, several clusters showed a lower likelihood to decrease the level of train use. For example, individuals in cluster 5.2 (predominantly bicycle users) compared to cluster 5.1 (predominantly car users) were half as likely to intend to decrease train travel (RRR: 0.45; 95% CI: 0.22–0.93). Similarly, individuals in cluster 3.2 (predominantly bicycle users) compared to cluster 3.1 (predominantly car users) were also half as likely to have this intention (RRR: 0.44; 95% CI: 0.23–0.88). However, individuals in cluster 4.4 (using a variety of modes including car) were found to be more than twice as likely compared to cluster 4.1 (predominantly car) to intend to increase train travel (RRR: 2.22; 95% CI: 1.00–4.93), which is in contrast to the numeric indicators that show a tendency of a lower likelihood to increase train use with higher levels of multimodality.
Table 6: Intention to change the levels of train use
Intention to decrease Intention to increase
RRR 95% CI RRR 95% CI
Indicators trip based Number of modes
used 1.017 [0.869–1.190] 0.881 [0.722–1.076]
Highest share 0.992 [0.981–1.003] 1.008 [0.995–1.020] stage
based HHI 0.845 [0.401–1.779] 1.143 [0.542–2.410] OM_PI 1.128 [0.389-3.268] 0.711 [0.241-2.100]
Number of modes
used 1.007 [0.849–1.195] 0.901 [0.749–1.084] Clusters Cluster 5.2 0.450* [0.218–0.928] 1.842 [0.873–3.889]
(ref: Mostly only car (i.e. cluster 5.1. 4.1, 3.1))
Cluster 5.3 1.488 [0.428–5.174] 2.462 [0.669–9.064]
Cluster 5.4 0.491 [0.210–1.145] 1.226 [0.507–2.965]
Cluster 5.5 0.879 [0.404–1.912] 2.192 [0.976–4.925]
Cluster 4.2 0.498 [0.246–1.007] 1.565 [0.744–3.292]
Cluster 4.3 0.461 [0.198–1.072] 1.073 [0.443–2.598]
Cluster 4.4 0.822 [0.379–1.786] 2.222* [1.001–4.934]
Cluster 3.3 0.522 [0.268–1.018] 1.264 [0.635–2.515]
Predefined
groups UM bike 0.603 [0.256–1.422] 1.903 [0.789–4.590] (ref: UM car) UM/MM one mode 0.960 [0.428–2.152] 2.162 [0.914–5.112]
MM 1.178 [0.597–2.324] 1.297 [0.582–2.891]
Each measurement of multimodality was separately tested (whilst adjusting for covariates) on the intention to change. Maximally adjusted model for the intention to change the level of car use.
Reference is no intention to change the level of car use.
The analyses are adjusted for: gender, having children living at home, living alone, being a student, working, commute distance, car availability, bicycle availability, education, income, BMI, being Dutch, and age.
RRR=relative risk ratio; 95% CI=95% confidence interval. *=p<0.05
In bold: significant associations
Cluster 5.2: Mostly only bicycle; Cluster 5.3: Mostly only walk or only public transport; Cluster 5.4: Using a variety of modes, but little car; Cluster 5.5: Using a variety of modes including car.
Cluster 4.2: Mostly only bicycle; Cluster 4.3: Using a variety of modes, but little car; Cluster 4.4: Using a variety of modes including car.
Cluster 3.2: Mostly only bicycle; Cluster 3.3: Using a variety of modes.
5. Discussion
This paper explored to what extent multimodality was associated with the intention to change travel behaviour. Although existing research suggests that baseline multimodality may predict changes in travel behaviour, alternative explanations are possible, such as mathematical coupling, regression to the mean, and the measured change actually being variability. To overcome these issues, this paper investigated the influence of multimodality on an important precedent of behavioural change: the intention to change behaviour. Specifically, this paper explored to what extent multimodality was associated with the intention to change the level of cycling, walking, car use, and public transport use.
Our findings showed that the more multimodal individuals were, the more likely they intended to decrease their car use. The analyses on the pre-defined groups revealed that compared to individuals who exclusively travelled by car all other three groups were more likely to intend to decrease their car use. Similarly, compared to the clusters with heavy car users, members of other groups were less likely to intend to decrease their bicycle and train use (but these findings were mostly non-significant). This may imply that individuals who only travel by another mode, or alternate their commute mode choice, may be more inclined to reduce their car use even further. In addition, this may indicate that individuals who rely (mainly) on a car for transport are more likely to intend to decrease other modes of transport, resulting in an even greater car dependency. These findings also support the idea that multimodality may increase the likelihood of changing behaviour towards more healthy and sustainable alternatives.
Our analyses did not provide conclusive evidence that the level of multimodality is associated with the intention to change. Most adjusted models, except the models on the intention to change car use, revealed non-significant associations. However, in many models, the directions of the
associations were clear as well as intuitive and the non-significance may have been a result of (unexpected) insufficient statistical power (see also below). Based on the current analyses, we are therefore unable to conclusively corroborate or disapprove the suggested conceptualisation that multimodals are more open to change (Heinen and Ogilvie 2016; Kroesen 2015). This is important when designing interventions: if those individuals with higher levels of variability were more inclined to change when confronted with an intervention, this would offer opportunities for two-staged
interventions.
The existing literature on multimodality has not been conclusive as to which measure is most appropriate to use. We therefore used three measures of multimodality: indices, predefined groups, and data-driven groups obtained by factor analyses. The selection for a particular index or grouping strategy was important in this study, illustrated by the difference in strength of the revealed
associations. However, all these measures have limitations. For example, the indices are likely to best represent the level of multimodality. However, they can be easily affected by certain characteristics in the data resulting in peaks (see also Susilo and Axhausen 2015; Heinen and Chatterjee 2015; Diana and Pirra 2016) and consequently affect the results. The interpretation of the clusters and groups may have other difficulties. The clusters potentially include individuals with a large variety in their modal mix. This large variety in such clusters may consequently result in large varieties in intentions. This may explain the sometimes less clear direction of effects in the analyses. The predefined groups face other shortcomings as this measure of multimodality is most closely related to the use of certain modes. As a result, the groups correspond most closely to mode choice and may therefore link to discussions around habit and mode choice (e.g. Verplanken et al. 1998; Aarts et al. 1998). As a result, analyses with predefined groups may just report on whether the use of a current mode increases or decreases the intention for future use. Thus, we recommend conducting analyses with multiple measures, similar to the approach used in this paper. Nevertheless, all measures are intended to measure something slightly different, and if one is interested in the level of multimodality, it may be best to use an index, although the results should be checked with predefined groups and/or clusters.
This paper investigated the intention to change travel behaviour rather than actual change. Actual behavioral change may be a result of various factors, including intention to change. However, research has revealed that changes in the built environment and life events may also have an effect on travel behaviour and thereby result in behavioural changes (Clark et al., 2014; Heinen et al., 2015; Panter et al., 2016; Scheiner et al., 2016). The observation of Scheiner et al. (2016) that life events may result in changes in level of multimodality is also important in this context. Given that life events may change travel behaviour, they are likely to also impact on levels multimodality, which is
measured by the use of modes and their intensity of use. From a policy perspective, behavioural change could be caused by life events, which may simultaneously increase the level multimodality. This increase in multimodality may then possibly increase the likelihood of changing travel
behaviour, as suggested by Heinen and Ogilvie (2016) and Kroesen (2016). However, this increase may not result due to changes in intention to change.
Discriminating between behavioural change and variability is difficult. If we only have two
measurements without any intervention, we cannot (easily) discriminate, unless we know the ‘natural’
level of variability, i.e. the prevalence and extent of variation in mode choice. The focus of this paper on intention to change instead of actual change partly removes this problem. However, it introduces another issue, as an intention does not necessarily result in consequent behaviour. Experimental studies may offer alternative possibilities, as they intend to effectuate a change in behaviour, and a measured change can be conceptually be attributed to the intervention. Monitoring levels of multimodality/variability in the population will also contribute to a better understanding of the potential size of its effect.
This paper is the first to explore an essential step towards the determination of a causal relationship between multimodality and travel behaviour change by investigating whether
may be willing to provide socially desirable answers, although the format of a survey (and consequent anonymity of the respondent), make this less likely than in more personal types of data collection such as interviews. Another shortcoming is that individuals who do not use a certain mode are unable to reduce the use of this mode, and therefore are very unlikely to intend to do so. We measured
multimodality based on commuting behaviour, whilst we measure the intention to change in general. This allows one to intend to reduce use of a mode, even if not used, although this is limited by the fact that the level of multimodality is only based on commuting trips.
Additional research will be necessary to test the proposed link between multimodality and behavioural change. Three lines of research are particularly important in this vein. First, additional research is necessary to corroborate or disprove the connection between multimodality and
behavioural change. Second, similar to this study, research will be necessary to show not only associations between multimodality and changes in mode choice, but also antecedents of such changes in choices, such as intention to change. Finally, another line of research that may be pursued is to test the stability of multimodality over time. Knowing how stable/variable an individual’s behaviour is would help us to understand the extent of individual variability and thereby better distinguish natural travel behaviour variability when measuring travel behaviour change.
Experimental studies would contribute to this understanding further, as they aim for a direction in effect, and consequently measured change in that direction could, to some extent, be more firmly attributed to an intervention. In addition to investigating the link between multimodality and behaviour change further, it would also be noteworthy to investigate how levels of car use can be decreased for multimodal individuals. To this end, it would be interesting to determine whether the level of multimodality differs by trip purpose, and in which cases multimodal use employs the car.
6. Conclusion
This paper explored to what extent multimodality was associated with the intention to change travel behaviour. Our findings showed that the more multimodal individuals were, the more likely they intended to decrease their car use.However, the associations between multimodality and the intention to change other modes of transport were non-significant. This may imply that there is no relationship between multimodality and the intention to change. However, the significant findings for car use, and the direction of most (non-significant) associations in our analyses were intuitive. Therefore, although this paper has not been able to provide support for the previously reported findings that multimodality may correspond with higher levels of behavioural change in mode choice, it does not disconfirm it either. Additional research will still be necessary to explore this putative relationship.
Acknowledgement
EH was funded by The Netherlands Organisation for Scientific Research, VENI-Grant (016.145.073). Thanks are due to the anonymous reviewers appointed by this journal, whose comments greatly improved the paper.
References
Aarts H., B. Verplanken & A. Knippenberg (1998) Predicting behavior from actions in the past: Repeated decision making or a matter of habit? Journal of Applied Social Psychology 28 (15), 1355-1374.
Ajzen I. (1991). The theory of planned behavior. Organizational Behavior and Human Decision Processes, 50, 179–211.
Buehler R. and Hamre, A. (2015) The multimodal majority? Driving, walking, cycling, and public transportation use among American adults. Transportation, 42, 1081-1101.
Clark, B., Chatterjee, K., Melia, S., Knies, G. and Laurie, H. (2014) Life events and travel behaviour: Exploring the interrelationship using UK household longitudinal study data. Transportation Research Record, 2413. pp. 54-64.
Diana M. & Pirra M. (2016): A comparative assessment of synthetic indices to measure multimodality behaviours. Transportmetrica A: Transport Science, 12 (9), 771-793.
EC (2014) Do the right mix. European Commission’s Sustainable Urban Mobility Campaign.
European Commission Directorate-General for Mobility and Transport. <http://www.dotherightmix.eu/campaign/do-the-right-mix>
Fishbein M. & Ajzen I. (2010). Predicting and changing behavior: The reasoned actionapproach. New York, NY: Psychology Press.
Heinen E. (2016) Identity and travel behavior: A cross-sectional study on commute mode choice and intention to change, Transportation Research Part F: Traffic Psychology and Behaviour, 43, 238– 253.
Heinen, E. & Chatterjee K. (2015) The same mode again? An exploration of mode choice variability in Great Britain using the National Travel Survey. Transportation Research Part A, 78, 266-282. Heinen E; Panter J; Mackett R; Ogilvie D (2015) Changes in mode of travel to work: a natural
experimental study of new transport infrastructure, International Journal of Behavioral Nutrition and Physical Activity, 12.
Heinen E. and Ogilvie D. (2016) Variability in baseline travel behaviour as a predictor of changes in commuting by active travel, car and public transport: a natural experimental study. Journal of Transport and Health 3(1), 77-85.
Heinen E; Mattioli G (2017) Does a high level of multimodality mean less car use? An exploration of multimodality trends in England, Transportation, pp.1-34.Huff J.O. and Hanson S. (1986) Repetition and variability in urban travel. Geographical Analysis, 18, 97-114.
Gilthorpe M.S. (2011) Chapter 4. Mathematical Coupling and Regression to the Mean in the Relation between Change and Initial Value. In: Statistical Thinking in Epidemiology. Chapman and Hall/CRC 2011. Print ISBN: 978-1-4200-9991-1. eBook ISBN: 978-1-4200-9992-8. https://0-doi-org.wam.leeds.ac.uk/10.1201/b11045
Jones P., Clarke M. (1988) The significance and measurement of variability in travel behavior. Transportation, 15 (1-2), pp. 65-87.
Kroesen M. (2014) Modeling the behavioral determinants of travel behavior: An application of latent transition analysis. Transportation Research Part A, 65, 56–67.
Kuhnimhof K. (2009) Measuring and modeling multimodal mode use in the longitudinal section. Paper Presented at the Meeting of the Transportation Research Board 88th Annual Meeting, Washington, D.C., USA.
Molin E., Mokhtarian P. and Kroesen M. (2016) Multimodal travel groups and attitudes: A latent class cluster analysis of Dutch Travelers. Transportation Research Part A, 83, 14-29.
Panter J; Heinen E; Mackett R; Ogilvie D (2016) Impact of New Transport Infrastructure on Walking, Cycling, and Physical Activity., American Journal of Preventive Medicine, 50, pp.e45-e53. Nobis C. (2007) Multimodality – facets and causes of sustainable mobility behavior. Transportation
Research Record, 2010, 35–44.
Prochaska J.O., DiClemente C.C., & Norcross J.C. (1992). In search of how people
change: Applications to the addictive behaviors. American Psychologist, 47, 1102-1114. PMID: 1329589.
Prochaska J.O. & Velicer W.F. (1997). Misinterpretations and misapplications of the transtheoretical model.
Rhoades S.A. (1993) The Herfindahl-Hirschman index. Federal Reserve Bull., 79, 188-189.
Scheiner J., Chatterjee K. & Heinen E. (2016) Key events and multimodality: A life course approach. Transportation Research Part A: Policy and Practice, 91, 148-165.
Susilo Y.O. & Axhausen K.W. (2014) Repetitions in individual daily activity-travel-location patterns: a study using the Herfindahl-Hirschman Index. Transportation, 41, 995-1011.
Appendix 1: Overview of data
n % Mean St.dev
Intention to change car use Decrease 180 20.4
No change 452 52.3
Increase 250 28.3
Intention to change bicycle use Decrease 35 4.0
No change 391 44.3
Increase 456 51.7
Intention to change levels of walking Decrease 43 4.9
No change 470 53.3
Increase 369 41.8
Intention to change levels of train use Decrease 191 21.7
No change 494 56.0
Increase 197 22.3
Trip-based indicators
Number of modes used 882 1.8 1.3
Highest share 882 86.3 19
Stage-based indicators
HHI 882 0.66 0.33
OM_PI 882 0.23 0.23
Number of modes used 882 2.20 1.30
Predefined groups
UM car 154 17.5
UM bike 213 24.2
UM/MM one mode 169 19.2
MM 346 39.2
Clusters
Cluster 5 5.1: Mostly only car 231 26.2
5.2: Mostly only bicycle 351 39.8 5.3: Mostly only walk or only public transport 40 4.5 5.4: Using a variety of modes, but little car 153 17.4 5.5: Using a variety of modes including car 107 12.1
Cluster 4 4.1: Mostly only car 228 25.9
4.2: Mostly only bicycle 388 44.0 4.3: Using a variety of modes, but little car 152 17.2 4.4: Using a variety of modes including car 114 12.9
Cluster 3 3.1: Mostly only car 267 30.3
3.2: Mostly only bicycle 363 41.2 3.3: Using a variety of modes 252 28.6 Socio-economic characteristics
Age 871 41.1 13.3
Sex Male 310 35.3
Female 569 64.7
Dutch nationality Yes 803 92.7
No 63 7.3
Received higher education Yes 530 84.5
No 97 15.5
Children at home Yes 199 22.6
No 683 77.4
Living alone Yes 319 36.2
No 563 63.8
Student Yes 89 10.1
No 793 89.9
Working Yes 734 83.2
No 148 16.8
Holding a driver license Yes 770 88.1
No 104 11.9
Car availability Yes, always 419 47.7
Yes, mostly 112 12.8
Yes, sometimes 155 17.7
No, never 192 21.9
Bicycle availability Yes, always 841 95.7
Yes, mostly 13 1.5
Yes, sometimes 6 0.7
No, never 19 2.2
Pre-tax personal income Not answered 110 12.7
Less than half normal wage (<€17,000 a year) 134 15.4
Between half and normal wage (€17,300–34,600) 223 25.7 Between normal and twice normal wage (€34,600–
69,200) 330 38.0
Appendix 2: Cluster and group membership
5.1 5.2 5.3 5.4 5.5 4.1 4.2 4.3 4.4 3.1 3.2 3.3 Predefined groups
Mostly
UMcar
Mostly UMbike
Mostly UMother
MM-
exclcar MMall
Mostly UMcar
Mostly UMbike
MM-exclcar MMall
Mostly UMcar
Mostly UMbike MM
Only car
Only bike
UM/M M one mode
Uses combi nation
Age 42.8 41.0 46.3 38.0 40.6 42.7 41.5 37.9 41.1 43.7 40.7 39 42.2 41.3 40.0 41.2 Sex Male 42.9% 32.1% 35.0% 30.3% 36.4% 43.0% 32.4% 29.8% 36.8% 41.6% 31.9% 33.5% 46.8% 30.3% 36.7% 32.3%
Female 57.1% 67.9% 65.0% 69.7% 63.6% 57.0% 67.6% 70.2% 63.2% 58.4% 68.1% 66.5% 53.3% 69.7% 63.3% 67.7% Dutch
nationality No 7.9% 7.0% 5.3% 6.6% 8.5% 7.6% 7.1% 6.6% 8.0% 7.7% 6.8% 7.6% 6.6% 9.6% 8.4% 5.5%
Yes 92.1% 93.0% 94.7% 93.4% 91.5% 92.4% 92.9% 93.4% 92.0% 92.3% 93.2% 92.4% 93.4% 90.4% 91.6% 94.5% Children at
home No 70.6% 78.1% 90.0% 77.8% 85.0% 69.7% 79.4% 77.6% 86.0% 72.7% 78.2% 81.3% 70.6% 78.1% 90.0% 77.8% Yes 29.4% 21.9% 10.0% 22.2% 15.0% 30.3% 20.6% 22.4% 14.0% 27.3% 21.8% 18.7% 29.4% 21.9% 10.0% 22.2% Living alone No 63.6% 65.5% 40.0% 64.1% 67.3% 64.0% 63.4% 63.8% 64.9% 60.7% 65.0% 65.5% 63.0% 65.3% 60.8% 65.0% Yes 36.4% 34.5% 60.0% 35.9% 32.7% 36.0% 36.6% 36.2% 35.1% 39.3% 35.0% 34.5% 37.0% 34.7% 39.2% 35.0% Student No 97.0% 85.5% 87.5% 90.8% 88.8% 96.9% 85.8% 90.8% 88.6% 97.4% 84.8% 89.3% 97.4% 83.1% 91.2% 90.1% Yes 3.0% 14.5% 12.5% 9.2% 11.2% 3.1% 14.2% 9.2% 11.4% 2.6% 15.2% 10.7% 2.6% 16.9% 8.8% 9.9% Working No 9.1% 21.4% 42.5% 11.1% 16.8% 9.2% 22.9% 11.2% 18.4% 12.4% 22.3% 13.5% 8.4% 23.5% 12.7% 18.6%
Yes 90.9% 78.6% 57.5% 88.9% 83.2% 90.8% 77.1% 88.8% 81.6% 87.6% 77.7% 86.5% 91.6% 76.5% 87.3% 81.4% Holding a
driver license Yes 99.6% 82.7% 82.5% 84.9% 87.9% 99.6% 82.8% 84.8% 87.7% 97.4% 82.7% 86.1% 99.3% 78.2% 83.4% 91.8% No 0.4% 17.3% 17.5% 15.1% 12.1% 0.4% 17.2% 15.2% 12.3% 2.6% 17.3% 13.9% 0.7% 21.8% 16.6% 8.2% Car
availability Yes, always 89.5% 33.2% 37.5% 20.9% 47.7% 89.4% 33.7% 21.1% 48.2% 84.9% 32.7% 30.2% 92.2% 27.8% 26.5% 51.5% Yes, mostly 8.3% 16.6% 5.0% 9.8% 16.8% 8.0% 15.8% 9.9% 15.8% 7.2% 16.9% 12.7% 6.5% 14.6% 9.4% 16.3% Yes,
sometimes 1.7% 19.2% 17.5% 35.3% 21.5% 2.2% 18.9% 34.9% 21.1% 3.8% 18.8% 30.6% 0.7% 21.2% 32.6% 15.1% No, never 0.4% 30.9% 40.0% 34.0% 14.0% 0.4% 31.6% 34.2% 14.9% 4.2% 31.6% 26.6% 0.7% 36.3% 31.5% 17.2% Bicycle
availability Yes, always 92.6% 98.9% 89.7% 97.4% 91.6% 91.6% 98.4% 98.0% 91.2% 92.0% 98.9% 94.8% 91.4% 99.1% 93.4% 96.7% Yes, mostly 1.3% 0.9% 2.6% 2.0% 2.8% 1.8% 0.8% 2.0% 2.6% 1.5% 0.8% 2.4% 1.3% 0.5% 2.8% 1.5% Yes,
sometimes 1.3% 0.0% 0.0% 0.0% 2.8% 1.3% 0.0% 0.0% 2.6% 1.1% 0.0% 1.2% 1.3% 0.0% 1.1% 0.6% No, never 4.8% 0.3% 7.7% 0.7% 2.8% 5.3% 0.8% 0.0% 3.5% 5.3% 0.3% 1.6% 5.9% 0.5% 2.8% 1.2% Pre-tax
personal
income Not answered 10.1% 15.1% 17.9% 7.8% 15.2% 11.2% 14.2% 7.9% 17.0% 11.9% 14.6% 10.8% 11.3% 18.1% 9.4% 11.6% Less than half
Between half and normal
wage 21.6% 25.5% 35.9% 30.1% 24.8% 21.0% 27.0% 30.3% 24.1% 23.8% 25.5% 27.9% 24.5% 26.7% 30.6% 22.9% Between
normal and twice normal
wage 48.5% 32.8% 15.4% 38.6% 40.0% 47.8% 32.0% 38.2% 38.4% 44.4% 32.5% 39.0% 47.0% 29.0% 40.0% 38.4% More than
twice normal
wage 13.2% 6.1% 2.6% 7.2% 8.6% 13.4% 5.8% 7.2% 8.0% 11.9% 5.9% 8.0% 12.6% 3.3% 6.1% 10.7%
5.1 5.2 5.3 5.4 5.5 4.1 4.2 4.3 4.4 3.1 3.2 3.3 1 2 3 4
Intention to change car use
Decrease 13.9% 22.2% 32.5% 20.9% 23.4% 14.0% 22.4% 21.1% 25.4% 17.2% 22.0% 21.4% 11.0% 20.2% 26.5% 21.6% No change 63.6% 46.7% 42.5% 47.7% 47.7% 63.2% 46.9% 48.0% 46.5% 60.7% 46.6% 48.0% 61.7% 49.3% 45.9% 50.6% Increase 22.5% 31.1% 25.0% 31.4% 29.0% 22.8% 30.7% 30.9% 28.1% 22.1% 31.4% 30.6% 27.3% 30.5% 27.6% 27.8%
Intention to change bicycle use
Decrease 8.2% 1.4% 10.0% 0.7% 5.6% 8.8% 2.1% 0.7% 5.3% 8.6% 1.4% 2.8% 10.4% 1.9% 2.8% 3.0% No change 41.1% 48.7% 35.0% 50.3% 31.8% 40.4% 48.2% 50.7% 30.7% 39.3% 48.5% 43.7% 43.5% 53.5% 42.0% 40.1% Increase 50.6% 49.9% 55.0% 49.0% 62.6% 50.9% 49.7% 48.7% 64.0% 52.1% 50.1% 53.6% 46.1% 44.6% 55.2% 56.9%
Intention to change levels of walking
Decrease 8.2% 4.6% 2.5% 3.9% 0.9% 8.8% 4.1% 3.9% 0.9% 7.5% 4.4% 2.8% 9.1% 4.7% 2.2% 4.5% No change 55.0% 53.0% 35.0% 58.8% 49.5% 54.8% 51.8% 59.2% 47.4% 51.7% 52.9% 55.6% 56.5% 55.9% 52.5% 50.6% Increase 36.8% 42.5% 62.5% 37.3% 49.5% 36.4% 44.1% 36.8% 51.8% 40.8% 42.7% 41.7% 34.4% 39.4% 45.3% 44.9%
Intention to change levels of train use
Decrease 29.9% 17.4% 30.0% 15.0% 24.3% 22.8% 30.3% 15.1% 18.8% 29.6% 18.5% 17.9% 28.8% 15.5% 18.2% 24.3% No change 58.0% 58.1% 32.5% 60.8% 46.7% 46.5% 56.6% 61.2% 56.4% 53.6% 57.6% 56.4% 58.4% 57.8% 53.6% 55.1%
Increase 12.1% 24.5% 37.5% 24.2% 29.0% 30.7% 13.2% 23.7% 24.7% 16.9% 24.0% 25.8% 13.0% 26.8% 28.2% 20.7%