Department for Education
Retaining and developing
the teaching workforce
Report by the Comptroller and Auditor General Ordered by the House of Commons
to be printed on 11 September 2017
This report has been prepared under Section 6 of the National Audit Act 1983 for presentation to the House of Commons in accordance with Section 9 of the Act
Sir Amyas Morse KCB
Comptroller and Auditor General National Audit Office
7 September 2017
HC 307 | £10.00
© National Audit Office 2017
The material featured in this document is subject to National Audit Office (NAO) copyright. The material may be copied or reproduced for non-commercial purposes only, namely reproduction for research, private study or for limited internal circulation within an organisation for the purpose of review.
Copying for non-commercial purposes is subject to the material being accompanied by a sufficient acknowledgement, reproduced accurately, and not being used in a misleading context. To reproduce NAO copyright material for any other use, you must contact [email protected]. Please tell us who you are, the organisation you represent (if any) and how and why you wish to use our material. Please include your full contact details: name, address, telephone number and email.
Please note that the material featured in this document may not be reproduced for commercial gain without the NAO’s express and direct permission and that the NAO reserves its right to pursue copyright infringement proceedings against individuals or companies who reproduce material for commercial gain without our permission.
The National Audit Office study team consisted of:
Charlie Acton, Bhavina Bharkhada, Martin Chong, Mark Parrett and Zaina Steityeh, with assistance from Jonathan Davies, Charmaine Lartey, Katie Taylor and Ashleigh Thorius, under the direction of Laura Brackwell. This report can be found on the National Audit Office website at www.nao.org.uk
For further information about the National Audit Office please contact: National Audit Office
Press Office
157–197 Buckingham Palace Road Victoria
London SW1W 9SP
Tel: 020 7798 7400
Enquiries: www.nao.org.uk/contact-us
Website: www.nao.org.uk Twitter: @NAOorguk Department’s approach 13
Part Two
Retention, recruitment of former teachers and deployment 24
Part Three
Teacher quality 39 Appendix One
Our audit approach 49 Appendix Two
Key facts
457,300
teachers in state-funded schools in England in November 2016
£21bn
spent annually by state-funded schools on teaching staff
£35.7m
our estimate of the Department for Education’s spending on programmes to retain and develop the teaching workforce in 2016-17
26,000 increase in the number of primary and nursery school teachers between November 2010 and November 2016 (13.2% increase)
10,800 fall in the number of secondary school teachers between November 2010 and November 2016 (4.9% decrease)
14,200 number of qualifi ed teachers returning to state-funded schools in 2016 (representing around a third of total qualifi ed entrants)
34,910 number of qualifi ed teachers leaving for reasons other than retirement in 2016
85% of secondary school leaders surveyed considered that they did
not receive suffi cient support from the Department for Education to retain high-quality teachers
52% of secondary school vacancies in 2015/16 were fi lled by teachers
with the experience and expertise required, according to our survey of school leaders
82% of secondary school pupils in 2016 were in schools where
Ofsted rated the quality of teaching, learning and assessment as outstanding or good
97% of school leaders surveyed considered that cost was a barrier
to improving the quality of their teaching workforce
Teacher numbers are reported as full-time equivalents.
Summary
1 At November 2016 some 457,300 teachers worked in the state-funded sector in England, mainly in primary and secondary schools (Figure 1 overleaf). The teaching workforce had grown slightly since November 2015, with 1,000 more qualified teachers joining than leaving during the year.
2 There are approximately 21,900 state-funded schools in England, which
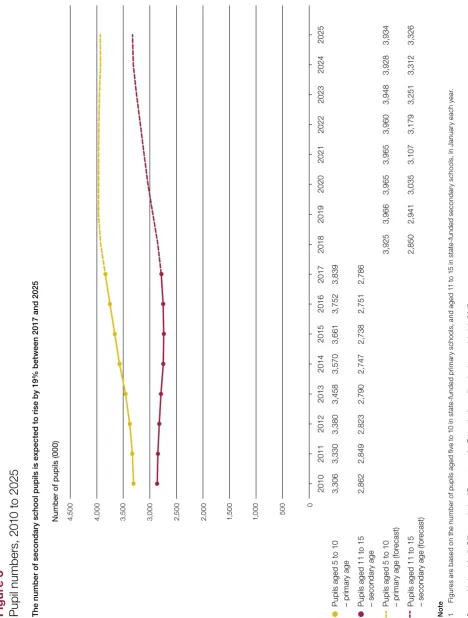
educate 8.1 million pupils aged up to 19. The school-age population has been growing, increasing the need for teachers. The number of pupils of primary and nursery age in state-funded schools increased by 598,000 (14.6%) between January 2011 and January 2017. This larger number of pupils is now moving from primary to secondary education. After a reduction between 2011 and 2015, the number of pupils of secondary school age has since begun to increase and is forecast to rise by 540,000 (19.4%) between 2017 and 2025.
3 The Department for Education (the Department) is accountable for securing value for money from spending on education services. It distributes funding to schools using formulae set by local authorities. Schools spend around £21 billion a year on teaching staff, more than half of their total spending. As employers, schools play a crucial role in retaining and developing teachers. Local authorities are responsible for supporting maintained schools, and multi-academy trusts play a similar role in the academies sector.
4 Schools are managing their teaching workforce within an increasingly challenging context. Although the overall schools budget was protected in real terms following the 2015 Spending Review, average funding per pupil was not due to increase in line with inflation. To deal with this, and meet cost pressures outside their control, the Department expected schools to make significant efficiency savings, including £1.7 billion a year by 2019-20 by using staff more efficiently. In July 2017 the Department announced additional funding of £1.3 billion for the core schools budget over two years, 2018-19 and 2019-20. It has not yet revised its estimates of the savings that schools will need to make.
Fi
g
ure
1
Fl
ow
s i
nt
o a
nd o
ut o
f t
he s
ta
te
-f
un
de
d t
ea
ch
in
g w
or
kf
or
ce i
n 2
01
6
N o te s 1 Fu ll- a nd p ar t-tim e t ea ch er s a re s ho w n a s h ea d co un t, w ith a ll o th er fi g ur es s ho w n a s f ul l-t im e e q ui va le nt s. 2 E nt ra nt s a nd l ea ve rs a re q ua lifi e d t ea ch er s o nl y f or t he y ea r N ov em b er 2 01 5 t o N ov em b er 2 01 6, a ls o e xp re ss ed as a p
Focus of our report
6 The Department considers that the quality of teaching is more important to pupil outcomes than anything else a school can control. Having enough high-quality teachers is essential to the effective operation of the school system.
7 We reported in 2016 on whether the Department was achieving value for money through its arrangements to train new teachers.1 We concluded that the Department
had missed its recruitment targets for new trainee teachers for the past four years and that there were signs that teacher shortages were growing.
8 This report focuses on the Department’s arrangements to develop and retain the existing teaching workforce. These arrangements would be working optimally if there were enough teachers of the right quality in the right places, and if this was being achieved in a cost-effective way. For example, it is likely to be more effective and cheaper for the taxpayer to encourage existing teachers to stay in the profession, provided they are performing well, than it would be to train new teachers.
9 This report examines whether the Department is effectively supporting the schools sector to retain and develop the teaching workforce. We assessed:
•
the teaching workforce and the Department’s approach (Part One);•
retention, recruitment of former teachers and deployment (Part Two); and•
teacher quality (Part Three).10 We set out our audit approach in Appendix One and our evidence base in Appendix Two.
Key findings
The teaching workforce and the Department’s approach
11 The teaching workforce has grown in recent years, but secondary schools face significant challenges to keep pace with rising pupil numbers. Overall, the number of full-time equivalent teachers in state-funded schools increased by 15,500 (3.5%) between 2010 and 2016. However, this masks a reduction in the number of teachers in secondary schools, which fell by 10,800 (4.9%) between 2010 and 2016. In all regions of England, a larger proportion of secondary than primary schools reported at least one teacher vacancy during the same period. Primary pupil–teacher ratios remained fairly constant at around 20.5:1 between 2011 and 2015 with a slight increase to 20.6:1 in 2016, despite the rise in the number of pupils. Secondary pupil–teacher ratios rose from 14.9:1 in 2011 to 15.6:1 in 2016. The Department’s default scenario from the teacher supply model assumes that these ratios will continue to rise. This may mean larger classes or more contact time for teachers in secondary schools (paragraphs 1.2 to 1.4 and 2.24).
12 The Department has not set out in a coherent way and shared with schools and the teaching profession how they can work together to improve the teaching workforce. Since its 2016 white paper, the Department has been developing its approach to focus on improving social mobility, helping schools to build capacity and supporting teaching as a profession. It is providing funding of up to £5 million over four years to help establish the Chartered College of Teaching as an independent professional body for teachers. The Department expects schools to take the lead in developing and retaining their teachers. However, it has not brought together and communicated its aims and initiatives in a coherent way that is integrated with its financial health and efficiency programme. To help make the necessary efficiency savings, schools may increase teachers’ contact time and require senior staff to do more teaching. These steps risk increasing teachers’ workload with implications for recruitment and retention (paragraphs 1.6 to 1.13).
14 The Department has limited evidence that its initiatives to retain and develop the teaching workforce are making a difference. The Department found in 2015 that its longest-established programme – teaching schools, which lead alliances of schools offering training and support to each other – was having positive effects, particularly in improving collaboration between schools. However, its evaluation also found that teaching schools had not had a measurable impact on pupil outcomes. In general, the Department has not set out clearly the improvement in outcomes it expects from its initiatives, which it could use to help evaluate impact. The impact of the Department’s initiatives depends on schools and teachers engaging with them. Our survey of school leaders found that levels of awareness and engagement varied widely across the different programmes (paragraphs 2.13 and 3.15 to 3.18).
Retention, recruitment of returning teachers and deployment
15 Teachers are increasingly leaving state-funded schools before they reach retirement. The number of qualified teachers leaving state-funded schools increased by 0.6 percentage points from 9.3% of the qualified workforce in 2011 (39,370 full-time equivalent teachers) to 9.9% of the qualified workforce in 2016 (42,830). This was lower than the Department’s forecast of 47,360 leavers in 2015/16. The number of qualified teachers retiring fell by 1.5 percentage points between 2011 and 2016, but the number leaving for other reasons increased by 2.1 percentage points over the same period. This meant that 34,910 full-time equivalent teachers left before retirement in 2016. The National Foundation for Educational Research reported in November 2015 that just over half of teachers who leave remain within the schools sector. The Department has undertaken a survey to collect information on why teachers have left and expects the results to be available in autumn 2017 (paragraphs 2.3 to 2.7).
16 Workload is a significant barrier to teacher retention. Our survey of school leaders found that workload is the most important factor in retaining teachers: 67% of respondents reported that workload is a barrier to retention. To help tackle teachers’ workload, in March 2016 the Department published reports from three independent groups on marking practices, lesson planning and use of resources, and data management. Our survey found that 81% of school leaders are aware of this guidance but only 44% are engaged with it. The Department has also committed to carry out a survey every two years to track teachers’ workload. The baseline survey, published in February 2017, found that classroom teachers and middle leaders worked 54.4 hours on average, during the reference week in March 2016, including the
17 Schools are finding it increasingly difficult to fill posts with the quality of teachers they need, which may have implications for the quality of education.
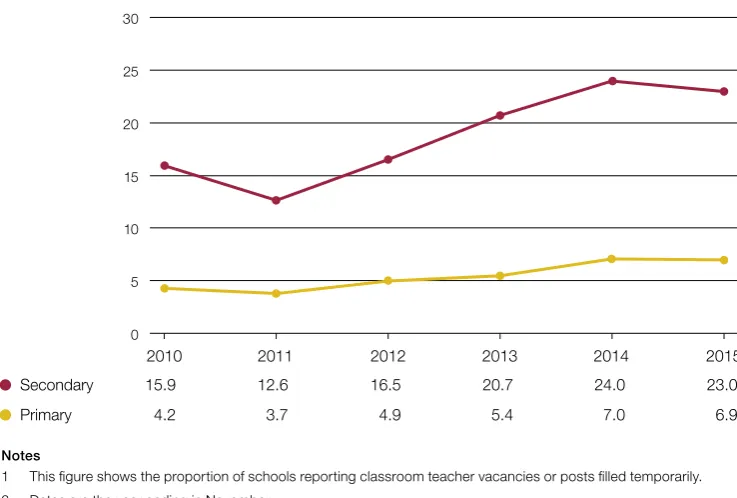
Overall, the number of reported teacher vacancies has increased but remains low as a proportion of the total workforce. In 2016 schools reported that they had 4,200 vacancies and posts filled temporarily (1.2%), compared with 2,170 (0.6%) in 2010. The proportion of secondary schools reporting at least one teacher vacancy rose from 15.9% in 2010 to 23.0% in 2015; for primary schools, the proportion rose from 4.2% to 6.9% over the same period. Our survey found that schools filled only around half of their vacant posts during 2015/16 with qualified teachers with the experience and expertise required. Schools generally filled the remainder with less experienced teachers, or with teachers with different subject specialisms. However, in around one-tenth of cases, schools did not fill the vacancy at all (paragraphs 2.23 and 2.24).
18 A greater number of qualified teachers are returning to state-funded
schools, and the Department and schools have scope to attract back even more teachers who have left and benefit from the investment made in their training.
In 2016, 14,200 full-time equivalent teachers returned to work in state-funded schools, an increase of 1,110 on 2011. There is a large pool of trained teachers who are not currently working in state-funded schools. The Department’s most recent data show that 243,900 qualified former teachers aged under 60 were not in teaching at the end of 2015, 63% of whom had worked in the previous 10 years. Our survey found, however, that nearly 90% of school leaders had not employed anyone returning to teaching in 2015/16. Schools may prefer to take on newly qualified teachers, for example because they are cheaper or have up-to-date curriculum knowledge. Schools may also not offer the flexible working conditions that some returning teachers seek. The Department’s first return-to-work pilot project recruited 428 returning teachers, just over half of the target of 810 (paragraphs 2.17 to 2.21).
Teacher quality
20 A greater number of pupils are in schools where Ofsted has rated the quality of teaching, learning and assessment as good or outstanding, but there is considerable regional variation. Measuring teacher quality is not straightforward and it is particularly difficult to assess quality in terms of educational outcomes. The Department uses proxy indicators to measure quality, including Ofsted ratings. In 2016, 90% of primary pupils and 82% of secondary pupils were in schools where Ofsted rated the quality of teaching, learning and assessment as outstanding or good. This compared with 68% and 67% respectively in 2010. However, in 2016 the proportion of pupils in secondary schools where Ofsted rated the teaching, learning and assessment as requires improvement or inadequate varied from 9% in London to 26% in Yorkshire and the Humber. The proportion of pupils in secondary schools rated as inadequate increased with deprivation (paragraphs 3.3 to 3.8).
21 The available data suggest that teachers are undertaking relatively low levels of training and development, with schools reporting that time and cost are barriers to improving teacher quality. Unlike many other professions, teaching does not set and regulate continuing professional development requirements. The Department has published guidance but schools do not have to follow it and there are no minimum expectations for teachers’ continuing professional development. The Education Policy Institute reported that, on average, teachers in England spent four days a year on continuing professional development in 2013, compared with an average of 10.5 days across the 36 countries covered by its analysis. In our survey, at least 94% of school leaders said that time and cost are barriers to improving the quality of their teaching workforce. The need for schools to make significant workforce efficiency savings is likely to make it more difficult for them to support teachers’ development. Schools also struggle with finding training of the right quality, with no regulation of the wide range of external providers (paragraphs 3.9 to 3.13).
Conclusion on value for money
23 Developments, such as the Chartered College of Teaching, are promising but are at an early stage. The college will need ongoing support from the Department and the schools sector if it is to help address the issues we have identified. The Department still lacks data on local patterns of demand and supply and cannot demonstrate that its interventions are having a positive impact on teacher retention, deployment and quality. Overall, the Department cannot be assured that schools and the teaching profession are implementing its policy intent and we cannot conclude that it is achieving value for money.
Recommendations
a The Department should set out, and communicate to schools and other bodies in the sector, its approach to improving teacher retention, deployment and quality. This should include: details of its various programmes and the funding available; what outcomes it is aiming to achieve and by when, and how progress will be measured; and its assessment of how schools can retain and develop their teachers at the same time as making significant workforce efficiency savings.
b The Department should set out clear measures of success and plans for evaluating its various programmes, including impact and outcome indicators.
c The Department should use the information it is developing on local teacher demand and supply to determine how best to support schools or to intervene in the market.
d The Department should work with the schools sector to understand better why more teachers are leaving before retirement and how to attract more former teachers back to the profession. It should, for example, work with the sector on how to implement flexible working or provide refresher training to former teachers looking to return.
e The Department should work with, and support, the Chartered College of Teaching, teaching schools and others in the schools sector to develop clearer expectations for teachers’ continuing professional development.
This should form part of its work with the college and others to support teaching as a profession.
f The Department should, as a matter of routine, explicitly assess the workforce implications for schools of all key policy changes and guidance, in particular the impact on teachers’ workload. It should also consider the cumulative impact on schools and teachers of changes initiated by central government.
Part One
The teaching workforce and the
Department’s approach
1.1 This part of the report sets out the changes in the teaching workforce, the Department for Education’s (the Department’s) approach to retaining and developing the workforce, and responsibilities and accountabilities.
Changes in the teaching workforce
1.2 Since 2010, the number of teachers in state-funded schools has grown as more teachers have joined the workforce than have left. Overall, the workforce increased by 15,500 (3.5%) from 441,800 in November 2010 to 457,300 in November 2016.2
However, significant growth in the number of primary school teachers masks a fall in the number of secondary school teachers (Figure 2 overleaf):
•
The number of teachers in primary and nursery schools increased by 26,000 (13.2%) from 196,400 in 2010 to 222,400 in 2016. Over a similar period, the number of pupils of primary and nursery age in state-funded schools increased by 598,000 (14.6%) from 4,106,000 to 4,704,000.3 The pupil–teacher ratio has remained fairlyconstant since 2011 and was 20.6:1 in 2016.4
•
The number of teachers in secondary schools fell by 10,800 (4.9%) from 219,000 in 2010 to 208,200 in 2016. Over a similar period, the number of 11- to 15-year-old pupils in state-funded schools fell by 63,000 (2.2%) from 2,849,000 to 2,786,000. The pupil–teacher ratio increased from 14.9:1 in 2011 to 15.6:1 in 2016.2 All figures are full-time equivalents. Overall workforce figures also include teachers employed in special schools or centrally by local authorities (see Figure 1 for more detail). The number of teachers employed in special schools or centrally rose by 200 from 2010 to 2016.
3 The Department records teacher numbers and pupil–teacher ratios through the school workforce census in November each year, and records pupil numbers through the school census in January each year.
1.3 The Department expects the teaching workforce to continue to grow, but not sufficient to keep pace with increasing pupil numbers in secondary schools. It forecasts that pupil–teacher ratios will rise in secondary schools, which risks adding to teachers’ workload. We found that:
•
the Department forecasts that secondary school pupil numbers will increase by 540,000 (19.4%) from January 2017 to 3,326,000 in January 2025 (Figure 3). Its teacher supply model predicts that pupil–teacher ratios will increase from 14.5:1 in 2016/17 to 16.0:1 in 2025/26; and5•
the Department forecasts a slight increase in the pupil–teacher ratio in primary schools from 20.1:1 in 2016/17 to 20.3:1 in 2019/20, when the growth in pupil numbers is expected to stop.5 The Department uses the teacher supply model to determine how many new teachers need to be recruited and trained each year. The calculation of pupil–teacher ratios in the teacher supply model differs from those presented in other government publications, such as the school workforce census. This is because the Department includes, for example, occasional and centrally employed teachers, as well as both qualified and unqualified teachers, in its teacher supply model calculations.
Figure 2
Changes in the teaching workforce, 2010 to 2016
Number of teachers (000)
Secondary teachers 219.0 215.2 215.7 214.2 213.4 210.9 208.2
Nursery and primary teachers 196.4 199.5 204.7 209.5 215.5 220.0 222.4
Notes
1 Figures shown are full-time equivalents and include both qualified and unqualified teachers. 2 Dates are for the year ending in November.
Source: Department for Education 2016 school workforce census data 250
200
150
100
50
0
2010 2011 2012 2013 2014 2015 2016
Figu
re
3
Pupil number
s,
20
10
to
20
25
Number of pupils (000)
Pupils aged 5 to 10
3,306 3,330 3,380 3,458 3,570 3,661 3,752 3,839
– primary ag
e
Pupils aged 11 to 15
2,862 2,849 2,823 2,790 2,747 2,738 2,751 2,786
– secondary age Pupils aged 5 to 10
3,925 3,966 3,965 3,965 3,960 3,948 3,928 3,934
– primary age (for
ecast)
Pupils aged 11 to 15
2,850 2,941 3,035 3,107 3,179 3,251 3,312 3,326
– secondary age (for
[image:17.595.68.537.166.785.2]ecast) No te 1 Figures ar e base d on th e n umber of p upils aged fiv e to 10 in stat e-funded primar y school s, an d aged 11 to 15 in sta te -f unde d seconda ry school s, in Januar y each ye ar . Sour ce : Na tional Audi t Of fic e analysi s of Depa rt ment fo r Ed ucatio n’ s p upi l pr ojection mode l, July 20 17 4, 50 0 4, 00 0 3,50 0 3, 000 2, 50 0 2, 000 1, 50 0 1, 00 0 50 0 0 2010 2011 2012 2013 2014 2015 2016 2017 2018 2019 2020
The number of secondary school pupils is expected to rise by 19% between 2017 and 2025
2021
2022
2023
2024
1.4 The impact of rising pupil numbers is greater in secondary schools than primary schools as pupils are generally taught by different teachers for each subject. Curriculum changes also affect the number and type of teachers that schools need, particularly secondary schools. The Department consulted on a proposal to extend the English Baccalaureate to at least 90% of secondary school students by 2020.6,7 It estimated that
take-up for English Baccalaureate subjects would rise from 40% of pupils in 2015/16 to 70% in 2018/19. As a result, demand for geography, history and modern foreign language teachers would increase significantly. In July 2017, the Department announced that, in light of the consultation, its ambition was for 75% of pupils to start to study English Baccalaureate courses by 2022/23 and 90% by 2025/26.
1.5 The Department also told us that it is examining the potential impact of the UK leaving the European Union on teacher supply. It has identified the recruitment and retention of teachers of modern foreign languages, and maths and sciences subjects as areas of potential risk.
The Department’s approach
1.6 Successive governments have aimed to improve the quality of education and teaching. In its March 2016 white paper, the Department set out its ambition to achieve “educational excellence everywhere”.8 It noted that it is essential that the education
system can recruit, train, develop and retain the best possible teachers.
1.7 The Department’s approach is to give schools autonomy within a school-led system. It expects schools to play the central role in retaining and developing existing teachers. In the white paper, the Department set out how it would support schools through:
•
recruiting and training new teachers (which we reported on in February 2016);9•
changes to the accreditation of teachers, through ‘qualified teacher status’;•
deploying teachers through the new National Teaching Service;•
a sufficient supply of high-quality continuous professional development; and•
support for a strong, evidence-informed profession.6 The Department introduced the English Baccalaureate in 2010. It is a performance measure to encourage schools to increase the number of pupils at key stage 4 attaining grade C or above in the core academic subjects: English, maths, history or geography, the sciences and a foreign language.
7 Department for Education, Consultation on implementing the English Baccalaureate, November 2015. 8 Department for Education, Educational Excellence Everywhere, Cm 9230, March 2016.
1.8 The Department has been developing its approach since the white paper was published. The Secretary of State for Education has made a series of speeches outlining the Department’s intent and announced a number of new programmes. The main features of the Department’s current approach are as follows:
•
A focus on areas of disadvantage and removing obstacles to social mobility.The Department considers that the single biggest educational factor that affects social mobility is the quality of the teachers and other professionals working with young people.10 It has created 12 opportunity areas, places that will receive funding
and other support with the aim of ensuring that children in these parts of the country have opportunities to reach their potential.11
The Department has allocated £72 million in total over three years from 2017-18 across the 12 opportunity areas. It will also provide further funding and support to some or all of these areas as part of other programmes. These include leadership development and literacy improvement programmes as part of the Teaching and Leadership Innovation Fund.12
•
Support for schools. The Department recognises that not all schools are well placed to implement the school-led approach effectively. It is therefore focusing on building capacity within the sector. It has announced a Strategic School Improvement Fund, which will provide £140 million to help schools most in need of improvement.•
Support for teaching as a profession. The Secretary of State has emphasised the importance of teaching having the ‘hallmarks’ of other professions – a high bar to entry, high-quality initial training and a culture of ongoing self-improvement.13As part of this, the Department is supporting the establishment of a Chartered College of Teaching. In contrast to other professions, such as accountancy, law and medicine, teachers have lacked an independent professional body to support them in their work and development and to set standards.
The establishment of the Chartered College of Teaching is an important
development. The college opened in January 2017. The Department is providing funding of up to £5 million over four years. In the longer term, it expects the college to be self-sufficient through membership fees (currently £45 per year) and income from its activities. The college aims to recruit as quickly as possible and has a target of 18,000 members by April 2018. It plans to provide its members with a range of support, including training and development, opportunities to share knowledge, and access to research and good practice. The college is also examining options for other income sources including through sales of chartered teaching scholarship routes and journal revenue.
10 Secretary of State for Education, Speech: Education at the core of social mobility, 18 January 2017.
11 The 12 opportunity areas are: Blackpool, Bradford, Derby, Doncaster, Fenland and East Cambridgeshire, Hastings, Ipswich, Norwich, Oldham, Scarborough, Stoke-on-Trent and West Somerset.
12 See Figure 17 for more details of the Teaching and Leadership Innovation Fund.
1.9 At the time of our work, the Department had not brought together its
strategic thinking into a coherent plan for the teaching workforce which it could use to communicate with schools and the teaching profession. It has, for example, not set out what it is aiming to achieve and by when, how its various initiatives are expected to contribute, or how its ambitions for the teaching workforce align with other policies, including plans for efficiency savings in schools.
The financial context for schools
1.10 There is a risk of tension between the Department’s financial health and efficiency programme and its ambitions for the workforce. In order to make efficiency savings, schools are likely to take actions that have workforce implications. In March 2017 the Committee of Public Accounts concluded that these actions are likely to increase teachers’ workload, which may in turn affect recruitment and retention.14 Schools’
ability to support training and development is also likely to be diminished.
1.11 The Department protected the total core schools budget in real terms following the 2015 Spending Review settlement. However, with pupil numbers rising, average funding per pupil was not due to increase in line with inflation. To deal with this, and meet cost pressures outside their control, schools would have needed to make efficiency savings each year, rising from £1.1 billion in 2016-17 to £3.0 billion (equivalent to 8% of the total budget) in 2019-20.15,16
1.12 In July 2017 the Department announced additional funding of £1.3 billion for the core schools budget over two years, 2018-19 and 2019-20. This means that core schools funding will now be maintained in real terms per pupil over this two-year period. Schools still need to make efficiency savings over the period between 2015-16 to 2019-20 as a whole. However, the Department has not yet set out revised estimates of the efficiency savings schools need to make following the announcement. It plans to finance the additional funding through efficiencies and savings elsewhere in its budget. As part of this, it intends to redirect to schools £600 million from its resource budget, including £200 million from central improvement programmes. The Department has not yet identified precisely which programmes will be affected.
1.13 Schools spent £21 billion, just over half of total spending, on teaching staff between 2014 and 2015 (£12.6 billion by maintained schools in 2014-15 and £8.4 billion by
academies in 2014/15).17 They also spent a further £10 billion on other staff during that
period. Following the 2015 Spending Review, the Department expected schools to find efficiency savings of £1.7 billion by 2019-20 from using staff more efficiently. It published a guide to workforce planning to help schools. However, as the Department’s guidance notes, changing the structure of a school workforce (both the number of staff and how they are used) should ideally be planned and implemented over three to five years.18
14 HC Committee of Public Accounts, Financial sustainability of schools, Forty-ninth Report of Session 2016-17, HC 890, March 2017.
15 Cost pressures include salary increases, higher teachers’ pension scheme and national insurance contributions, and the apprenticeship levy.
16 Comptroller and Auditor General, Financial sustainability of schools, Session 2016-17, HC 850, National Audit Office, December 2016.
17 See footnote 16.
To meet immediate cost pressures, schools are likely to increase teachers’ contact time and class sizes, rely more on unqualified staff and staff teaching outside of their specialism, and require head teachers and other senior staff to do more teaching.
1.14 In addition, the Department is phasing out by 2018/19 the ‘general funding rate’ from the Education Services Grant, which was worth £87 per pupil in 2015/16. Local authorities and academies used this funding to provide support services to schools. In future, maintained schools may receive less support from local authorities and have to pay for more services directly from their own budgets.
Responsibilities and accountabilities
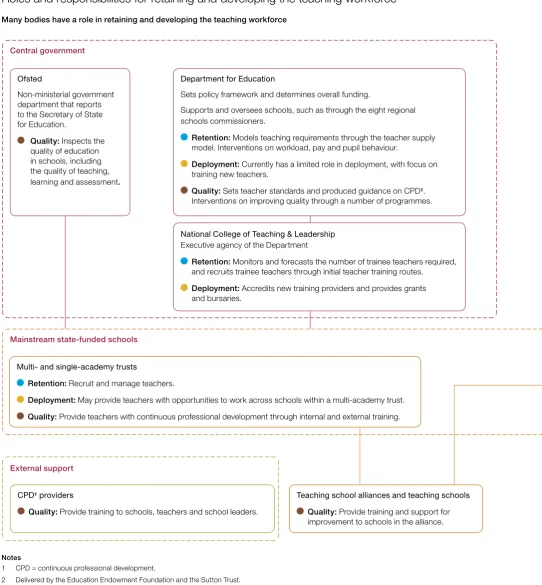
1.15 The arrangements for retaining and developing the teaching workforce are fragmented. Many different national and local bodies have a role in retention, deployment and quality (Figure 4 on pages 20 and 21).
1.16 Ultimately, the Department is accountable for securing value for money from spending on education services. It is responsible for the system of accountability, specifically for having “an adequate framework in place to provide assurance that all resources are managed in an effective and proper manner”.19
1.17 The Department focuses much of its activity on recruiting and training new teachers. It seeks to achieve its aims to retain and develop the teacher workforce mainly through the actions of other bodies. It therefore needs assurance that the system is working effectively, and means of intervening where this is not the case. Its main source of information about teachers is the school workforce census, a statutory data collection undertaken each November. In summary, responsibilities are as follows:
•
Retention – Responsibility rests mainly with maintained schools (supported by local authorities) and academy trusts, as employers. The Department sets the broad framework, and allows school leaders the freedom to manage their teachers. It has some central programmes involving data collection, research and promoting good practice.•
Deployment – The Department largely leaves it to the market to match teachers to jobs but is responsible for the location of new teacher training providers. The Department is working to improve its understanding of whether local teacher supply markets are working effectively.•
Quality – Responsibility rests mainly with schools and teachers themselves. Schools may be supported by teaching schools, multi-academy trusts or local authorities. The Department’s focus is more on the quality of new entrants than the development of existing teachers. It has set a broad framework of standards for schools and teachers to work within, and has some interventions to help schools improve quality.Central government Leadership of profession Education What Works Centre2
Mainstream state-funded schools
[image:22.595.41.584.169.755.2]Local government External support
Figure 4
Roles and responsibilities for retaining and developing the teaching workforce
Many bodies have a role in retaining and developing the teaching workforce
Notes
1 CPD = continuous professional development.
2 Delivered by the Education Endowment Foundation and the Sutton Trust. Source: National Audit Offi ce analysis of Department for Education material
Ofsted
Non-ministerial government department that reports to the Secretary of State for Education.
Quality: Inspects the quality of education in schools, including the quality of teaching,
learning and assessment.
Department for Education
Sets policy framework and determines overall funding.
Supports and oversees schools, such as through the eight regional schools commissioners.
Retention: Models teaching requirements through the teacher supply model. Interventions on workload, pay and pupil behaviour.
Deployment: Currently has a limited role in deployment, with focus on training new teachers.
Quality: Sets teacher standards and produced guidance on CPD1. Interventions on improving quality through a number of programmes.
Chartered College of Teaching
A new independent body for the teaching profession.
Retention: Promotes the profession’s status.
Quality: Provides teachers with access to evidence-informed research. Supports teachers to gain knowledge and expertise.
Teaching unions
Represent and campaign for members’ interests.
Provide advice and information.
Quality: Provide training
courses and advice on CPD1
and perform research.
National and specialist leaders of education
Quality:Engage with schools to support school improvement.
Quality: Researches, shares and encourages use of evidence-based approaches to improve teaching and learning.
National College of Teaching & Leadership
Executive agency of the Department
Retention: Monitors and forecasts the number of trainee teachers required, and recruits trainee teachers through initial teacher training routes.
Deployment: Accredits new training providers and provides grants and bursaries.
Multi- and single-academy trusts
Retention: Recruit and manage teachers.
Deployment: May provide teachers with opportunities to work across schools within a multi-academy trust. Quality: Provide teachers with continuous professional development through internal and external training.
CPD1 providers
Quality:Provide training to schools, teachers and school leaders.
Teaching school alliances and teaching schools Quality:Provide training and support for
improvement to schools in the alliance.
Maintained schools
Retention: Recruit and manage teachers.
Quality: Provide teachers with continuous professional development through internal and external training.
Local authorities
Retention: Hold employment contracts for staff in maintained schools. May provide support through training, eg on well-being.
Deployment: Some support through recruitment fairs, recruitment pools, providing information on vacancies.
Central government Leadership of profession Education What Works Centre2
Mainstream state-funded schools
[image:23.595.49.543.161.745.2]Local government External support
Figure 4
Roles and responsibilities for retaining and developing the teaching workforce
Many bodies have a role in retaining and developing the teaching workforce
Notes
1 CPD = continuous professional development.
2 Delivered by the Education Endowment Foundation and the Sutton Trust. Source: National Audit Offi ce analysis of Department for Education material
Ofsted
Non-ministerial government department that reports to the Secretary of State for Education.
Quality: Inspects the quality of education in schools, including the quality of teaching,
learning and assessment.
Department for Education
Sets policy framework and determines overall funding.
Supports and oversees schools, such as through the eight regional schools commissioners.
Retention: Models teaching requirements through the teacher supply model. Interventions on workload, pay and pupil behaviour.
Deployment: Currently has a limited role in deployment, with focus on training new teachers.
Quality: Sets teacher standards and produced guidance on CPD1. Interventions on improving quality through a number of programmes.
Chartered College of Teaching
A new independent body for the teaching profession.
Retention: Promotes the profession’s status.
Quality: Provides teachers with access to evidence-informed research. Supports teachers to gain knowledge and expertise.
Teaching unions
Represent and campaign for members’ interests.
Provide advice and information.
Quality: Provide training
courses and advice on CPD1
and perform research.
National and specialist leaders of education
Quality:Engage with schools to support school improvement.
Quality: Researches, shares and encourages use of evidence-based approaches to improve teaching and learning.
National College of Teaching & Leadership
Executive agency of the Department
Retention: Monitors and forecasts the number of trainee teachers required, and recruits trainee teachers through initial teacher training routes.
Deployment: Accredits new training providers and provides grants and bursaries.
Multi- and single-academy trusts
Retention: Recruit and manage teachers.
Deployment: May provide teachers with opportunities to work across schools within a multi-academy trust. Quality: Provide teachers with continuous professional development through internal and external training.
CPD1 providers
Quality:Provide training to schools, teachers and school leaders.
Teaching school alliances and teaching schools Quality:Provide training and support for
improvement to schools in the alliance.
Maintained schools
Retention: Recruit and manage teachers.
Quality: Provide teachers with continuous professional development through internal and external training.
Local authorities
Retention: Hold employment contracts for staff in maintained schools. May provide support through training, eg on well-being.
Deployment: Some support through recruitment fairs, recruitment pools, providing information on vacancies.
1.18 Parts Two and Three of this report set out our specific findings on the Department’s programmes to improve teacher retention, deployment and quality.
Engagement between schools and the Department
1.19 In supporting the new Chartered College of Teaching (paragraph 1.8), the Department wants the teaching profession to take greater ownership of quality and teaching practice, but this will take some time. For the current system to work effectively, the Department needs to support schools and communicate its policy intent to them, and schools need to engage with the Department’s interventions. Our survey of school leaders indicates shortcomings in both aspects.
1.20 Our survey of school leaders found that around 85% of secondary school leaders and 75% of primary school leaders disagreed that the Department provides them with sufficient support to recruit or retain high-quality teachers (Figure 5). The small sample of schools we visited reported no, or low levels of, communication and engagement with the Department.
Figure 5
School leaders’ views on the Department’s support for schools to recruit and retain
high-quality teachers
Most school leaders disagreed that the Department provides schools with sufficient support to recruit and retain high-quality teachers
Notes
1 Paragraph 3.3 covers school leaders’ views on what makes a high-quality teacher. 2 Survey results may not sum to 100% due to rounding.
Source: National Audit Office survey of school leaders, 2017
Secondary school leaders
Primary school leaders
0
Proportion of school leaders who consider that their school receives sufficient support from the Department to recruit high-quality teachers (%)
Disagree
Neither agree nor disagree Agree
Don’t know
Recruiting high-quality teachers
10 20 30 40 50 60 70 80 90 100
87 12 1
19 2 2 77
Secondary school leaders
Primary school leaders
0
Proportion of school leaders who consider that their school receives sufficient support from the Department to retain high-quality teachers (%) Retaining high-quality teachers
10 20 30 40 50 60 70 80 90 100
21 4 1
74
1
Part Two
Retention, recruitment of former teachers
and deployment
2.1 This part of the report examines teacher retention, attracting former teachers back into the workforce, and whether teachers are deployed in the areas where they are needed most.
Retention
2.2 To meet the increasing need for teachers, particularly in secondary schools, the Department for Education (the Department) and schools will need to improve teacher recruitment and retention. We reported in February 2016 that the Department has not met its overall target for filling teacher training places in each of the past four years.20
It has since missed the target for a fifth year. Without enough trainee teachers, it is even more important for schools to retain those already in the workforce.
2.3 However, qualified teachers are increasingly leaving state-funded schools, although the number of leavers remains below the Department’s forecast. The total number of qualified teachers leaving state-funded schools increased by 0.6 percentage points from 9.3% of the qualified workforce (39,370) in 2011 to 9.9% (42,830) in 2016.21 The number
of leavers in 2016 was lower than the Department’s forecast of 47,360 for 2015/16. The Department expects the number of qualified teachers leaving will remain constant at around 48,000 annually over the next 10 years.
2.4 The National Foundation for Educational Research reported in September 2016 that retention pressures appeared to be growing. Its research found that the proportion of teachers considering leaving the profession had increased from 17% surveyed in June 2015 to 23% in May 2016.22
20 Comptroller and Auditor General, Training new teachers, Session 2016-17, HC 798, National Audit Office, February 2016.
21 All teacher numbers are full-time equivalents.
2.5 Evidence indicates that there are two phases in their career when teachers are most likely to leave: within a few years of qualifying, and as they approach retirement. The Department’s data show that, on average, around a quarter of newly qualified teachers who join state-funded schools leave within four years. The rate of departure is highest in the first three years after qualification and is then relatively stable. There are now also fewer teachers aged 50 or over – they comprised 17.8% of the workforce in 2016 compared with 22.9% in 2011.
Why teachers leave
2.6 Teachers are increasingly leaving for reasons other than retirement. The number of qualified teachers retiring fell by 1.5 percentage points from 3.3% of the qualified workforce (13,880) in 2011 to 1.8% (7,760) in 2016 (Figure 6 overleaf). Over the same period, the number leaving for other reasons increased by 2.1 percentage points (9,650) from 6.0% (25,260) of the qualified workforce to 8.1% (34,910). The National Foundation for Educational Research reported in November 2015 that just over half of teachers who leave the state-funded sector as teachers remain working in schools. For example, they may become teaching assistants or take up a non-teaching role in a school.23
2.7 The Department and the schools sector lack sufficient information to determine why an increasing number of teachers are leaving before retirement. The Department collects data on teacher retention as part of the annual school workforce census, including the gender and age of leavers, but not on the reasons why they left. The House of Commons Education Committee recommended in February 2017 that the Department should collect more granular data on teacher retention.24 The Department has since
published analysis on teacher retention by subject, which found that more teachers are leaving across all subjects.25 It recognises, however, that there are still information
gaps, particularly at local level, and is beginning to address these as part of its work to understand where there are teacher shortages (paragraphs 2.27 and 2.28). During February and March 2017, it also conducted a survey of teachers who have left the profession. The results are expected in autumn 2017.
2.8 There is, however, reasonable consensus that workload is a significant reason why teachers leave the profession. For example, our survey of school leaders found that workload was the most important of the factors listed: 67% of respondents reported that workload is a barrier to retention (Figure 7 on page 27). The House of Commons Education Committee also concluded in February 2017 that unmanageable workload is a key driver for teachers considering leaving the profession.26 This conclusion
was supported by evidence from the teaching unions and the teachers in the small sample of schools we visited.
23 National Foundation for Educational Research, Should I Stay or Should I Go?NFER Analysis of Teacher Retention, November 2015.
24 HC Education Committee, Recruitment and retention of teachers, Fifth Report of Session 2016-17, HC 199, February 2017.
Figure 6
The number of qualified teachers leaving by reason for departure, 2011 to 2016
Teacher numbers (000)
Total leavers from teaching 39,370 37,710 39,560 42,210 43,370 42,830
in the state-funded sector
Leavers for reasons other 25,260 24,860 27,810 30,930 33,730 34,910
than retirement
Retired 13,880 12,600 11,570 11,060 9,440 7,760
Notes
1 Data on leavers are available on a consistent basis only from 2011. 2 Dates are the year ending in November.
3 Teacher numbers are full-time equivalents.
Source: Department for Education 2016 school workforce census data
The number of teachers leaving for reasons other than retirement rose, while the number retiring fell
0 5 10 15 20 25 30 35 40 45 50
Figure 7
School leaders’ views of the factors that affect teacher retention
School leaders consider that workload is the most significant barrier to teacher retention
Note
1 Survey results may not sum to 100% due to rounding.
Source: National Audit Office survey of school leaders, 2017
Reputation of the school
Training and development opportunities in your school
Ofsted rating
0 10 20
School leaders’ views on the factors that affect teacher retention (%)
Major barrier Minor barrier
Flexible working opportunities
Opportunities to progress in your school
Working with challenging pupils
The salary and benefits package you are able to offer
The geographical location of your school
Factors affecting the cost of living, eg house prices
Teacher workload
30 40 50 60 70 80 90 100
Not a barrier or incentive Don’t know
Minor incentive Major incentive
21
2 4 1 24 48
28
2 6 37 27
33
4 6 2 32 23
45
6 20 4 20 5
23
7 22 30 18
61
10 18 2 7 2
49
13 21 2 11 3
43
14 18 1 17 7
47
27 15 2 7 2
20
2.9 Teachers report that regular curriculum and assessment changes have added significantly to their workload. In September 2016, the National Foundation for Educational Research reported that the small, self-selecting sample of teachers it interviewed mostly considered that inspection and policy changes were the main drivers of increased workload.27 Recent changes that schools have been
implementing include a new assessment and accountability framework for primary schools, and a revised secondary curriculum, including a new GCSE grading system.28 The Department recognises that curriculum and assessment changes
affect teachers’ workload. In March 2015, it committed to introduce minimum lead-in times for significant changes and to do more to consider the impact on schools when making changes.29 Teachers have also reported that the way tasks, such as marking
and data management, are carried out in schools can add to their workload.30
2.10 The Chartered College of Teaching told us that it will potentially be able to help teachers to manage their workload – for example, by providing guidance on what teachers can stop doing or do less of, based on evidence of what works in the classroom. It also stressed the importance of school leaders and teachers being supported to exercise their professional judgement in managing workload.
2.11 Many important factors that could influence teachers to stay are within schools’ control. For example, of the school leaders we surveyed, around two-thirds considered that training and development is an incentive for teachers to stay and around half considered opportunities to progress as an incentive (Figure 7). The National Foundation for Educational Research reported in September 2016 that the more teachers were engaged with their job, influenced by factors such as reward and recognition and school culture, the less likely they were to consider leaving.31
The Department’s programmes to improve teacher retention
2.12 The Department considers that it can influence retention through national
interventions on workload, pay and pupil behaviour. It spent around £81,000 in 2015-16 and £91,000 in 2016-17 on initiatives concerned with workload and pupil behaviour.
27 See footnote 22.
28 Department for Education, Primary school accountability in 2016: A technical guide for primary maintained schools, academies and free schools, April 2017.
29 Department for Education, Department for Education protocol for changes to accountability, curriculum and qualifications, March 2015. Reissued in February 2017.
Workload
2.13 Following its 2014 survey of teachers on how to reduce unnecessary workload, the Department took a number of actions to address the issues raised:
•
It established three independent review groups in 2015 to examine marking practices, lesson planning and use of resources, and data management. The Department published the reports from these groups in March 2016. It has communicated the reports in a variety of ways and our survey found that 81% of school leaders are aware of them. However, only 44% of school leaders have engaged with the guidance, which we consider to be making use of the guidance in their schools.•
It committed to undertake a survey of teachers every two years to track workload. The Department published the results of its baseline survey in February 2017. This found that classroom teachers and middle leaders reported that they worked 54.4 hours on average during the reference week in March 2016, including the weekend.•
It published an action plan in February 2017 in light of the baseline survey, along with publicity material which it designed with the schools sector. Among other things, the Department plans to reduce the burden from data collection and has offered groups of schools grants to conduct their own workload reviews. It has not set out the level of improvement it expects to see from its actions on workload.Pay
2.14 There are differing views on the impact of pay on teacher retention. Teachers’ pay has been affected by the government’s policy of public sector pay restraint since 2011. The School Teachers’ Review Body reported in July 2017 that, over most of the decade up to 2015/16, teachers’ median earnings grew at a slower rate than earnings across the economy as a whole and the public sector. Its analysis also found that average starting salaries and profession-wide earnings remained considerably lower for teaching than for other graduate professions.32 In our survey, 34% of school leaders said that the salary
and benefits package they could offer was a barrier to retention, with 15% seeing it as an incentive. However, the National Foundation for Educational Research reported in November 2015 that, on average, teachers leaving the profession were not leaving for higher-paid jobs.33
2.15 The Department has provided schools with flexibility over pay and rewards to help them recruit and retain teachers in priority subjects and to link pay rises to performance. The School Teachers’ Review Body reported in July 2017 that many schools are not using these flexibilities. Instead, schools tend to follow their local authority pay models, resulting in broad consistency between schools in any given area.34
32 School Teachers’ Review Body, Twenty-seventh report – 2017, Cm 9454, July 2017. 33 See footnote 23.
Pupil behaviour
2.16 The Department’s 2016 white paper identified poor pupil behaviour as an important factor in teacher retention. The Department appointed an independent behaviour expert who advises on this area in March 2015. He has developed guidance for initial teacher training on pupil behaviour management and practical guidance for school leaders and teachers on how to tackle bad behaviour in classrooms.35,36 The Department will
consider what further support it can provide for schools in response to this work.
Recruiting teachers who have left the profession
2.17 The Department and schools can increase the supply of teachers by encouraging those who have left to return to the profession. This derives value from the money that was previously spent on an individual’s training.
2.18 The number of qualified teachers returning to the profession has increased. In 2016, 14,200 teachers returned, an increase of 1,110 on 2011 (Figure 8). As a proportion of all qualified entrants, the figure for teachers returning has remained fairly constant at around 32%. The Department’s forecasts assume that, on average, around 33% of entrants will be returners. A shortfall of 1 percentage point equates to around 440 teachers in 2016.
2.19 There is a large pool of trained teachers who are not currently working in state-funded schools. The Department’s most recent data show that 243,900 qualified former teachers aged under 60 were not in teaching at the end of 2015, 63% of whom had worked in education in the previous 10 years. There were also 104,700 teachers with qualified teacher status who had never worked as teachers, half of whom had qualified since 2004. We estimate that training a new teacher cost the Department £16,300 in 2013/14, in addition to school and other costs.37 In comparison, the Department provided £1,900 per
participant in its first pilot project to support teachers to return. The Department does not know why some teachers never take up teaching jobs.
35 Tom Bennett, Chair of the ITT Behaviour working group, Developing behaviour management content for initial teacher training (ITT), July 2016.
36 Tom Bennett, Creating a Culture: How school leaders can optimise behaviour, Independent review of behaviour in schools, March 2017.
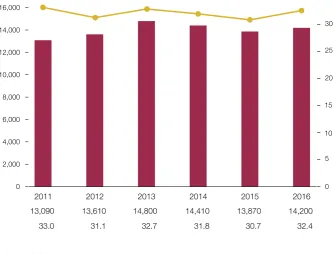
Figure 8
Teachers returning to state-funded schools, 2011 to 2016
Number of qualified teachers Proportion of the qualified teaching workforce (%)
Returners to state-funded sector 13,090 13,610 14,800 14,410 13,870 14,200
Returners as proportion of total entrants 33.0 31.1 32.7 31.8 30.7 32.4
Notes
1 Data on returners are available on a consistent basis only from 2011. 2 Dates are the year ending in November.
3 Teacher numbers are full-time equivalents.
Source: Department for Education 2016 school workforce census data
The number of teachers returning increased by 1,110 between 2011 and 2016
0 5 10 15 20 25 30 35
0 2,000 4,000 6,000 8,000 10,000 12,000 14,000 16,000
2.20 We found that schools may prefer to employ newly qualified teachers, which may reduce the opportunities for teachers wanting to return. In our survey, nearly 90% of school leaders reported that they had not employed anyone returning to teaching in 2015/16. We heard a number of reasons why schools may not take on returning teachers:
•
Experienced returning teachers are likely to be more expensive than newly qualified teachers, making them less attractive, particularly when schools are under financial pressure.•
Schools may be concerned that returning teachers lack recent classroom experience, along with up-to-date policy, curriculum and subject knowledge.•
Schools may be reluctant to offer flexible working, which some returning teachers seek. In February 2017, the Teachers Working Longer Review Steering Group reported that, from the limited evidence available, the opportunity to work flexibly varies from school to school.38 The reasons for the variation include culturalbarriers, school managers’ attitudes to flexible working, and practical difficulties, such as timetabling. The Department published guidance on flexible working in schools in February 2017.39
The Department’s programmes to attract former teachers
2.21 The Department has had limited success with its small number of interventions to attract teachers back to the workforce. These programmes,
including a marketing campaign and two pilot projects, cost an estimated £1.2 million in 2016-17 (Figure 9). The first pilot recruited 428 returning teachers, just over half of its target of 810; 330 completed the training provided. The Department began its second pilot in February 2017 and plans to support up to 84 former teachers to return.
Deployment
2.22 Schools are responsible for employing enough teachers of the right quality to teach the curriculum to their pupils. There is no national or regional coordination of where teachers work (paragraphs 1.15 and 1.17). Multi-academy trusts may move and share teachers between their schools in order to deploy them effectively.
2.23 Schools report that they find it difficult to fill full-time teacher posts. Our survey found that during 2015/16 school leaders filled only around half of their vacant posts with qualified teachers with the experience and expertise required (Figure 10 on page 34). Schools generally filled the remainder with temporary or supply teachers or recruited less experienced teachers. However, for 9% of primary school posts and 11% of secondary school posts, schools did not fill the vacancy at all.
38 Teachers Working Longer Review Steering Group, Interim Report, February 2017.
2.24 Overall, the number of reported teacher vacancies remains low as a proportion of the workforce but is increasing, particularly in secondary schools. The Department accepts that the following figures are likely to be an underestimate, partly because it collects the data in November when vacancy rates in schools are comparatively low:
•
In 2016 schools reported that they had 4,200 teacher vacancies and posts filled temporarily (1.2%), compared with 2,170 (0.6%) in 2010.•
The proportion of secondary schools reporting at least one teacher vacancy, including posts filled temporarily, increased from 15.9% in 2010 to 23.0% in 2015 (Figure 11 on page 35). A lower proportion of primary schools reported vacancies: 6.9% in 2015 compared with 4.2% in 2010.Figure 9
The Department’s programmes to encourage former teachers to return
We estimate the Department’s three programmes cost £1.2 million in 2016-17
Programme Aim Cost
Return to teaching pilot
(launched in October 2015) and Returners engagement programme pilot (launched November 2016)
To test whether secondary schools can improve teacher recruitment in maths, physics, modern foreign languages and, for the October 2015 pilot, other English Baccelaureate subjects by providing a bespoke package of support to qualified teachers who wish to return to teaching, particularly in hard to recruit areas.
First pilot: £586,000 over two years, 2015-16 and 2016-17
(2016-17: £353,000)
Second pilot: Estimated cost £211,000 over two years, 2016-17 and 2017-18 (2016-17: £64,000)
Return to teaching marketing campaign
(launched November 2016)
To support the return to teaching pilots and teaching advisor service, and build a pool of potential returners.
£650,000 over two years, 2015-16 to 2016-17 (2016-17: £350,000)
Return to teaching advisor service
(extended from April 2015)
To support returning maths, physics and modern foreign language teachers with the aim of recruiting 750 former teachers by 2020.
£861,000 over three years, 2015-16 to 2017-18 (2016-17: £450,000)
Figure 10
Outcome of teacher recruitment in 2015/16
Proportion of vacancies advertised (%)
The schools we surveyed filled only around half of vacancies advertised with a qualified teacher with the experience and expertise required
We recruited a qualified teacher with the experience and expertise required We recruited a teacher with different subject expertise than required We recruited a teacher with less experience than required
We recruited a temporary or supply teacher We failed to recruit for a vacancy which was open
Note
1 School leaders reported 2,785 advertised vacancies. Where a school leader reported more than one vacancy in their survey response, we accounted for them separately.
Source: National Audit Office survey of school leaders, 2017
Primary Secondary
0 40 50 60 70 80 90 100
30
20
10
School leaders
11
21
52
12
4
46
29
14
2
2.25 Difficulties in filling vacancies can add to the pressure on school budgets, as schools may have to pay a premium for agency and supply teachers. Spending on temporary staff has increased slightly as a proportion of total spending in maintained schools and academies:
•
Maintained schools spent 3.0% (£813.7 million) of total spending on temporary staff in 2015-16, compared with 2.6% in 2010-11.•
Academies spent 2.2% (£389.7 million) of total spending on temporary staff in 2015/16, compared with 2.0% in 2012/13.40 [image:37.595.170.539.214.463.2]40 The Department does not have reliable data on academy spending prior to 2012/13.
Figure 11
Proportion of schools reporting at least one vacancy, 2010 to 2015
Proportion of schools reporting at least one vacancy (%)
Secondary 15.9 12.6 16.5 20.7 24.0 23.0
Primary 4.2 3.7 4.9 5.4 7.0 6.9
0 5 15 20 25 30
2010 2011 2012 2013 2014 2015
A larger proportion of secondary than primary schools reported at least one teacher vacancy
10
Notes
1 This figure shows the proportion of schools reporting classroom teacher vacancies or posts filled temporarily. 2 Dates are the year ending in November.
Geographical variation
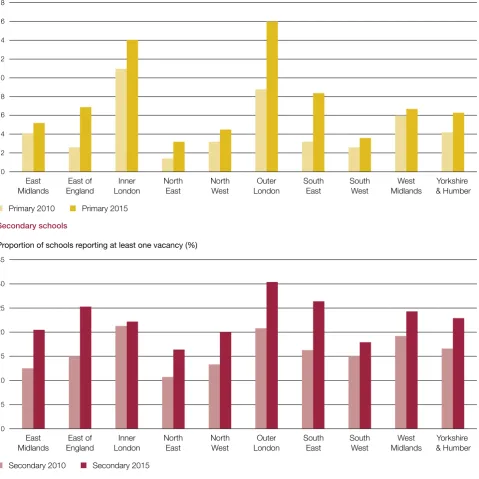
2.26 The extent of teacher vacancies varies across the country, although in all regions the proportion of schools reporting at least one vacancy increased between 2010 and 2015 (Figure 12). In 2015 the North East had the lowest proportion of schools reporting at least one vacancy (16.4% of secondary schools and 3.2% of primary schools). The highest proportions of secondary schools reporting at least one vacancy were in outer London (30.4%), the South East (26.4%) and the East of England (25.3%).
2.27 The Department continues to have limited information on local teacher supply and the factors that affect it, but is developing ways to collect better data. In response to the Committee of Public Accounts report on training new teachers, the Department has further analysed where there are teacher shortages.41,42 Its early findings suggest that
the extent of teacher shortfalls seem to be affected not just by the region or location but also by factors relating to individual schools, including Ofsted ratings, the type of school and leadership at the school.
2.28 At the time of our work, the Department was developing approaches to improve its understanding of local teacher supply, but these measures were generally at an early stage. For example, it is:
•
testing software that could identify teaching jobs advertised online to show where school vacancies exist at a point in time;•
developing a ‘supply-index’ metric that would enable it to measure the likely recruitment challenge that a school faces; and•
examining in detail the issues affecting teacher supply in a sample of local areas.The Department’s programmes to improve deployment
2.29 The main way that the Department influences the deployment of teachers across the country is through the location of training places. This is important
because teachers commonly stay in the area they train. In response to the Committee of Public Accounts report, the Department changed its criteria for accrediting initial teacher training providers.43 The criteria now include consideration of the demand for
training in an area and how the provider will help schools in greatest need of teachers. The Department, in its analysis published in May 2017, also found that most teachers stay within commuting distance when moving schools.44
2.30 In its 2016 white paper, the Department said that it would support schools in the deployment of teachers. It intended that, by 2020, a National Teaching Service would place up to 1,500 high-performing teachers and middle leaders into underperforming schools that struggle with recruitment and retention. However, the Department decided not to proceed with this scheme after a pilot project proved unsuccessful.
41 HC Committee of Public Accounts, Training new teachers, Third Report of Session 2016-17, HC 73, June 2016. 42 HM Treasury, Treasury Minutes, Cm 9351, November 2016.
Figure 12
Schools reporting at least one vacancy by region, 2010 and 2015
Proportion of schools reporting at least one vacancy (%)
In 2015 the North East had the lowest proportion of both primary and secondary schools reporting at least one vacancy, while outer London had the highest proportion of both
Primary schools
Notes
1 This figure shows the proportion of schools reporting classroom teacher vacancies or posts filled temporarily. 2 Dates are the year ending in November.
Source: Departme