by
Djoto Gintin g
A th e s is submitted in p a r t i a l f u l f i l m e n t of the requirements f o r the degree of
Master of A rts in Demography A u s tr a lia n National U n iv e r s it y
Except where otherwise indicated, this thesis is my own work.
CONTENTS
Page
ACKNOWLEDGEMENTS i v
ABSTRACT V
LIST OF TABLES v i
LIST OF APPENDICES AND MAP X
CHAPTER ONE INTRODUCTION
1.1. The a re a o f t h e s t u d y 1
1 . 2 . The s o u r c e s o f t h e d a t a 6
1 . 3 . Q u a l i t y o f t h e d a t a 10
1 . 4 . Pur pose o f t h e s t u d y 11
1 . 5 . Hypotheses 11
1 . 6 . Scope o f t h e s t u d y 11
CHAPTER TWO FERTILITY DIFFERENTIALS
2 . 1 . S o c i o - e c o n o m i c c o n d i t i o n s 13 2 . 2 . U r b a n - r u r a l d i f f e r e n t i a l s 17 2 . 3 . E d u c a t i o n a l d i f f e r e n t i a l s 21
2 . 4 . Work s t a t u s d i f f e r e n t i a l s 26
2 . 5 . R e l i g i o u s d i f f e r e n t i a l s 28
2 . 6 . D i s t r i c t and e t h n i c i t y d i f f e r e n t i a l s 32
CHAPTER THREE AGE AT FIRST MARRIAGE AND FAMILY PLANNING 3 . 1 . The q u e s t i o n s f o r age a t f i r s t m a r r i a g e and
f a m i l y p l a n n i n g
40
3 . 2 . F e r t i l i t y a c c o r d i n g t o age a t f i r s t m a r r i a g e
3.3. The need f o r and use o f f a m i ly planning 44
3.4. C on trace p tive use 52
3.5. Methods used 55
3.6. The task ahead 57
CHAPTER FOUR SUMMARY AND CONCLUSIONS
4 .1 . F e r t i l i t y d i f f e r e n t i a l s 60
4 .2 . Age a t f i r s t m arriage 63
4 .3 . Family planning 63
REFERENCES 65
ACKNOWLEDGEMENTS
I wish to express my sincere thanks to the Australian Government for awarding me a scholarship under the Colombo Plan to pursue my studies at the Department of Demography, Development Studies Centre, Australian National University.
Many forms of assistance were received throughout the period of my study in Canberra. I would like to thank in particular:
- Dr. T.H. Hull, my supervisor, Dr. P.F. McDonald, my advisor and teaching staff in DSC - ANU.
- the st aff of DSC - ANU, in computer programming and in the Library for their help.
During rewriting the thesis in Indonesia, my special thanks go to:
- Director of Population Studies Center, Gadjah Mada University for his generous assistance.
- Teaching st a ff and other staff in PPK-UGM.
- Dr. T.H. Hull, Dr. Paul Meyer, Dr. Kim Streatfield and Drs. Kasto MA(D) for reading and giving suggestions on the ea rl ie r draft.
- Dr. Masri Singarimbun and Mrs. Ira Singarimbun for their persuasive advice.
- Thanks go to my wife Erna, my children Si ska, Indi and Andrew for their cheerful co-operation all the time.
ABSTRACT
This study is an attempt to examine the fertility differentials of ever married women of childbearing age in North Sumatra. The
differentials are examined according to socio-economic background of the respondents, based on various criteria such as place of residence, educational attainment, work status, religion, ethnicity, marital status, age at first marriage and use of family planning. The main findings are that fertility is lower for urban women, working women and Christian women. The main reasons for these differences appear to be the higher education levels and later ages at marriage for such women. Regionally, fertility was highest in the Moslem areas of Langkat and South Tapanuli and
lowest in Karo, where Christianity is predominant.
Overall, however, the fertility level in this province is still high. The high fertility level is a result of a high proportion of fecund married women, a low divorce rate, high value of children and strong
partilineal system (which encourages couples to continue having children until they get sons). Recently the expansion of education, rising age at marriage and the practice of family planning have contributed in a
LIST OF TABLES
Page Table
1.1. Official Population of North Sumatra 1961-1980 2
1.2. Annual Population Growth Rates for North 3
Sumatra, 1920-1980
1.3. Number of population and density (persons per 4
Km^) by Municipality/Regency in North Sumatra 1961, 1971 and 1980
1.4. Percentage of urban and rural population as 5
well as area by d i s t r i c t in North Sumatra Province in 1980
2.1. Mean number o f children ever born to ever 18
married women aged 45-49 years by region of Indonesia: Census 1971 and F e r t i l i t y
Mortality Survey 1973
2.2. Average number of children ever born to ever 19
married women by age and place of residence in North Sumatra in 1971
2.3. Age-standardized average number of children 19
ever born to ever married women aged 15-49 years by place of residence, education and work s t a t u s in North Sumatra Province in 1971
2.4. Percentage d i s t r i b u t i o n of ever married women 23
by age and education in North Sumatra Province in 1971
2.5. Average number of children ever born to ever 25
married women by age and education in North Sumatra Province in 1971
2.6. Average number of children ever born to ever 28
married women by age and work s ta tu s in North Sumatra Province in 1971
2.7. Average number of children ever born to ever 32
married women by age and r e l i g i o n in North Sumatra in 1971
2.8. Average number of children ever born to ever 33
married women by age and municipality in North Sumatra Province in 1971
2.9. Average number of children ever born to ever 34
LIST OF TABLES (CONT.)
2.10. Average number of children ever born to ever 37
married women aged 15-49 years by Kabupaten/ ethnic group/religion in North Sumatra Provinee
2.11. Age-standardized average f e r t i l i t y d i f f e r e n t i a l s 38
in 1971.
3.1. Average number of children ever born to ever 45
married women by age and age a t f i r s t marriage in North Sumatra Province in 1980.
3.2. Average number of children ever born to ever 45
married women by age and age a t f i r s t marriage in urban areas of North Sumatra Province in 1980
3.3. Average number of children ever born to ever 45
married women by age and age a t f i r s t marriage in rural areas of North Sumatra Province in 1980
3.4. Average number of children ever born to ever 46
married women by age a t f i r s t marriage and education in North Sumatra Province in 1980
3.5. Average number of children ever born to ever 46
married women by age a t f i r s t marriage and education in urban areas in 1980
3.6. Average number of children ever born to ever married 46
women by age and education in rural areas of North Sumatra Province in 1980
3.7. Budget of family planning in Indonesia from 1968 49
to 1982 in millions of U.S. d o l l a r s .
3.8. Projection of selected age groups of the Indonesian 49
population in 2001.
3.9. Percentage d i s t r i b u t i o n of c u rr e n t ly married women 54
by age and contraceptive use in North Sumatra Province in 1980
3.10. Percentage d i s t r i b u t i o n of c u rr e n t ly married women 54
by age and contraceptive use in urban areas of North Sumatra Province in 1980
3.11. Percentage d i s t r i b u t i o n of cu rr e n t ly married women 54
by age and contraceptive use in rural areas of North Sumatra Province in 1980
3.12. Average number of children ever born to cu rre nt ly 56
LIST OF TABLES (CONT.)
3.13. Average number of children ever born to cu rre nt ly 56
married women by age and co ntr aceptive use in urban areas of North Sumatra Province in 1980
3.14. Average number of children ever born to cu rre nt ly 56
married women by age and co ntraceptiv e use in rural areas of North Sumatra Province in 1980
3.15. Percentage d i s t r i b u t i o n of c u rr e n t ly married 58
women by methods of contraception (formerly used and cu rre n tly using) and place of residence in North Sumatra Province in 1980
3.16. Average number of children ever born to cu rre nt ly 58
married women by methods of contraception
LIST OF APPENDICES AND MAPS
Appendix Page
A Method o f S t a n d a r d i z a t i o n f o r 1971 P o p u l a t i o n Census
76
B Method o f S t a n d a r d i z a t i o n f o r 1980 P o p u l a t i o n Census
76
C P e r c e n t a g e o f c u r r e n t u s e r s from m a r r i e d women aged 15-44 y e a r s , u s i n g modern
c o n t r a c e p t i v e s bet wee n 1970 and 1979 i n I n d o n e s i a by p r o v i n c e
77
Map
1. I n d o n e s i a 78
CHAPTER ONE
INTRODUCTION
1 . 1 . The Area of t h e Study
1 . 1 . 1 . General Fe a t u r e s
The f ocus o f t h i s st udy i s North Sumatra Pr o v i n c e , one of
27 p r ovi nc e s in I n d o n e s i a . North Sumatra b o r d e r s on t h e Speci al Region
of Aceh and Sumatra S t r a i t t o t h e n o r t h and e a s t , West Sumatra and Riau
Pr ovi nce t o t he sout h and t h e Indones i an ocean t o t h e west ( s e e Map 1) . *
The b o r d e r s of each m u n i c i p a l i t y and regency can be seen in Map 2. North
Sumatra i s l o c a t e d in t h e n o r t h e r n p a r t of Sumatra I s l a n d , and l i e s
between 1 degree and 4 degr ees n o r t h l a t i t u d e , and between 98 degrees
and 100 degr ees e a s t l o n g i t u d e . The a r e a i s 72, 913 squar e k i l o m e t e r s ,
about 3. 72 p e r c e n t o f t he t o t a l I ndones i an a r e a o r about one t h i r d t h e
s i z e of V i c t o r i a , t he s m a l l e s t S t a t e in mai nl and A u s t r a l i a . The h i g h e s t
p l a c e i s Se r i bu Dolok, 1418 met ers above sea l e v e l . Medan, t he c a p i t a l ,
i s onl y 14 me t e r s above sea l e v e l . Thi s p r o v i n c e c o n s i s t s of s i x
m u n i c i p a l i t i e s and el even r e g e n c i e s , 182 s u b - d i s t r i c t s and 5, 636 v i l l a g e s
(CBS, 1980b: 7) .
From a p h y s i ca l vi e wpoi nt t h e p r o v i n c e can be d i v i d e d i n t o t he
l owland and t he upl and p l a i n . The c o a s t a l l owl and a r ea c over s most of
t h e e a s t e r n c o a s t , such as Tanjung Pur a, e a s t e r n p a r t o f Medan, Tebing
Ti nggi and Asahan. The u n d u l a t i n g l owl and p l a i n c over s t h e a r e a between
Medan and Pancur Bat u, Bohorok, S i b o l a n g i t , Pematang S i a n t a r and Harapan
Ganjang. The upl and p l a i n cover s t he a r e a o f Humbang, Toba ( i n c l u d i n g
Lake Toba, B a l i g e , Loguboti and P o r s e a ) , and Karo. The aver age
and maximum temperatures range between 14° and 24° centigrade.
For the lowland plain the temperature is a minimum of 14° and a
maximum of 32°, while the average is 23° centigrade. This province
is considered as a rainy or wet area with an average r a i n f a l l of
about 2,030 mm annually (Department of Agriculture Province of
North Sumatra, 1976:4-10).
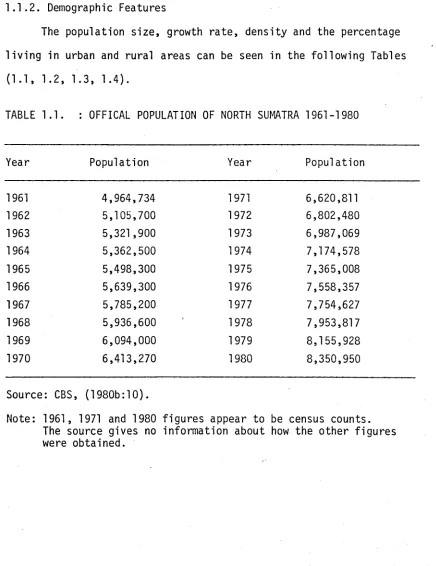
1.1 .2. Demographic Features
The population si z e, growth r a t e , density and the percentage
l iv in g in urban and rural areas can be seen in the following Tables
(1.1, 1.2, 1.3, 1.4).
TABLE 1.1. : OFFICAL POPULATION OF NORTH SUMATRA 1961-1980
Year Population Year Population
1961 4,964,734 1971 6,620,811
1962 5,105,700 1972 6,802,480
1963 5,321,900 1973 6,987,069
1964 5,362,500 1974 7,174,578
1965 5,498,300 1975 7,365,008
1966 5,639,300 1976 7,558,357
1967 5,785,200 1977 7,754,627
1968 5,936,600 1978 7,953,817
1969 6,094,000 1979 8,155,928
1970 6,413,270 1980 8,350,950
Source: CBS, (1980b:10).
[image:12.551.87.523.250.816.2]The growth r a t e was above 2 p e r c e n t from 1920 u n t i l 1980 e x c e p t
d u r i ng 1930-1961. Thi s e x c e p t i o n i n c l u d e d t h e p e r i o d o f t h e Second
World War and t h e s u b se q ue n t independence s t r u g g l e in I n d on e si a
(1941- 1949). As a consequence o f t h e s e e v e n t s , many people d i e d and
many o t h e r s pro b ab ly m i g r a t e d t o o t h e r p a r t s o f I n d o n e s i a .
TABLE 1 . 2 . : ANNUAL POPULATION GROWTH RATES FOR NORTH SUMATRA,
1920-1980
Year P o p u l a t i o n Growth Rate
1920 2,133, 137 2.41
1930 2 , 714, 924 1 .95
1961 4 , 9 64 , 73 4 2.88
1971 6,620,811 2.58
1980 8 , 3 5 0 , 95 0
Sour ce: For 1920 C e nt r aa l Kantoor Voor De S t a t i s t i e k in Ne derl ands ch - I n d i e , 1928:17-18.
For 1930, C e n t r a a l Kantoor Voor De S t a t i s t i e k in Nederl andsch - I n d i a , 1931:13.
For 1961, 1971 and 1980, see Ta bl e 1 . 1 .
Notes: In 1920 and 1930 North Sumatra P r o v i n c e c o n s i s t e d of Gouvernement O o s t k u s t Van Sumatra and R e s i d e n t i e (qewest) T a p a n o e l i .
Method o f growth r a t e c a l c u l a t i o n , s ee J a i n ( 1 9 7 9 : 4 7 , 4 8 ) .
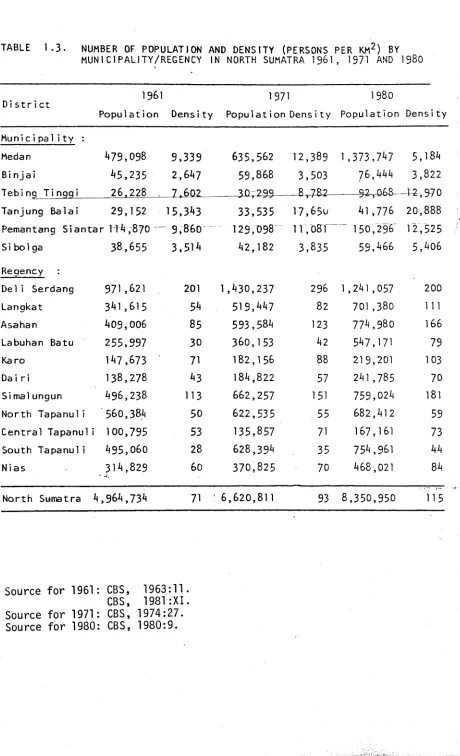
Table 1 . 3 . shows t h e i n c r e a s e in p o p u l a t i o n , f o l l ow ed by t h e i n c r e a s e
in d e n s i t y from 1961 t o 1980. An unusual t h i n g o c c u r r e d in Medan where
t h e d e n s i t y d e c r e a s e d w hi le t h e t o t a l p o p u l a t i o n i n c r e a s e d from 1971 t o
1980. This happened because in 1974 Medan was extended by t h e Government
from 51 t o 266 sq kms and a p a r t of t h e l a nd was d e r i v e d from
t h e regency o f Deli Serdang. In I n d o n e s i a , t h e a r e a o f m u n i c i p a l i t i e s ,
r e g e n c i e s and p r o v i n c e s can be changed. For example, b e f o r e 1950
TABLE 1 . 3 . NUMBER OF POPULATION AND DENSITY (PERSONS PER KM2 ) BY MUNICIPALITY/REGENCY IN NORTH SUMATRA 19 61 , 19 71 AND 1 9 8 0
D i s t r i c t
1961
P o p u l a t i o n D e n s i t y
1971
P o p u l a t i o n D e n s i t y
1 980
P o p u l a t i o n D e n s i t y
M u n i c i p a 1 i t y :
Medan '»7 9 , 0 9 8 9 , 3 3 9 6 3 5 , 5 6 2 1 2 , 3 8 9 1 , 37 3 , 7 ' »7 5 , 181»
B i n j a i ' » 5 , 2 3 5 2 , 6 ^ 7 5 9 , 8 6 8 3 , 5 0 3 7 6 , 4 4 4 3 , 8 2 2
T e b i n q T i n g q i 2 6 , 2 2 8 7 , 6 0 2 ___ 3 0 , 2 9 9 - - - 8 ^ - 7 8 2 - --- 92-, 068 1 2 , 9 7 0 T a n j u n g B a l a i 2 9 , 1 5 2 1 5 , 3 ^ 3 3 3 , 5 3 5 1 7 , 6 5u 41 , 7 7 6 2 0 , 8 8 8 Pemant ang S i a n t a r 1 1 4 , 8 7 0 9 , 8 6 0 1 2 9 , 0 9 8 11, 081 1 5 0 , 2 9 6 1 2 , 5 2 5
Si b o l ga 3 8 , 6 5 5 3,51^» 4 2 , 1 8 2 3 , 8 3 5 5 9 , '»66 5 , 4 0 6
Regenc y :
D e l i S e r d a n g 9 7 1 , 6 2 ] 201 1 , ' » 3 0 , 2 3 7 296 1 . 2 4 1 , 0 5 7 200
L a n g k a t 3*»l , 6 1 5 54 5 1 9 , '»'»7 82 7 0 1 , 3 8 0 1 1 1
A s a h a n 4 0 9 , 0 0 6 85 5 9 3 , 5 8 6 123 77'», 980 166
L a b u h a n B a t u 2 5 5 , 9 9 7 30 3 6 0 , 1 5 3 42 547, 17 1 79
Ka r o 1'»7 , 673 71 1 8 2 , 1 5 6 88 219, 20 1 1 03
Da i r i 1 3 8 , 2 7 8 43 1 8 4 , 8 2 2 57 2 4 1 , 7 8 5 70
Si mal ungun 4 9 6 , 2 3 8 113 6 6 2 , 2 5 7 151 759,02'» 181
N o r t h T a p a n u l i 5 6 0 , 3 8 4 50 6 2 2 , 5 3 5 55 6 8 2 , 4 1 2 59
C e n t r a l T a p a n u l i 1 0 0 , 7 9 5 53 1 3 5 , 8 5 7 71 167,161 73
S o u t h T a p a n u l i 4 9 5 , 0 6 0 28 6 2 8 , 3 9 4 35 7 5 4 , 9 6 1 44
N i a s 3 1 4 , 8 2 9 60 3 7 0 , 8 2 5 70 4 6 8 , 0 2 1 84
N o r t h S u m a t r a 4 ,96'», 73^ 71 ’ 6 , 6 2 0 , 8 1 1 93 8 , 3 5 0 , 9 5 0 115
Source f o r 1961: Source f o r 1971: Source f o r 1980:
[image:14.551.60.520.72.828.2]This condition influences the number of population and the population
density at the provincial le vel.
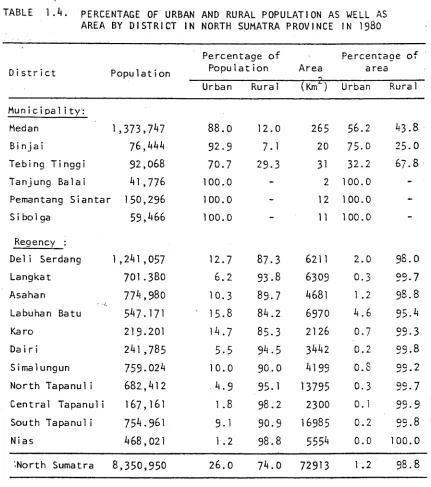
In North Sumatra as well as in other parts of Indonesia and many
developing countries, the percentage of people who liv e in urban areas
is much smaller than rural areas. In th is province 26 percent of the
population liv e in urban areas which cover 1.2 percent of the total
area (see Table 1.4).
TABLE 1 . 4 . PERCENTAGE OF URBAN AND RURAL POPULATION AS WELL AS
AREA BY DISTRICT IN NORTH SUMATRA PROVINCE IN 1980
D i s t r i c t P o p u 1 a t i o n
P e r c e n t a g e o f
P o p u 1 a t i o n A r e a
Q
P e r c e n t a g e o f a rea
Ur ban Rura 1 (Km") Urban Rura 1
M u n i c i p a l i t y :
Medan 1, 373, 7* 47 8 8 . 0 1 2 . 0 265 5 6 . 2 4 3 . 8
B i n j a i 7 6 , 4 4 4 9 2 . 9 7. 1 20 7 5 . 0 2 5 . 0
T e b i n g T i n g g i 9 2 , 0 6 8 7 0 . 7 2 9 - 3 31 3 2 . 2 6 7 . 8
T a n j u n g Ba1 a i *4l , 7 7 6 1 0 0 . 0 - 2 1 0 0 . 0
-Pemantang S i a n t a r 1 5 0 , 2 9 6 1 0 0 . 0 - 12 1 0 0 . 0
-S i b ol ga 5 9 , ^ 6 6 1 0 0 . 0 - 1 1 1 0 0 . 0
-Regency :
D e l i Se r da n g 1 ,21)1 ,057 1 2 . 7 8 7 . 3 621 1 2 . 0 9 8 . 0
L a n g k a t 7 0 1 . 3 8 0 6 . 2 9 3 . 8 6309 0 . 3 9 9 . 7
Asahan 77*4,980 1 0 . 3 8 9 . 7 4681 1 .2 9 8 . 8
Labuhan Bat u 5 ^ 7 . 1 7 1 1 5 . 8 8 4 . 2 6970 4 . 6 95.14
Ka r o 2 1 9 . 2 0 1 1 4 . 7 8 5 . 3 2126 0 . 7 9 9 . 3
Da i r i 2 4 1 , 7 8 5 5 . 5 9 4 . 5 3442 0 . 2 9 9 . 8
S i ma 1 ungun 7 5 9 . 0 2 4 1 0 . 0 9 0 . 0 14199 O.S 99 - 2
N o r t h Tapanu 1 i 6 8 2 , 4 1 2 4 . 9 95.1 13795 0 . 3 9 9 . 7
C e n t r a l T a p a n u l i 167, 16 1 1 .8 9 8 . 2 2300 0.1 9 9 . 9
S o u t h T a p a n u l i 7 5 4.961 9.1 9 0 . 9 I 6985 0 . 2 9 9 . 8
N i a s 4 6 8 , 0 2 1 1 . 2 9 8 . 8 555*4 0 . 0 1 0 0 . 0
■North S umat r a 8 , 3 5 0 , 9 5 0 2 6 . 0 7 4 . 0 72913 1 .2 9 8 . 8
[image:15.551.72.503.257.744.2]The study of population in Indonesia has focussed p r i n c i p a l l y on
Java. The problem of over population on t h i s island seems to have
monopolized the a tt e n t i o n of most demographers, with the r e s u l t t h a t
many fasci na tin g areas have s t i l l not been touched. North Sumatra is
one of these areas. I t has one of the highest leve ls of f e r t i l i t y
compared with the other provinces of Indonesia (Cho, e t a l , 1976:1-2;
Pelawi, 1976:21-23; McDonald, 1976:6 Table 3 .1 ) . In 1967-1979, the
Total F e r t i l i t y Rate for North Sumatra was 7.04; while i t was 6.44 for
Sumatra and 5.52 for Indonesia.
1.2 The Sources of the Data
Due to the data being very limited fo r ~ th r s province, the^main data
9ource used for t h i s t h e s is is the 1971 Population Census. A more recent
census was conducted in 1980, but the computer tape is not yet a v a i l a b l e , so
analysis is limited to published data, such as the special f e r t i l i t y
t a b l e s , which will be used in chapter th r e e . The 1961 population census
was the f i r s t one conducted by the Government, but because of the social
disruption of t h a t time only r e l a t i v e l y simple tables were made of the
population by age and sex in most provinces. Regarding the 1971
and 1980 population censuses, i t is important to point out a number of
f ac ts (McDonald 1983):
(1) The 1971 and 1980 Population censuses were conducted
by the Central Bureau of S t a t i s t i c s (CBS), under the
a u th or ity of the Census Law No. 6, 1960; Government
Decree No. 29, 1970; Pre sidential Order No. 2, 1970;
and Presidential Order No. 16, 1979.
(2) The 1971 and 1980 Population censuses were conducted
throughout the geographical t e r r i t o r y of the Republic
of Indonesia and covered all in dividuals residing
(3) The 1971 and 1980 Censuses employed a combination o f the de ju re and de facto methods o f enumeration.
(4) Topics covered in the 1971 and 1980 censuses were geographic, in d iv id u a l, economic and housing c h a r a c te r is tic s . In the 1980 census questions on age at f i r s t marriage and
fa m ily planning were added.
(5) The 1971 and 1980 census samples were 3.8 percent and 5 percent re s p e c tiv e ly o f the t o t a l population, and the censuses were designed to produce repre senta tive samples f o r each province.
(6) The 1971 Census was held from 6 September to 4 October 1971, w hile 1980 Census was from 6 to 31 October 1980. The o f f i c i a l census dates were 24 September 1971 and 31 October 1980 re s p e c tiv e ly .
Some questions and d e f in it io n s o f the 1971 census are stated here because they are important f o r the analyses in the next chapter:
Urban D e f i n i t i o n :
(1) An urban area is one where more than 50 percent o f the working population are engaged outside the a g r ic u ltu r a l
sector.
(2) The area has f a c i l i t i e s o f h o s p ita l, school and e l e c t r i c i t y . Educational Attainment
Can you read and write in Latin characters? I f "no" can you read and write in any other characters?
- Arabic - Chinese - Others
What level of schooling did you finis h?
- No School
- Not Yet Finished Elementary - Elementary School
- General Junior High School - Special Junior High School - General Senior High School - Special Senior High School - Academy
- University
Are you s t i l l attending school?
- Yes - No
Work Status
(1) Working persons:
a. Persons who, during the week preceding the enumeration,
worked for pay or p r o f i t , with a duration of a t l e a s t 2 days
b. Persons who, during the week before enumeration were not
a t work for a t l e a s t two days, but they are:
- Permanent workers, e i t h e r government or private
employees, who were not a t work due to vacation, i l l n e s s ,
s t r i k e , absence, and so on.
- Agricultural operators who are waiting for the
harvest time or r a i n f a l l to operate t h e i r land.
- Persons engaged in professional jobs such as physicians,
h a ir d r e s s e r s , barbers, and so on.
(2) Non working persons included those looking for work, attending
The q u e s t i o n s are as f o l l o w s :
What was y o u r usual a c t i v i t y d u r i n g t h e l a s t week? - Working
- Looking f o r work - Went t o school - Housekeeping - R e t i r e d - Ot he r
In t h i s work were you an own-account w o r k e r , employer, employee o r unpaid f a m i l y worker?
- Own account wo rker - Employer
- Employee
- Unpaid f a m i l y wo rker
R e l i g i o n
T h i s i s d e f i n e d as o n e ' s b e l i e f i n a s u p e r n a t u r a l power. The q u e s t i o n i s :
What r e l i g i o n do you f o l l o w ? - Moslem
- C a t h o l i c i s m - P r o t e s t a n t - Other C h r i s t i a n - Hinduism
- Buddhism - Confuci us - Other
Ever m a r r i e d women
Women whose m a r i t a l s t a t u s a t t h e t i m e o f enumeration i s e i t h e r m a r r i e d , d i v o r c e d o r widowed.
C h i l d r e n ev er born
Babies who show si gns o f l i f e a f t e r d e l i v e r y .
The f e r t i l i t y measure used in t h is study is the average number o f c h ild re n ever born to ever married women aged 15-49 years. The average f e r t i l i t y le v e ls have been standardised to elim in ate the
in flu e n ce o f d i f f e r e n t age s tru c tu re s , but the f e r t i l i t y level o f
women age 45-49 w i l l be also used as an in d ic a to r o f completed f e r t i l i t y .
1.3. Q u a lity o f the data
The q u a lit y o f the data depends on many fa c to rs th a t should be taken in to account, such as:
(1) Survey design, sampling design and sample se le c tio n . (2) The organization of census a c t i v i t i e s , and the q u a lit y
o f the enumerators.
(3) R e l i a b i l i t y o f respondent's answers.
(4) V a l i d i t y o f the questions - - some questions in the census cannot be answered by the respondents.
Even though improvements in the data have been made a t several stages, such as in the enumerator's re p o rt, ta b u la tio n , coding, e d itin g and
im putation, some weaknesses are s t i l l evident. For example, when the 1971 census was conducted, around 37 percent o f the population o f Indonesia was s t i l l i l l i t e r a t e (no scho oling ), and the re fo re the r e l i a b i l i t y
o f those respondents' answers to the census questions is probably lim it e d . Thus i t is to be expected th a t some inco nsisten cies w i l l be found in
ta b u la tio n s based on such data, but t h is is not unusual f o r developing c o u n trie s.
In s p ite o f these problems, i t is possible to make some adjustments to the data, p a r t i c u l a r l y f o r age, to make them seem more reasonable. However, the w r i t e r prefers to use "semi-smoothed" data ra th e r than
age heaping w i l l disappear. A f t e r using the semi-smoothing techniques many features remain, such as age heaping, the unusual age-structure of
respondents, the pattern o f f e r t i l i t y by age groups, and so on. These problems should be recognised by demographers so t h a t improvements can be made in the fu t u re censuses.
1.4. Purpose o f the study
The purpose o f t h i s study is to describe and analyse data on population f o r the province o f North Sumatra. S p e c i f i c a l l y i t seeks to f i n d out:
(1) The f e r t i l i t y d i f f e r e n t i a l s based on rural-urban residence, educational attainment, work status, r e l i g i o n , d i s t r i c t o f residence, and e t h n i c i t y .
(2) The influence o f age at f i r s t marriage and fa m ily planning on the f e r t i l i t y of the women in t h i s region.
1.5. Hypotheses
Some hypotheses are stated in t h i s study to guide and focus the analysis of some of the variables:
(1) The f e r t i l i t y level of urban areas is lower than in rural areas
(2) There is a negative r e l a t i o n between education and f e r t i l i t y (3) The f e r t i l i t y of working women is lower than nonworking
women
(4) The f e r t i l i t y of Christians is higher than Moslems.
1.6. Scope o f the Study
The re s t of t h i s study is divided in to three chapters. Chapter
CHAPTER TWO
FERTILITY DIFFERENTIALS
2.1. Socio-economic Conditions
Many studies have noted the s i g n if ic a n c e o f the r e l a t i o n between f e r t i l i t y and socio-economic con ditions. In the demographic t r a n s i t i o n , es pe ci all y in the ea rly phase, Kiser (1971: 1930-1931) found a p o s i ti v e r e l a t i o n between f e r t i l i t y and economic stat us. A p o s i ti v e r e l a t i o n was also found by Innes and Kiser in England and the United States in the beginning o f the 20th Century (Hawley, 1950: 118-119). In the l a t e r stages of the t r a n s i t i o n , Jones (1977:6) explained th a t the decline in f e r t i l i t y in Europe was associated wi th economic development and r i s i n g per capita income. In t h i s phase, the r e l a t i o n between f e r t i l i t y and socio-economic status (income) is negative. Nowadays, esp ecia lly
in developed countries, the r e l a t i o n tends to be negative, which means tha t people who have higher standards o f l i v i n g have lower f e r t i l i t y compared with those who l i v e in poor c o n di ti on s.
Many in d ic a to r s can be used to determine socio-economic conditions such as urban-rural residence, education, work, status and r e l i g i o n . For more de ta il on aspects of each i n d i c a t o r , i t i s useful to have a description o f socio-economic conditions in North Sumatra.
composition of these export commodities in 1977 was as follows: rubber, 37.6 percent; palm o i l , 30.4 percent; coffee, 12.3 percent; tobacco, 3.3 percent; and others, 16.4 percent. The composition of the regional income for this area in 1974 was agricultural sector 40.2 percent, trade 24.5 percent, manufacturing 10.0 percent and others 25.3 percent. In the same year (1974) the income per capita in North Sumatra was US$250, which was about 25 percent higher than the national average of US$201 (Local Government Province of North Sumatra,
1976:20-21, 28-30).
For administrative purposes the province is divided into six municipalities which are mainly urban, and eleven regencies, which are
regarded as mainly rural (see Table 1.4.). According to census figures,
the percentage of urban population in this province was 16.9 percent in 1961, 17.2 in 1971 and 25.5 percent in 1980 (Milone, 1966: 169; Sigit and Sutanto, 1982: 33), but only about 1 percent of the total land area is regarded as urban.
The major educational f a c i l i t i e s at the te rtiary level are
concentrated in the capital city, while the towns and capitals of regencies have junior and senior high schools. Primary schools are scattered
throughout the villages. In Indonesia (and thus in North Sumatra) education is divided into five levels: (i) primary school (six years)
beginning at age seven; (i i ) junior high school (three years); ( i i i ) senior high school (three years); then (iv) academy (three years); or (v)
university (five years). Education levels reflect this urban concentration
As in other parts of Indonesia, the livelihood of most families is dependent on agriculture. Most people eat rice as their main food. The total production of rice in 1980 was 1,641,328 tons, while the average per capita consumption was 2.7 kilograms per week (CBS, 1980b:
288,372). Manning (1982:9,51) found that in Indonesia in 1980, 61 percent of the population was engaged in agriculture, compared with 74 percent in Thailand, 51 percent in the Philippines, 36 percent in South Korea, 11 percent in Japan, 9 percent in France and 6 percent
in West Germany. According to Manning, one indicator of whether a country has already developed or not is the proportion or labour force engaged in the manufacturing and services sector. The higher the proportion of the population involved in those two sectors the more development has been achieved by the country and vice versa.
In 1975 the composition of religion was as follows: Moslems, 60 percent; Christians, 33 percent; other groups, 7 percent (Local Government Province of North Sumatra, 1976: 641). The composition of religion for each municipality and regency varied from one d i s t r i c t to another. Pematang Siantar was the only municipality where there was a Christian majority, and there were six regencies where the number of Christians exceeded Moslems. The Christian population comprised 53 percent of the total in Pematang Siantar, 51 percent in Karo, 78 percent in Dairi, 51 percent in Simalungan, 95 percent in North Tapanuli, 52 percent in Central Tapanuli and 92 percent in Nias. In other municipalities and regencies the percentage of Moslems exceeded Christians (Department of Agriculture Province of North Sumatra, 1976: Population Chapter; and Local Government Province of North Sumatra, 1976: Regional Chapter).
1974, the minimum age at marriage in Indonesia fo r boys is 19 years,
and fo r g ir ls is 16 years (Atmosiswoyo, 1978:31). Most couples in
North Sumatra try to have children soon a fte r marriage, th is is because
they consider children to be the best guarantee fo r preventing
marital disruption. Couples with no children feel unhappy, and th e ir
marriage is lik e ly to be terminated.
Marriage in North Sumatra is according to trib a l law, relig iou s
law and/or c iv il law. The least lik e ly form of contract is c iv il law.
Sometimes the marriage performed is a combination of trib a l and religious
law. Couples who marry under c iv il law usually do so because the marriage
cannot be performed by trib a l or re lig io u s law. There are a number of reasons
why th is might be so: i f eith e r one side or both sides of the couple's
parents do not agree to the marriage; i f the couple practice d iffe re n t
re lig ion s while the contract is being made; or i f the couple marry
against the trib a l or relig iou s law, fo r example i f the partners are
Bataks with the same family name, in which case the woman would be regarded
as the man1s s is te r .
Normally each marriage has its own bride price. The value of th is
bride price depends on the socio-economic status of the bride's parents.
I f the g ir l comes from a wealthy fam ily, the bride price w ill be higher
than i f she comes from a poor fam ily.
One type of marriage s t i l l encouraged by the Batak groups is
parentally-arranged "cross-cousin" marriage (Bruner, 1959: 119). The idea
behind cross-cousin marriage is to make the fam ily tie s stronger and
to keep the property w ithin the fam ily. The advantage of th is type of
marriage is that both sets of parents w ill support and help the couple
Al Hadar (1977: 10) commented on two special types of marriage in Indonesia, "levirat" and "sororat". Levirat marriage refers to the marriage of a woman whose husband is dead and who automatically becomes the wife of her husband's brother, while sororat is the marriage of a widower to
his dead wife's s is te r. In North Sumatra these types of marriage s t i l l occur among Batak people, although nowadays, some persuasion may be needed to accept the new husband in the levirat or the new wife in the sororat system.
The other thing which is regarded as "unique" in this society is that marriage is prohibited between people who have the same family name. For example, if a boy and a girl who were born in different places meet each other in another place and there is no relationship between the two families, they cannot marry each other if they have the same family name. According to tribal law they are in a "sister" relationship (Singarimbun, 1975: 147, 148).
2.2. Urban-rural Differentials
In most countries the definition of urban is changing all the
time, and even at the international level there is no standard definition. A United Nations (1980:68) report states:
. . . b eca u se o f n a tio n a l d i f f e r e n c e s in th e c h a r a c t e r i s t i c s t h a t d i s t i n g u i s h urban from r u r a l a r e a s 3 th e d i s t r i b u t i o n betw een urban and r u r a l p o p u la tio n i s n o t y e t amenable to a s i n g l e d e f i n i t i o n t h a t would be a p p lic a b le to a l l c o u n tr ie s j n or even 3 f o r th e m ost p a r t 3 to th e c o u n tr i e s w ith in th e r e g io n . Vlhere th e r e a re no r e g io n a l recom m endations on th e m a tte r 3 c o u n tr i e s m ust e s t a b l i s h t h e i r own d e f i n i t i o n s in accordance w ith t h e i r own n eed s. The t r a d i t i o n a l d i s t i n c t i o n betw een urban and r u r a l area w ith in th e c o u n try has been b a sed on th e a ssu m p tio n t h a t urban a r e a s 3 no m a tte r how th e y a re d e fin e d 3 p ro v id e a d i f f e r e n t way o f l i f e and u s u a lly a h ig h e r l e v e l o f l i v i n g than i s fo u n d in r u r a l a r e a s .
Heer (1975: 64) stated th a t the pattern o f lower f e r t i l i t y in urban areas compared w ith ru ra l areas is considered to be one o f the demographic g e n e ra liz a tio n s . In most c o u n trie s , includ ing developing c o u n trie s , the f e r t i l i t y o f urban areas is lower than ru ra l areas. However, McDonald et a l . (1976: 6, Table 3.1) found th a t in Indonesia the f e r t i l i t y o f urban and ru ra l areas varied from one island to another. For West Java and Central Java, urban f e r t i l i t y was lower, but f o r Sumatra the pa ttern was the reverse (see Table 2 .1 ).
TABLE 2.1. MEAN NUMBER OF CHILDREN EVER BORN TO EVER MARRIED WOMEN AGED 45-49 YEARS BY REGION OF INDONESIA: CENSUS 1971 AND FERTILITY MORTALITY SURVEY 1973.
Regi on Cens us 1971 F - M Sur vey 1973
Urban Ru ra 1 Urban Ru ra 1
Suma t ra 6 . 3 5 . 8 6 . 6 6. 1
Su1 awesi 5 . 6 5 . 6 5 . 9 6 . 3
West Java 5 . 0 5 . 3 5 . 2 5 . 5
C e n t r a l Java ' 4 , 2 4 . 8 4 , 9 4 . 2
East Java 3 . 9 3 . 9 4. 1 4 . 0
Bal i - 4 . 9 - 6 . 0
Sour ce: McDonal d, e t al , 1976: 6 , T a b l e 3 . 1 .
In North Sumatra, the 1971 census re s u lts in d ic a te th a t the f e r t i l i t y o f ever married ru ral women was higher than f o r urban women in the middle age groups and lower f o r the younger and o ld e r age groups (Table 2 .2 .) For a l l women together, a f t e r standardizing f o r age, the f e r t i l i t y
of urban women (4.6) was s l i g h t l y lower than f o r ru ra l women (4 .8 ). This may be explained by the b e tte r l i v i n g co n dition s in urban areas such as
TABLE 2 . 2 . : AVERAGE NUMBER OF CHILDREN EVER BORN TO EVER MARRIED WOMEN BY AGE AND REGION IN NORTH SUMATRA PROVINCE IN 1971
Age g r o u p R e g i o n
U r ba n R u r a l
15 - 19 1 .0 0 . 9
20 - 24 2 . 0 2 . 1
25 - 29 3 - 4 3 - 9
30 - 3 k 5 . 0 5 - 3
35 - 39 6 . 4 6 , 5
40 - 44 6 . 9 6 . 8
1)5 - 1)9 7 . 0 6 . 6
15 - 49 4 . 9 4 , 7
S t a n d a r d i z e d 4 . 6 4 . 8
S o u r c e : T a b u l a t e d f r o m t h e s u b s e t o f 1971 c e n s u s r e c o o e d t a p e . N o t e : Met hod o f s t a n d a r d i z a t i o n , see A p p e n d i x A.
As m e n t i o n e d above CChap.2 , S e c . l ) , e d u c a t i o n f a c i l i t i e s a r e
c o n c e n t r a t e d i n urban a r e a s , i n t h e c a p i t a l s o f p r o v i n c e s and r e g e n c i e s . T h i s s i t u a t i o n p r o v i d e s t h e ur ban women w i t h b e t t e r e d u c a t i o n w h i c h may l e a d them t o have l o w e r f e r t i l i t y . T h i s i s i n d i c a t e d i n
t h e c r o s s - t a b u l a t i o n between p l a c e o f r e s i d e n c e and e d u c a t i o n ( T a b l e 2 . 3 ) , w hi c h shows t h a t t h e f e r t i l i t y o f e v e r m a r r i e d u rban women was
l o w e r a t a l l l e v e l s o f e d u c a t i o n compared w i t h r u r a l women.
TABLE 2 . 3 . : AGE-STANDARDIZED AVERAGE NUMBER OF CHILDREN EVER BORN TO EVER MARRIED WOMEN AGED 15- 49 YEARS BY PLACE OF RESIDENCE,
EDUCATION AND WORK STATUS IN NORTH SUMATRA PROVINCE IN 1971
P l a c e o f E d u c a t i o n Work S t a t u s
r e s i d e n c e No
S c h o o l i n g
P r i m a r y & Pass
Secondary & Over
Worki ng Non
Wo rk i ng
Urban 4 . 6 4 . 8 4 . 2 4 . 2 4 . 7
Rur al 4 . 8 4 . 9 4 . 5 4 . 6 4 . 9
N 356401 545768 68949 440888 530230
There is also a tendency f or women who l i v e in urban areas to
be more involved in work a c t i v i t i e s outside the home. Such work will
consume a l o t of t h e i r time and again t h i s may influence them to have
fewer chil dren. Table 2.3 shows t h a t the f e r t i l i t y of working women was
lower than t h a t of non-working women, in urban and rural areas. I t is
l i k e l y t h a t urban non-working women have higher education l evel s than
rural non-working women, and t hi s probably causes them to delay
marriage, and as a r e s u l t , t h e i r f e r t i l i t y i s lower than f or rural
women.
Another reason why urban f e r t i l i t y is lower than rural f e r t i l i t y
could also be suggested by the emancipation of urban women who would
l i ke to have g r eat er independence. They are able to make decisions about
what i s good f or t h e i r career in the fut ure and t h i s is more l i k e l y to
influence them to have a small family. Fi nal l y, in most of the rural
areas of North Sumatra, as well as in other parts of Indonesia and in
many other developing count r i es , the l i vi ng conditions are r e l a t i v e l y
poor. Poor n u t r i t i o n of rural women probably has contributed to higher
i nf ant mor t al i t y, and as a consequence has led such women to have
a l arge family in order to insure t h a t some children survive. In 1971
the i nf ant mor t al i t y r at e in rural North Sumatra was 115 deaths per
1000 l i ve b i r t h s , while in urban areas i t was 95 (Cho, et a l . 1976: 64).
Usually women in rural areas are l ess educated, marry e a r l i e r , and have
limi ted work opport uni t i es except for housekeeping or t r a d i t i o n a l
farming. These f act or s may also cont r i but e to higher f e r t i l i t y .
In summary, i t can be s t at ed t h a t , using the age-standardized
average f e r t i l i t y , the hypothesis t hat f e r t i l i t y is lower in urban than
2.3. Educational Differentials
There is a general tendency for educated people to have small families, because children for them are more likely to be regarded
as commodities. As a consequence their f e r t i l i t y is more likely determined by cost benefit analysis, that is, the total cost of producing the
children and benefit gained by the parents from the children. In these circumstances the children are commodities competing with other
opportunities to invest family time. Fewer are "bought" when the income of educated people increases because the emphasis is on the quality of those children, not on the quantity (Jones, 1977: 12-13).
Many studies which have been done in both developed and developing countries show an inverse relation between education and f e r t i l i t y .
Heer (1971: 903) carried out a multi-variate analysis of national
differences in f e r t i l i t y among 41 nations, and determined that there was a negative relation between education level and f e r t i l i t y . Nayar (1974: 28-29) found that countries which have a high literacy rate have lower f e r t i l i t y levels than those which have a low literacy rate. In urban Egypt, Abu-Lughod (1965: 236) discovered an inverse relation between educational attainment of wives and the mean number of children ever born. In Central India, Driver (1963: 100) discovered the relation between education achieved by wives and the level of f e r t i l i t y was negative, with the average number of children ever born for
"no schooling", "primary school" and "above primary school" groups being 4.7, 4.3, and 3.4 respectively. In Thailand, Goldstein (1972: 432 Table 8) discovered that l i t e r a t e women had lower f e r t i l i t y than
i l l i t e r a t e women for both urban and rural areas. The mean number of children ever born to l i t e r a t e women in Bangkok was 3.0 while for
comparable figures were 3.7 and 4.2 and for rural women the figures were 3.8 and 4.0. Regarding birth control, Freedman (1979: 2) noted that, as soon as the literacy rate increases in developing countries the
number of family planning acceptors increases and as a consequence f e r t i l i t y declines.
In Indonesia, a study by Hull and Hull (1977: 46) based on the 1971 census data, found an inverted U-shaped relation between the level of school attainment and the mean number of children ever born. This occurred both in urban and rural areas in every age group of ever married women. In Maguwoharjo (a village near Yogyakarta in Central Java), V.J. Hull (1976) found a positive relation between educational attainment and f e r t i l i t y . However, i t is possible that the f e r t i l i t y
pattern across provinces in Indonesia could vary, because of the different quality and quantity of educational f a c i l i t i e s available in each area which may lead to differing f e r t i l i t y patterns and levels.
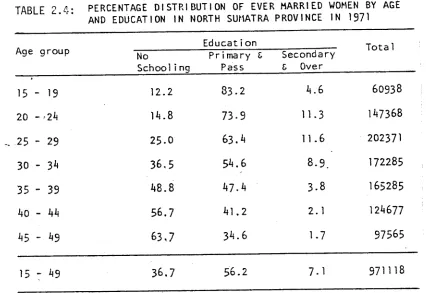
In this chapter, educational level is divided into three main groups: no schooling, primary school and pass, and secondary school and over.
The f i r s t refers to women who have never been to school. The second refers to women who have attended primary school from grade one to pass grade six, and the third includes women who have attained junior high school, senior high school, academy or university.
In North Sumatra, less than half (45%) of the ever married women in the older age groups (35 to 49 years) had any education (Table 2.4).
T A B L E 2 4* PERCENTAGE DISTRIBUTION OF EVER MARRIED WOMEN BY AGE AND EDUCATION IN NORTH SUMATRA PROVINCE IN 1971
Age group Education Tota 1
No
Schooling
Primary & Pass
Secondary & Over
15 - 19 12.2 83.2 4.6 60938
20 - -24 14.8 73-9 11.3 147368
25 - 29 25.0 63.4 11.6 202371
30 - 3^ 30.5 54.6 8.9. 172285
35 - 39 48.8 47.4 3.8 165285
40 - A4 56.7 41.2 2.1 124677
i(5 - *i9 63,7 34.6 1.7 97565
15 - ^3 36.7 56.2 7.1 971118
Source: Tabulated from the subset of 1971 Census recoded tape.
s c h o o l . T h e reas o n f o r the high p e r c e n t a g e of o l d e r w o m e n in the
"no s c h o o l i n g " c a t e g o r y is s t a t e d in Hull a n d Hull (1977: 77):
In Indonesia, as in many countries of the Third World,
few young girls in the first half of this century were likely to attend school under colonial rule. Those who did achieve some schooling, either in the government schools or in private religious schools, came almost exclusively from the wealthier inhabitants of villages and families of government employees
in the town.
U n d e r such c o n d i t i o n s , m a n y d e m o g r a p h e r s agree, w o m e n have h i g h e r
f e r t i l i t y . B u t t h o s e w o m e n w h o w e r e born a f t e r I n d e p e n d e n c e hav e a b e t t e r
life a n d t h e i r f e r t i l i t y is e x p e c t e d to d e c l i n e g r a d u a l l y w i t h i m p r o v e m e n t s
[image:33.551.67.493.103.396.2]In the same table i t can be seen that women in the younger
ages, from 15 to 34 years have much higher education levels, indicating that those born af te r Independence in 1945 had more opportunities to go to school. The percentage attending secondary school or higher was rather small, and only a small percentage of these women graduated from the Academy or University.
It should be noted that education has been developed in parts of North Sumatra since the colonial period, particularly in those areas which had Christian missions. Mauldin (1981: 38-39) noted that in 1863 Dutch missionaries began to conduct schools in Christian areas in
Indonesia, such as North Sumatra (Bataklands), North Sulawesi (Minahasa) and Ambon. In Minahasa and Ambon the schools were conducted in Dutch, while in Bataklands the schools were conducted in the Malay language or local vernacular. At about the same time, the German mission learned the local Batak dialects and taught lessons in their mission schools
in those languages. Furthermore, Mauldin (1981: 103-104) stated that in 1930 almost all the teaching was in the hands of the missionaries in North
Sumatra and in North Sulawesi. Penders (1968: 5, 95) explained that the purpose of establishing the mission schools was to educate indigenous people as well as to spread Christianity through education. The colonial government allowed the missionaries to establish elementary schools in non-Moslem areas, such as North Sumatra (Bataklands), North Sulawesi (Minahasa), West Irian, Flores and Sumba. Jones (1981: 18,22) stated:
TABLE 2.5: AVERAGE
WOMEN BY
1971
NUMBER OF CHILDREN age and e d u c a t i o n;
EVER BORN TO EVER MARRIED IN NORTH SUMATRA PROVINCE IN
E d u c a t i o n Age group
No s c h o o l ! n o P r i m a r y & Pass Secondary & Over
15 - 19 0 , 9 1 .0 0.7
20 - 24 2.4 2. 1 1 -7
25 - 29 4.1 3-8 3-0
30 - 34 5-3 5-3 4.6
35 - 39 6.4 6.5
6.1
40 - 44 6.5 7.2 6.3
45 - 49 6.3 7-3 6.8
15 - 49
S t a n d a r d i z e d
5-5 4.8
4.4 4.9
3-4 4.3
Source: T a b u l a t e d f r o m t h e s u b s e t o f 1971 Census re c o rd e d tape Note : Method o f s t a n d a r d i z a t i o n , s e e A p p e n d ix A.
As shown in Table 2.5 the f e r t i l i t y o f the women with no schooling in the older age groups was lower than f o r those in the primary and pass category. The reason may be the memory lapse of those older
women who never attended school. The age-standardized average f e r t i l i t y o f women with no schooling (4.8) is a l i t t l e lower than f o r those
in the primary and pass category (4.9) while the women in the highest education category have the lowest f e r t i l i t y ( 4 .3 ). This r e l a ti o n s h i p is found in each age group except 20-29, where there is a c lea r negative impact of education on f e r t i l i t y . Taking i n to consideration the p o s s i b i l i t y o f memory lapse or inte rview d i f f i c u l t i e s o f women who never attended
[image:35.551.55.500.97.459.2]A negative r e l a t i o n may be explained by the tendency among North
Sumatran people f or i l l i t e r a t e women to be married e a r l i e r than those
who have some education (Pelawi, 1976: 15), and e a r l i e r marriage often
leads to higher f e r t i l i t y . For t h i s reason the second hypothesis in t h i s
study ( t h a t there i s a negative r e l a t i o n between education and
f e r t i l i t y ) is accepted.
2.4. Work Status D i f f e r e n t i a l s
The r e l a t i o n between f e r t i l i t y and the work st a tu s of women l arg ely
depends on the economic, s o c i a l , c u ltu r al and psychological f act o rs which,
a f f e c t f e r t i l i t y pa tterns and l ev e ls (Kupinsky, 1977: 369). To be more
s p e c i f i c , Sa f i li o s- R o t h sc h i 1d (1977: 355) noted t h a t i f women's work
is regarded as an indication of t h e i r emancipation and s a t i s f a c t i o n ,
taking into consideration the c o n f l i c t s between work and family tas k s,
working women usually tend to decide to have small fami lie s.
Chalil (1977: 165) st ate d t h a t various researchers found an
inverse r e l a t i o n between employment and f e r t i l i t y in i n d u s t r ia l iz e d
coun tri es , whereas in developing countries the r e l a t i o n between those
two va ria ble s was changeable. In the United Sta tes working women have
lower cumulative f e r t i l i t y than nonworking women (Kupinsky, 1977: 193). In
Latin America, several st u d ie s , such as P r a t t and Whelpton (1956), Ridley
(1959), and Whelpton e t al (1966) found t h a t working wives had a smaller
family size than nonworking wives (Davidson, 1977: 343). In Central
India, Driver (1963: 94) found t h a t the f e r t i l i t y of employed wives was
lower than t h a t of unemployed wives, and the average number of children
ever born was 5.0 and 4.5 r es p ec tiv e ly . In Singapore, Chinese working
women preferred smaller families than housewives. Those working women who
had a high work commitment had lower f e r t i l i t y than those with a low
sources, Szabady (1977: 298, Table 8.9) documented th a t in Yugoslavia in 1970 the f e r t i l i t y o f dependent women (housewives) was higher than than o f economically a c tiv e women. The average number of c h ild re n ever born was 3.1 and 2.6 re s p e c tiv e ly . In Indonesia, V.J. Hull (1977: 43-44), using 1971 Census data, found th a t the average number of c h ild re n ever born to employed women ( c u r r e n tly working) was lower than to housekeeping women (nonworking) f o r a l l age groups.
The fo llo w in g analysis divide s women in to two categories, working and non-working. "Working women" includes a l l employed women (own account worker, employer, employee and unpaid fa m ily worker). "Non-working
women" includes women who are looking f o r work, housekeeping, studying in school, r e t i r e d , unable to work and o th ers. Most of the working women in North Sumatra are engaged in a g r ic u lt u r e , growing r ic e and some other crops between the two r ic e harvest periods.
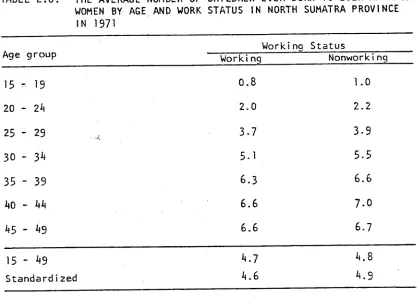
The f e r t i l i t y o f working women was lower than th a t of non-working women, a t a l l age le v e ls , and also f o r a l l women a f t e r standardizing f o r age (Table 2 .6 ). Therefore, the t h i r d hypothesis appears to be acceptable. The lower f e r t i l i t y o f working women compared w ith non working women can probably be explained by educational attainment
as working women ge nerally have higher education than do non-working women. However, the f e r t i l i t y d iffe re n ce s between working and non-working
women are clouded by the f a c t th a t many women who work in both
a g r ic u ltu r e and housekeeping were probably reported as non-working. I t is d i f f i c u l t to draw a lin e between these two a c t i v i t i e s , because the women who work in a g r ic u ltu r e also do housekeeping and vice versa.
TABLE 2.6: THE AVERAGE NUMBER OF CHILDREN EVER BORN TO EVER MARRIED WOMEN BY AGE AND WORK STATUS IN NORTH SUMATRA PROVINCE
IN 1971
Age g r o u p W o r k ! ng S t a t u s
W o r k i n g N o nw o r k i n g
15 - 19 0.8 1.0
20 - 2 k 2.0 2.2
25 - 29 3.7 3-9
30 - 3*) 5.1 5.5
35 - 39 6.3 6.6
AO - AA 6.6 7.0
1-5 - 1(9 6.6 6.7
15 - 1(9 k . l A.8
S t a n d a r d i z e d A.6 A.9
S o u r c e : T a b u l a t e d f r o m t h e s u b s e t o f 1971 cen su s r e c o d e d t a p e . N o t e : Met hod o f s t a n d a r d i z a t i o n , s e e A p p e n d i x A.
2.5. Religious D i f f e r e n t i a l s
F e r t i l i t y in the more developed countries is almost u n i v e r s a ll y lower than in the less developed countries. Coi nci de nt all y many of the more developed cou ntrie s, such as the USA, Western Europe and A u s tr a l i a are Chr ist ian (at l e a s t nominally) whereas in some high f e r t i l i t y developing countries a m a jo ri ty o f the people are Moslems.
Kirk noted a number of the reasons why f e r t i l i t y in Moslem countries is almost u n i v e r s a ll y higher than t h a t of neighbouring countries with other r e l i g i o n s :
(1) Marriage i s universal and age at marriage is low. (2) The status o f women is much lower than th a t of men. (3) Children have a r e l a t i v e l y high economic value,
[image:38.551.76.493.86.383.2](4) Polygamy is not prohibited.
(5) There is a negative attitude to some methods of contraception such as s te riliz atio n and abortion.
Freedman (1979: 6) also added that, because of their relatively low status, Moslem women tend to be less educated and segregated. In India, Chalil (1977: 154) noted that polygamy was the main reason explaining higher Moslem f e r t i l i t y . However, Gaisie found in Ghana that the f e r t i l i t y of Catholics and Protestants was higher than that of Moslems (Caldwell, 1971: 752).
In Indonesia, the f ift h most populous country in the world, the majority of the inhabitants are Moslem. In comparison with most other provinces, North Sumatra is considered to be a Christian area, but even there Moslems outnumber Christians. As noted above, about one-third
of the population are Christians, and these are concentrated in the areas where the Batak groups are predominant.
It could be argued that the f e r t i l i t y level of Christians in North Sumatra is higher than that of Moslems, because the Batak people, most of whom are Christians, have quite strong pronatalist cultural values. Furthermore, because they are a minority within Indonesia and their own province, they prefer to have a large family. This argument is put forward by a number of people, who refer to the fact that the Christian proportion of the provincial population increased by 7 percent from 1971 to 1975, while the Moslem proportion decreased 3 percent.
The high level of Christian f e r t i l i t y can also be explained from a cultural viewpoint. Castles (1974: 11) stated that Batak people in general, and particularly Batak Toba (among whom more than 90 percent are Christians), have intensively pronatalist cultural values. This is indicated by the "wish" at Toba weddings which is expressed poetically:
Laklak d i ginjang p in tu Singkoru tagolom-golom Maranak sampulu p i tu Marboru sampulu onom
The f i r s t two sentences of this saying actually have no meaning, they are just to rhyme with the next two sentences, which mean "may the couple have 17 sons (maranak sampulu pi tu) and 16 daughters (marboru sampulu onom)". This number of children has only a figurative meaning. In reality i t is never reached by Batak people or by any people in the world. But during the la st two decades, i t has been recognized that there are many couples s t i l l having around 8-10 children in this province. Castles also stated that children mean wealth. The more children a couple have, the more wealth they will obtain. When Batak people greet each other, they usually ask "How many children do you have?" By answering this question, individuals or couples cannot evade the
"poverty" of having small families.
On the other hand, i t seems that Moslems could be expected to have higher f e r t i l i t y than Christians in North Sumatra because of
lower levels of education. In addition, Moslem marriages, which are usually arranged by the parents, occur at younger ages and this also may contribute to higher completed f e r t i l i t y . The hypothesis used here, however, is that the stronger pronatalist values of the Batak groups will result in
the Christians having higher f e r t i l i t y than the Moslems.
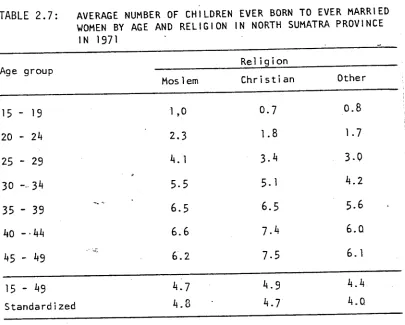
The f e r t i l i t y pattern in North Sumatra according to religious a f f i l i a t i o n can be seen in Table 2.7. The f e r t i l i t y of Christians was lower than that of Moslems in the younger ages (15 to 34 years), exactly the same in the age group 35-39, but for the la st two age groups
the reverse has occurred. Overall, the age-standardized total f e r t i l i t y of Christians (4.7) was slightly lower than for the Moslems (4.8). The
overall higher Moslem f e r t i l i t y is due to the large proportions of ever married Moslem women in the youngest age groups (82% of the married women age 15-19 being Moslem) and the higher Moslem f e r t i l i t y pattern from 15 to 34 years. Furthermore, the lower f e r t i l i t y of Moslems in the la st two age groups could be caused by memory lapse. As mentioned before,
Christians have better education than Moslems because of missionary schools. If we accept this argument, i t could be expected that the overall f e r t i l i t y of Moslem women would be higher than 4.8. Therefore using the age
standardized average f e r t i l i t y , the fourth hypothesis cannot be accepted because the f e r t i l i t y of Christians is lower than that of Moslems,
TABLE 2 . 7 : AVERAGE NUMBER OF CHILDREN EVER BORN TO EVER MARRIED WOMEN BY AGE AND RELIGION IN NORTH SUMATRA PROVINCE
IN 1971
Rel i g i o n Age g r o u p
Mos 1em C h r i s t i a n Ot h e r
15 - 19 1,0 0 . 7 0.8
20 - 2A 2 , 3 1.8 1. 7
25 - 29 k . 1 3 - A 3 . 0
30 -- 3^ 5 . 5 5. 1 A.2
35 - 39 6 . 5 6 . 5 5 . 6
AO --AA 6.6 7. A 6.0
45 - ^9 6.2 7 - 5 6.1
15 - ^9 A.7 b . 9 A.A
S t a n d a r d i z e d A.8 A.7 A.O
S o u r c e : T a b u l a t e d f r o m t h e s u b s e t o f 1971 c e n s u s r e c o d e d t a p e . Note : Method o f s t a n d a r d i z a t i o n , s e e Appendix A.
2.6 District and Ethnicity Differentials 2.6.1 Districts
There are few studies, especially of developing countries
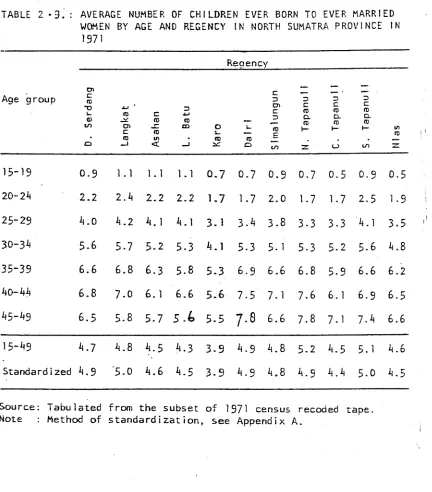
(including Indonesia), which explore d i s t r i c t f e r t i l i t y di f f e r e nt al s. Even within a country, data from the population census are usually published only down to the provincial level. In Indonesia, based on the 1971 population census (Cho et a l . 1976: 7-28), estimates have been made of f e r t i l i t y differentials among all di st r i ct s (kabupaten or regency) in Java and Madura. For the other islands, these are calculated only down to provincial level. The
[image:42.551.87.492.84.409.2]t o t a l f e r t i l i t y ra tes. The estim ation has been made from 1961 to 1970, and i t was divided in to three time periods: from 1961 to 1963, 1964 to 1966 and from 1967 to 1970. The f e r t i l i t y level was c la s s if ie d in to urban and ru ra l areas f o r a l l d i s t r i c t s . The le ve l o f f e r t i l i t y was found to vary from one d i s t r i c t to another D iv e r s ity in geography often causes d iffe ren ces in the c u l t u r a l ,
social and even economic conditions o f the in h a b ita n ts , and t h is may influence the leve l o f f e r t i l i t y in each d i s t r i c t .
TABLE 2. 8 . : AVERAGE NUMBER OF CHILDREN EVER BORN TO EVER MARRIED WOMEN BY AGE AND MUNI CI PALI TY IN NORTH SUMATRA
PROVINCE IN 1971
Age g r o u p M u n i c i p a l i t y
Medan B i n j a i T e b i n g T i n g g i
Tan j ung B a l a i
Pematang
S i a n t a r S i b o l g a
15 - 19 1.1 1 . 0 0 . 8 1 . 0 0 . 6 0 . 7
20 - 24 1 . 9 2 . 3 2 . 0 1 . 9 1. 8 1. 8
25 - 29 3 . 4 3 - 7 3 - 5 3 . 4 3 - 3 3 - 6
30 - 3^ 4 . 9 5 . 2 5 - 0 5 . 3 5. 1 - 4. 9
35 - 39 6 . 3 6 . 6 6 . 7 6 . 5 6 . 5 6 . 4
40 - 44 6 . 7 7 - 3 6 . 2 6 . 9 7 . 2 7 . 4
hs,
- 149 6 . 7 7 . 3 7 - 4 6 . 8 7 . 7 7 . 215 - k S 4 . 8 5 . 0 4 . 9 4 . 9 5 - 2 4 . 9
S t a n d a r d i z e d 4 . 5 4 . 9 4 . 7 4 . 6 4 . 7 4 . 7
Sour c e : T a b u l a t e d f r o m t h e s u b s e t o f 1971 census recoded t a p e .
[image:43.551.58.524.374.826.2]