Int. J. Electrochem. Sci., 6 (2011) 804 – 818
International Journal of
ELECTROCHEMICAL
SCIENCE
www.electrochemsci.org
Evaluation of Carbon Nanotube Paste Electrode Modified With
Copper Microparticles and Its Application to Determination of
Quercetin
A. C. Oliveira and L. H. Mascaro*
Departamento de Química, Universidade Federal de São Carlos C.P. 676, 13560-970 São Carlos, SP, Brazil
*
E-mail: [email protected]
Received: 6 January 2011 / Accepted: 29 January 2011 / Published: 1 March 2011
A carbon nanotube paste electrode modified with copper microparticles (CNTPE-Cu) was constructed and used for determination of quercetin in apple juice. The optimal content of carbon nanotubes/copper microparticles in the paste electrode was evaluated using differential pulse voltammetry, which was 6% (w/w) copper microparticles. This electrode was characterized by scanning electron microscopy (SEM) and electrochemical impedance spectroscopy (EIS). The SEM result shows the presence of CNTs and small plates due to copper microparticles. From EIS analysis is possible to observe increased charge-transfer resistance (Rtc) for CNTPE-Cu when compared to the carbon nanotube paste
electrode for the reaction [Fe(CN)6]4-/3-. This is probably due to the formation of a passive oxide layer
(CuO) on the surface of the CNTPE-Cu, which prevents electron transfer. Finally, the performance of CNTPE-Cu in the determination of quercetin was compared to CNTPE. The lower limit of detection obtained with CNTPE-Cu is attributed to the formation of the quercetin-Cu(II) complex on the electrode surface. The determination of quercetin in apple juice concurred with the spectrophotometric method at a 95% confidence level with recoveries between 98.9 and 102.8%.
Keywords: Carbon nanotubes, copper microparticles, DPV, quercetin, quercetin-Cu(II) complex
1. INTRODUCTION
of incommensurate concentric cylinders of these graphitic shells with a layer spacing of 0.3–0.4 nm. MWCNTs tend to have diameters in the range 2–100 nm and can be considered as mesoscale graphite systems [1].
Since the discovery of carbon nanotubes (CNTs) in 1991 [2], CNTs have been widely used in different fields. It is well known that CNTs have the ability to promote electron transfer reactions and improve sensitivity in electrochemistry, and thus they are widely used to prepare electrodes. Rivas proposed a new composite based on the suspension of MWCNTs within mineral oil, called a carbon nanotube paste electrode (CNTPE) [3]. This electrode showed excellent electrocatalytical activity toward different bioanalytes, demonstrating that the presence of the non-conductive phase did not impair the properties of CNTs [3,5].
Flavonoids are widely distributed in nature and exhibit beneficial traits such as anti-inflammatory, anti-cancer and antioxidant activities [6-8]. Quercetin (Scheme 1), one of the most abundant natural flavonoids, is present in various vegetables and fruits, and its average human daily intake is estimated to be 16–25 mg/person. The antioxidant properties of this compound have been attributed to its capacity to scavenge free radicals generated in aqueous phase, increasing the resistance of lipids against peroxidation [9]. Quercetin is known to complex with various metal cations to form stable compounds, which have demonstrable anti-inflammatory and anti-cancer activity [10-12]. In this context, some studies showed the interaction between quercetin and copper II [13]. The antioxidant and metal-chelating properties of flavonoids are attributed to the presence of aromatic OH groups, their locations relative to each other, the oxidation state of ring B, and the overall number of OH groups present [14, 15]. There are three possible groupings of quercetin that can interact with Cu II: the 3´- and 4´-dihydroxy of ring B; the 3-or-5 hydroxyls; and the 4-carbonyl of ring C.
Scheme 1. The chemical structure of quercetin
Thus, this work describes the use of CNTPE-Cu with the purpose of determining quercetin in apple juice in a differential pulse voltammetric procedure. The characterization of CNTPE-Cu, the composition of the copper and the response to quercetin were also investigated in comparison with CNTPE.
2. EXPERIMENTAL 2.1. Reagents and solutions
All reagents were of analytical grade and used as received. Solutions were prepared with reverse osmosis water from Gehaka (OS20 LX FARMA).
Multi-wall carbon nanotube (MWCNT, 20–40 nm diameter, 5–15 µm) came from Schenzhen Nanotech Port Co. Ltd. (Schenzhen, China). Copper microparticles (Cu, 45 µm) came from Acros Organics.
Quercetin was purchased from Aldrich and a 1.0x10⁻³ mol L-1 stock solution was prepared in 50% (v/v) phosphate buffer pH 7.1 and ethanol.
Apple juice containing quercetin was dissolved in 50% (v/v) ethanol and diluted to volume with phosphate buffer pH 7.1.
2.2. Apparatus
Differential pulse voltammetry (DPV) experiments were performed using a model PGSTAT20 Autolab (Eco Chemie, Utrecht, Netherlands) potentiostat/galvonostat coupled to a personal computer and controlled with the GPES 5.8 software. Electrochemical impedance spectroscopy (EIS) data were obtained using PGSTAT30 Autolab (Eco Chemie, Utrecht, Netherlands) potentiostat/galvanostat controllers with FRA software.
The electrochemical cell was assembled using a conventional three-electrode system: an Ag/AgCl in KCl (3 mol L-1) reference electrode, a Pt counter electrode and an MWCNT paste electrode with a CNTPE-Cu working electrode (1.2 mm diameter). All experiments were carried out at room temperature.
Scanning electron microscopy was performed with a FEG-VP Zeiss Supra 35 microscope, operated at 5 kV, at different magnitudes.
A NIR Cary Model 5G spectrophotometer coupled to a personal computer and controlled with the Cary Win UV software with a quartz cell (optical path of 1.00 cm) was used for comparative method.
2.3. Preparation of the working electrode
in order to obtain 40-70% MWCNT w/w in the paste electrode. Subsequently, the paste was packed into a glass tube ( = 1.2 mm), a copper wire was embedded in the paste for electrical connection.
The carbon nanotube paste electrode modified with copper microparticles (CNTPE-Cu) was prepared by mixing MWNCT powder, copper microparticles and Nujol. A suitable amount of copper was weighed in order to obtain 6, 10 and 18% w/w in the electrode. The paste was then packed into a glass tube ( = 1.2 mm); a copper wire was embedded in the paste for electrical connection. The electrodes were prepared as previously described by Rivas [16].
2.4. Procedures
Cyclic voltammetric curves for 5 mmol L-1 potassium ferrycianide in 0.5 mol L-1 KCl were obtained between -0.15 and +0.65 V at different scan rates in order to evaluate the best composition of the paste.
Differential pulse voltammograms for 5.010-5 mol L-1 quercetin in phosphate buffer pH 7.0 were obtained between -0.05 and 0.60 V at different scan rates (5, 10, 25, 50 and 100 mVs-1) and different amplitudes (10, 25, 50 and 100 mV) in order to evaluate the best experimental conditions for the 60% (w/w) carbon nanotube paste electrode and CNTPE-Cu. Analytical curves were obtained under the conditions established here in the phosphate buffer.
For quercetin sample determinations, standard addition experiments were accomplished using DPV. Apple juice was dissolved in a solution of phosphate buffer pH 7.1. An aliquot of this solution was then transferred to the voltammetric cell and three differential pulse voltammograms (DPV) were recorded. Following this, three additions of 400 µL of a standard 4.010-4 mol L-1 quercetin solution in phosphate buffer pH 7.1 were performed. After each addition, three DPV voltammograms were recorded and the mean peak current was determined.
A spectrophotometric method for the determination of quercetin was used to compare the obtained analytical results with the proposed method.
The electrochemical impedance spectroscopy (EIS) data were obtained from the 10,000 Hz to 0.01 Hz frequency range at amplitude of 10 mV. Impedance spectra were obtained within in 5 mmol L
-1
potassium ferrycianide in 0.5 mol L-1 KCl solutions.
3. RESULTS AND DISCUSSION
3.1. Evaluation of CNTPE-Cu and electrode response
The composition of the electrode is a critical parameter in obtaining the quality of the voltammetric response. Thus, a study on the effect of the amount of copper microparticles on the performance of the CNTPE-Cu was achieved.
in Fig. (1). The results observed show that electrodes with CNTs content smaller than 50% (w/w) present small peak currents when compared to the other compositions. Pastes containing 60% of CNTs (w/w) showed a similar behavior to the one observed from CNTPE containing 70% (w/w). However, the consistence of the CNTPE containing 70% (w/w) of CNTs was difficult to manually mix for the electrode preparation. Therefore, this Nujol composition was used in the present investigation for the construction of the CNTPE-Cu.
The electrodes CNTPE-Cu prepared with different compositions of copper microparticles (6-18%) were evaluated in relation to the pulse voltammetric curves of phosphate buffer pH 7.1 solution; this solution contained 5.010-5 mol L-1 of quercetin. Fig. 2 shows the effect of copper percentages in the oxidation process of quercetin. Compositions of 10–18% copper presented very high peak currents related to the process of copper oxidation in the phosphate buffer solution. This process occurs at a similar potential to the oxidation of quercetin. Furthermore, a narrowest window in anodic range was found when the compositions of 10-18% are used. Considering these results, 6% of copper was chosen as the optimal composition for preparation of the CNTPE-Cu electrodes.
-0.1 0.0 0.1 0.2 0.3 0.4 0.5
-20 -15 -10 -5 0 5 10 15
E / V vs Ag/AgCl
i
/
A
[image:5.596.166.450.335.547.2](a) 40% (b) 50 % (c) 60 % (d) 70 %
Figure 1. Cyclic voltammetric response of the carbon nanotube paste eletrodes (a) 40%, (b) 50%, (c) 60%, (d) 70% at 5.0 mmol L-1 K3[Fe(CN)6] in 0.5 mol L-1 KCl solution. Scan rate 50 mV s-1
and potential from -0.15 to +0.65 V.
The electrical properties of CNTPE-Cu and CNTPE studied here were further analyzed by EIS. The EIS experiments, from Nyquist plots, allow the attainment of charge transfer resistance values for the electrode process under examination. In this way, the experiments were carried out under the following conditions: (a) CNTPE, at 0.346 V (ac potential); and (b) CNTPE-Cu, at 0.207 V(ac potential); all with 5 mmol L-1 Fe(CN)63- in 0.5 mol L-1 KCl solution. All responses (Fig. 3) presented
0.0 0.2 0.4 0.6
0.0 0.4 0.8 1.2 1.6 i / A
E / V vs Ag/AgCl
(a)
0.0 0.2 0.4 0.6
0 1 2 3 4 5 6 i / A
E / V vs Ag/AgCl
(b)
0.0 0.2 0.4 0.6
4 8 12 16 20 24 i / A
E / V vs Ag/AgCl
(c)
Figure 2. Differential pulse voltammograms obtained at the CNTPE-Cu: (a) 6 %; (b) 10 % and (c) 18 % (Cu, w/w) in phosphate buffer solution (---) and 5.010-5 mol L-1 quercetin solution in phosphate buffer (___). Scan rate 10 mV s-1 and pulse amplitude 100 mV.
0 50 100 150 200
0 50 100 150 200 (a) -Z `` / cm -2
Z` / cm-2 0 40 80 120 160 200 240 280
0 40 80 120 160 200 240 280 (b) -Z `` / cm -2
Z`/ cm-2
Figure 3. Typical Nyquist plots resulting from: (a) CNTPE and (b) CNTPE-Cu in 5.0 mmol L-1 K3[Fe(CN)6] in 0.5 mol L-1 KCl solution. Insert: Randle’s model, as proposed. Applied
potentials: 0.346 V (a) and 0.207 V (b), corresponding to the ac potential
[image:6.596.86.509.67.387.2] [image:6.596.110.496.476.634.2]
interface capacitance, and Rct the charge-transfer resistance (domain of the kinetic control), resulting
from the diffusion of Fe(CN)63- toward the electrode surface from the bulk of the electrolyte.
Table 1. Summary of estimated EIS parameters obtained for the CNTPE and CNTPE-Cu
Electrode n Rct ()
CNTPE CNTPE-Cu
0.6472 0.6709
90.5 252.0
As evidenced in the Nyquist plots, the simulated symbols (cross) based on the model demonstrate good agreement with the experimental results. The estimated parameters obtained by assuming Randle’s model are listed in Table 1. The value of Rtc to CNTPE-Cu is increased by 2.5
times compared to the value obtained for CNTPE for the reaction [Fe (CN)6]4-/3-. These results can be
[image:7.596.116.505.366.708.2]attributed to the formation of a passive oxide layer (CuO) on the surface of the CNTPE-Cu, which prevents electron transfer.
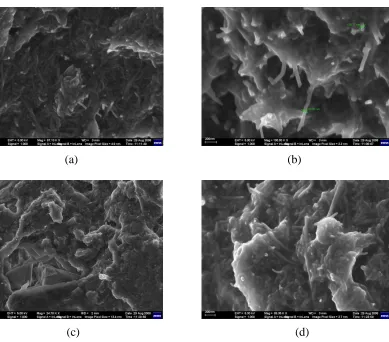
Figure 4. Scanning electron micrographs for CNTPE (a and b) and CNTPE-Cu (c and d). Scales: (a) 200 nm, (b) 200 nm, (c) 1 µm and (d) 200 nm
(a) (b)
This fact also justifies the choice of composition of 6% copper for future studies, since for larger compositions the charge-transfer resistance would also be greater. The formation of CuO was also observed in studies with quercetin analyte through the complex formation of quercetin-Cu (II) on the electrode surface.
Micrographies of the CNTPE and CNTPE-Cu surfaces, after polishing with 600 grit sand paper, are presented in Fig. 4 in different magnitudes. The comparison of images shows significant differences in the morphology of materials. As can be seen in Fig. 4a, the surface of the paste is homogeneous and CNTs are distributed over the whole surface the paste. It can be observed that the CNTs still retain their structures, indicating that the process of maceration does not destroy them. At a higher magnification (Fig. 4b) it is possible to observe an increase in diameter of the CNTs, due, most likely, to the presence of mineral oil covering the surface. In Fig. 4c it is possible to observe the presence of plates due to copper microparticles with a diameter of 45 µm. At a higher magnification, the presence of CNTs was also observed (Fig. 4d), as in the previous case.
3.2. Electrochemical behavior of quercetin by using CNTPE-Cu
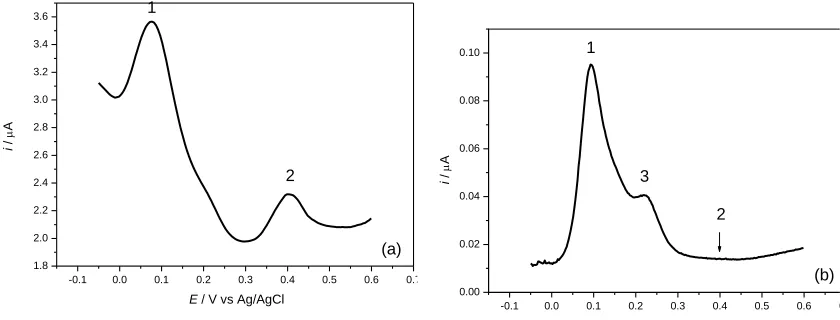
The voltammetric behavior of quercetin on the CNTPE-Cu was investigated by differential pulse voltammetry in phosphate buffer pH 7.1 and the result obtained was compared with CNTEP result. Typical results are presented in Fig. 5. On the CNTPE (Fig. 5a), two oxidation processes (peaks I and II) are observed at 0.082 and 0.40 V (versus Ag/AgCl). The oxidation process is related to several functional dihydroxyl groups that present electrochemical activity. In general, it has been proposed that the charge transfer process at peak I corresponds to the oxidation of the 3´-4´-dihydroxy substitute on ring B of quercetin, while peak II represents oxidation reactions involving the hydroxyl group substitute on ring C. The mechanism for electrochemical oxidation of rutin can be observed below [18]:
-0.1 0.0 0.1 0.2 0.3 0.4 0.5 0.6 0.7
1.8 2.0 2.2 2.4 2.6 2.8 3.0 3.2 3.4 3.6
i
/
A
E / V vs Ag/AgCl
1
2
(a)
-0.1 0.0 0.1 0.2 0.3 0.4 0.5 0.6 0.7
0.00 0.02 0.04 0.06 0.08 0.10
2 3
1
i
/
A
E / V vs Ag/AgCl
(b)
Figure 5. Differential pulse voltammograms obtained at the CNTPE (a) and CNTPE-Cu (b), using 5.010-5 mol L-1 quercetin solution in phosphate buffer. Scan rate 10 mV s-1 and pulse amplitude 100 mV (a) and scan rate 5 mV s-1 and pulse amplitude 1 0mV (b).
In the voltammogram obtained for CNTP-Cu (Fig. 5b) is possible to observe that the peak potential at 0.40 V (peak II, comprised of oxidation reactions involving the hydroxyl group at substitute on ring C) disappeared completely to be replaced by a new peak potential at 0.213 V. This suggests that the quercetin-Cu(II) complex was formed by interaction of the group 4-carbonyl of ring C on quercetin with Cu (II), and the peak at 0.213 V corresponds to the oxidation of the quercetin-Cu(II) complex [13]. Initially, the copper metal is converted to copper (II) oxide by application of potential, so the copper (II) present on the electrode surface is responsible for the formation of the complex. In this experiment a 5 mVs-1 scan rate was used following an optimization study.
Scheme 3. The chemical structure of quercetin-Cu (II) complex
3.3. Optimization of CNTPE response and analytical performance
[image:9.596.92.512.70.230.2][image:10.596.101.491.211.277.2]
summarizes the range over which each variable was investigated and the optimal conditions found. The effect of the pulse amplitude on the CNTPE response was investigated between 5 and 100 mV. The highest analytical signal was obtained at 100 mV. After this, the scan rate was studied ranging from 5 to 100 mV s-1. The best scan rate for DPV was 10 mV s-1. These experimental conditions were therefore selected for further experiments.
Table 2. Optimization of 60 % (w/w) carbon nanotube paste electrode parameters
Electrode parameters Range studied Optimal value
Pulse amplitude / mV 10 – 100 100
Scan rate / mV s-1 10 – 100 10
Quercetin can accumulate at CNTs due to the presence of the hydrophilic carbohydrate groups. It seems that quercetin is adsorbed at the CNTPE surface and binds to graphite particles through its flavone component. This fact causes a decrease in oxidation signals, requiring regeneration of the surface between each measurement, which could result in the loss of repeatability.
0 5 10 15 20 25 30 35 40
1 2 3 4 5 6
i
/
10
[image:10.596.180.431.400.596.2]-7 A
[quercetin] / 10-6 mol L-1
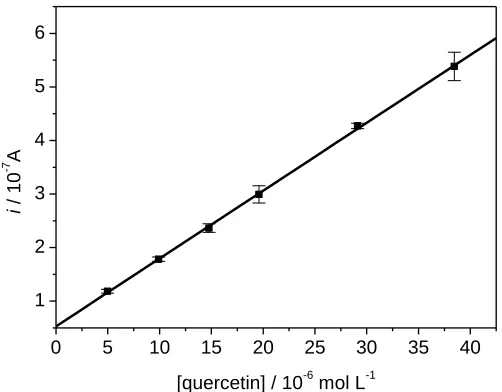
Figure 6. Analytical curve obtained at the CNTPE in phosphate buffer solution, containing different concentrations of quercetin. Scan rate 10 mV s-1 and pulse amplitude 100 mV.
sensitivity and repeatability were observed for the first process of oxidation; peak I was therefore selected for the determination of quercetin.
Using the obtained optimized parameters mentioned above, an analytical curve was obtained for peak I in the 4.9810-6 to 3.8510-5 mol L-1 quercetin range, according to:
Ipa = 0.530 (10-7A mol L-1) + 0.127 [quercetin] (10-6 mol L-1),
R = 0.9999, n =6
In this range, a detection limit of 5.4310-7 mol L-1 was found (3 blank standard deviation/angular coefficient) [19]. The result is presented in Fig. 6, the curve of which was obtained with surface renewal between successive determinations.
3.4. Optimization of the CNTPE-Cu response and analytical performance
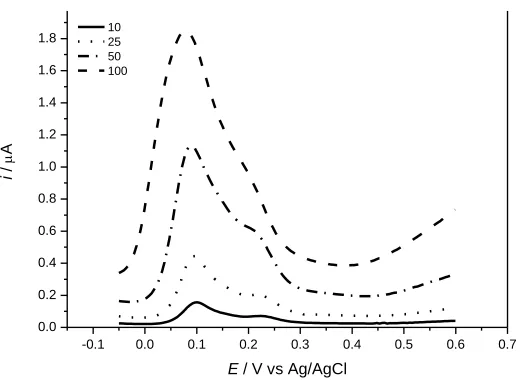
The influence of pulse amplitude on the anodic peak was studied, with the purpose of increasing the signal obtained for quercetin. The effect of varying the pulse amplitude from 10 to 100 mV on the CNTPE-Cu response to 5.010-5 mol L-1 quercetin solution in phosphate buffer pH 7.1 was studied. The resulting voltammograms are presented in Fig. 7. The analytical signal for the oxidation of quercetin increased with the pulse amplitude up to 100 mV. However, higher peak definition for the oxidation of quercetin was observed at pulse amplitude of 10 mV. Pulse amplitude of 10 mV was, therefore, used for the experiment.
-0.1 0.0 0.1 0.2 0.3 0.4 0.5 0.6 0.7 0.0
0.2 0.4 0.6 0.8 1.0 1.2 1.4 1.6 1.8 2.0
-0.1 0.0 0.1 0.2 0.3 0.4 0.5 0.6 0.7
0.02 0.04 0.06 0.08 0.10 0.12 0.14 0.16
i
/
A
E / V vs Ag/AgCl
[image:11.596.174.435.420.610.2]10 25 50 100
Figure 7. Effect of pulse amplitude on the CNTPE-Cu response in quercetin solution 5.010-5 mol L-1 in phosphate buffer. Scan rate 5 mV s-1.
determination of the linear range for this system. The curve was linear in the entire interval of quercetin concentration, obeying the following equation:
Ipa = -0.075 (10-9A mol L-1) + 0.0032 [quercetin] (10-6 mol L-1),
R = 0.9996, n =6
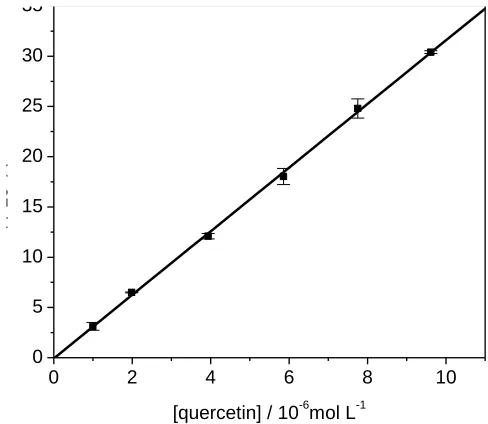
The analytical curve (Fig. 8) was obtained by measuring the peak currents for 6 different concentrations measured in triplicate for each point. For concentrations higher than 9.6210-6 mol L-1 a practically constant current was observed, suggesting saturation of the active sites of the electrode. The limit of detection obtained in this interval was 2.3610-7mol L-1. The lower limits of detection can be found in the literature [20]. However, DPV techniques coupled with preconcentration procedures are needed, increasing the time of analysis.
0 2 4 6 8 10
0 5 10 15 20 25 30 35
i
/
10
[image:12.596.166.410.316.528.2]-9 A
[quercetin] / 10-6mol L-1
Figure 8. Analytical curve obtained at the CNTPE-Cu in phosphate buffer solution, containing different concentrations of quercetin. Scan rate 5 mV s-1 and pulse amplitude 10 mV.
Comparison of the results obtained with CNTPE and CNTPE-Cu electrodes allows the conclusion that the CNTPE-Cu electrode presented a lower limit of detection than the CNTPE electrode. Thus, the CNTPE-Cu electrode was selected for the determination of quercetin in apple juice. The lower sensitivity observed for the CNTPE-Cu electrode is attributed to the lower value of amplitude pulse used.
3.5. Study of interference
[image:13.596.66.526.287.380.2]The effect of the concomitants usually found in apple juice, such as citric acid, was evaluated to avoid interference in the analysis of the studied analyte. This study was carried out to evaluate the possible interference of citric acid in the quercetin determination using DPV measurements for CNTPE-Cu. The investigation was made using solutions containing a constant concentration of quercetin and various concentrations of citric acid. The values obtained in the recovery studies are summarized in Table 3. The interference of citric acid was not verified in any of the solutions regarding the quercetin voltammetric response (results not shown). The process did not require sample pre-treatment for elimination of the citric acid.
Table 3. Determination of quercetin in presence of citric acid using CNTPE-Cu in DPV
Citric acid ( 10-6 mol L-1) Quercetin ( 10-6 mol L-1) Recovery (%)
Added Found
1.96 1.956 1.764 90.20
98.00 1.956 1.794 91.72
192.30 1.912 1.797 93.94
3.6. Application of the CNTPE-Cu in the determination of quercetin in apple juice
The performance of the proposed method in the determination of quercetin in apple juice was evaluated. For the voltammetric determination of the amount of quercetin present in the sample, the single standard addition method was used. The conditions for the determination of quercetin were those optimized as above.
Table 4. Determination of quercetin in sample of apple juice using CNTPE-Cu in DPV and spectrophotometric method
Quercetin / mg L-1
DPV Spectrophotometric method Ec / %
144.85 ± 3.60 141.50 ± 2.12 2.37
Ec: DPV vs. spectrophotometric method (DPV – spectrophotometric method / spectrophotometric method) x 100 %
[image:13.596.100.491.572.629.2]
Single point standard additions for solutions of the apple juice showed recoveries between 98.8 and 102.8% for additions of quercetin. The recovery results obtained suggest an absence of the matrix effect on these determinations. Concomitants usually found in apple juice do not interfere in the determination of quercetin. Thus, there was no need of sample pre-treatment for elimination of these concomitants. In this sense, it is possible to suppose that standard addition can also be a useful strategy to determine quercetin in samples of apple juice. Furthermore, the electrode proposed in this work offered easy preparation, fast response, high sensitivity, long operational life, and good repeatability.
4. CONCLUSIONS
This works demonstrates the construction of the chemically modified carbon nanotube paste electrode by the incorporation of copper microparticles as modifying species. Pulse voltammetric studies demonstrated that quercetin-Cu(II) complex is formed on the surface of CNTPE-Cu. When compared with CNTPE, CNTPE-Cu presented higher charge-transfer resistance, attributed to the formation of CuO on the electrode surface. However, the CNTPE-Cu electrode presented a lower limit of detection than the CNTPE electrode. Furthermore, this electrode can be used by DPV for the determination of quercetin in apple juice; any interference was observed. The process of the proposed method is simple, fast and sensitive.
ACKNOWLEDGEMENTS
The authors wish to thank CAPES, CNPq and FAPESP, Brazil, for student grants and financial support for this work.
References
1. A.Merkoci, M. Pumera, X. Lopis, B. Perez, M. Del Valle and S. Alegret , Trends Anal. Chem.,24 (2005) 826.
2. S. Iijima, Nature, 54 (1991)56.
3. M. D. Rubianes and G. A. Rivas, Electrochem. Commun. 5 (2003) 689.
4. H. Yaghoubian, H. Karimi-Maleh, M. A., Khalilzadeh, F. Karimi, Int. J. Electrochem. Sci. 4 (2009) 993.
5. A. A. Ensafi, H. Karimi-MalehInt, J. Electrochem. Sci., 5 (2010) 392.
6. C.A. Rice-Evans and L. Parker, Flavonoids in health and disease, Marcel Dekker, New York (1998)
7. A. K. Aris, F.J. Romero and C.G. Merino, Free Radic. Biol. Med., 37 (2004) 48. 8. J.B. Harborne and C.A. Willians, Phytochemistry 55 (2000) 481.
9. P. Pietta, J. Nat. Prod., 63 (2000) 1035.
10.J. Zhou, L. F. Wang, J.Y. Wang and N. Tang, Transit. Met. Chem., 26 (2001) 57. 11.A.Bravo and J.R. Anacona, Transit. Met. Chem., 26 (2001) 20.
12.J. Zhou, L.F. Wang, J.Y. Wang and N. Tang, J. Inorganic Biochem., 83 (2001) 41. 13.Y. Ni, S. Du and S. Kokot, Anal. Chim. Acta, 584 (2007) 19.
15.J. E. Brown, H. Khodr, R. C. Hider and C.A. Rice-Evans, Biochem. J., 330 (1998) 1173. 16.G.L. Luque, N. F. Ferreyra, G. A. Rivas, Talanta, 71(2007) 1282.
17.M.D. Rubianes and G. A. Rivas, Electroanalysis, 17 (2005) 73.
18.A.K. Timbola, C. D. de Souza, C. Giacomelli, A. Spinelli, J. Braz. Chem. Soc., 17 (2006) 139. 19.J. Miller, Statistic for analytical chemistry, Prentice Hall, Ellis Horwood PTR, New York (1993) 20.X.Q. Lin, J. B. He and Z.G. Zha, Sens Actuators B, 119 (2006) 608.
![Figure 1. Cyclic voltammetric response of the carbon nanotube paste eletrodes (a) 40%, (b) 50%, (c) 60%, (d) 70% at 5.0 mmol L-1 K3[Fe(CN)6] in 0.5 mol L-1 KCl solution](https://thumb-us.123doks.com/thumbv2/123dok_us/1934247.153091/5.596.166.450.335.547/figure-cyclic-voltammetric-response-carbon-nanotube-eletrodes-solution.webp)
![Figure 3. Typical Nyquist plots resulting from: (a) CNTPE and (b) CNTPE-Cu in 5.0 mmol L-1 K3[Fe(CN)6] in 0.5 mol L-1 KCl solution](https://thumb-us.123doks.com/thumbv2/123dok_us/1934247.153091/6.596.86.509.67.387/figure-typical-nyquist-plots-resulting-cntpe-cntpe-solution.webp)