MEDIUM TERM LOAD FORECASTING USING STATISTICAL FEATURE SELF ORGANIZING MAPS (SOM)
NIK NUR ATIRA BINTI NIK IBRAHIM
BACHELOR OF ELECTRICAL ENGINEERING (INDUSTRIAL POWER)
“I hereby declare that I have read this report and in my opinion this project is sufficient in terms of scope and quality for the award of the Bachelor of Electrical Engineering (Industrial Power) with Honours”
Signature :
Supervisor‟s Name : En Zul Hasrizal bin Bohari
MEDIUM TERM LOAD FORECASTING USING STATISTICAL FEATURE SELF ORGANIZING MAPS (SOM)
NIK NUR ATIRA BINTI NIK IBRAHIM
A thesis submitted in fulfilment
of the requirements for the degree of Bachelor of Electrical Engineering (Industrial Power)
Faculty of Electrical Engineering
UNIVERSITI TEKNIKAL MALAYSIA MELAKA
“I declare that this report entitled “Medium Term Load Forecasting Using Statistical Feature Self Organizing Maps (SOM)” is the results of my own research except cited in references. The report has not been accepted for any degree and is not currently submitted in candidate of any degree”.
Signature :
ACKNOWLEDGEMENT
Praise to Allah S.W.T The Most Gracious and The Most Merciful for His Blessing for me to finish the Final Year project 1. First of all, I would like to take this opportunity to thank my supervisor, En Zul Hasrizal bin Bohari for all guidance and encouragement for me in completing my Final Year Project.
I would like to extend my thankfulness to the most cherished persons in my life, my parents ( Nik Ibrahim bin Nik Abdullah and Wan Noor Mawani binti Wan Ahmad ) for all their moral, financial support and for never ending reminding me to always be honest and trustworthy.
ABSTRACT
ABSTRAK
TABLE OF CONTENT
ACKNOWLEDGEMENT I
ABSTRACT II
ABSTRAK III
LIST OF TABLE VI
LIST OF FIGURES VII
ABBREVIATION X
INTRODUCTION 1
1.1 Motivation 1
1.2 Problem Statement 2
1.3 Objectives 3
1.4 Scope of Work 3
LITERATURE REVIEW 4
2.1 Introduction 4
2.2 Theoretical Background 4
2.2.1 Load Forecasting 4
2.2.2 Important of load forecasting 4
2.2.3 Categories of load forecasting 5
2.2.4 Factors and variable affect the load forecasting 5
2.2.5 Methods of load forecasting 6
2.2.6 Artificial Neural Networks 7
2.2.7 Classification of ANN 9
2.2.8 Introduction of Self-Organizing Maps (SOMs) 9
2.2.9 Structure of SOM 10
2.2.10 Initialization of SOM 10
2.2.11 Sequential training of SOM 11
2.2.12 U-Matrix 12
2.3 Review of Previous Related Work 13
RESEARCH METHODOLOGY 17
3.1 Introduction 17
3.2 Flow of progress report 18
3.2.1 Data Collection 19
3.2.2 Data Organizing 19
3.2.3 Training of Data Using SOM 22
3.2.4 Testing Using SOM 22
3.2.5 SOM for grouping 22
3.2.6 Forecasting Load Data 23
3.2.7 Calculation of MAPE 23
3.2.8 Result and Analysis 23
3.3 Chart and milestone of research 24
3.4 Summary 26
RESULTS AND DISCUSSION 27
4.1 Introduction 27
4.2 Data Organization 28
4.3 SOM forecasting for the year 2005 30
4.3.1 Training for the year 2004 30
4.3.2 SOM testing and forecasting for the year 2005 35
4.4 SOM forecasting for the year 2006 48
4.4.1 Training for the year 2005 48
4.4.2 SOM for testing and forecasting for year 2006 53
4.5 Percentage error calculation 66
4.6 Summary 67
CONCLUSION AND RECOMMENDATION 68
5.1 Conclusion 68
5.2 Further Recommendation 69
REFERENCES 70
LIST OF TABLE
Table 2.1: The review for past researchers 13
Table 3.1: Lists of holiday for the year 2004, 2005 and 2006 20
Table 3.2: Classification of the season. 20
Table 3.3: The input data as assigned input 23
Table 3.4: The Gantt chart for project activities 25
Table 3.5: The milestone of the project 25
Table 4.1: Result from the training of data in the year 2004 using range normalization
31
Table 4.2: Result from the training of data in the year 2004 using var normalization 32 Table 4.3: Result from the training of data in the year 2004 using log normalization. 33 Table 4.4: Result from the training of data in the year 2004 using logistic
normalization
34
Table 4.5: The comparison between 4 types of normalization method 35 Table 4.6: Result from the training of data in the year 2005 using range
normalization
49
Table 4.7: Result from the training of data in the year 2005 using var normalization 50 Table 4.8: Result from the training of data in the year 2005 using log normalization 51 Table 4.9: Result from the training of data in the year 2005 using logistic
normalization.
52
Table 4.10: The comparison between 4 types of normalization method 53
LIST OF FIGURES
Figure 2.1: The methods for load forecasting [7]. 7
Figure 2.2: The components of neuron 7
Figure 2.3: The neuron model 8
Figure 2.4: A typical ANN layer [12]. 8
Figure 2.5: The Kohonen Self-Organizing Maps. 10
Figure 2.6: Weight vector is updated [17]. 12
Figure 2.7: U matrix representation of the SOM 12
Figure 3.1: Methodology of forecasting SOM 18
Figure 3.2: The organization of input variables 19
Figure 4.1: The graph of temperature against months from 2004 until 2006. 28 Figure 4.2: The graph of load demand for 12 months from 2004 until 2006. 29 Figure 4.3: The U-matrix and plane representation for range normalization with
1780 numbers of the neuron.
31
Figure 4.4: The U-matrix and plane representation for var normalization with number of the neuron of 1740.
32
Figure 4.5: The U-matrix and plane representation for log normalization with number of the neuron of 1800.
33
Figure 4.6: The U-matrix and plane for logistic normalization for number of the neuron of 1800.
34
Figure 4.7: SOM testing for the year 2005. 36
Figure 4.14: The testing cell and winning cells for group 7. 40 Figure 4.15: The testing cell and winning cells for group 8. 40 Figure 4.16: The testing cell and winning cells for group 9. 41 Figure 4.17: The testing cell and winning cells for group 10. 41 Figure 4.18: The testing cell and winning cells for group 11. 42 Figure 4.19: The testing cell and winning cells for group 12. 42 Figure 4.20: The testing cell and winning cells for group 13. 43 Figure 4.21: The testing cell and winning cells for group 14. 43 Figure 4.22: The testing cell and winning cells for group 15. 44 Figure 4.23: The testing cell and winning cells for group 16. 44 Figure 4.24: The testing cell and winning cells for group 17. 45 Figure 4.25: The testing cell and winning cells for group 18. 45 Figure 4.26: The testing cell and winning cells for group 19. 46 Figure 4.27: The testing cell and winning cells for group 20. 46 Figure 4.28: The testing cell and winning cells for group 21. 47 Figure 4.29: The testing cell and winning cells for group 22. 47 Figure 4.30: The U-matrix and plane representation for range normalization with 1800 number of the neuron.
49
Figure 4.31: The U-matrix and plane representation for var normalization with 1720 number of the neuron
50
Figure 4.32: The U-matrix and plane representation for log normalization for number of neuron of 1780.
51
Figure 4.33: The U-matrix and plane representation for logistic normalization for number of neuron of 1800.
52
Figure 4.34: SOM testing for the year 2006. 54
ABBREVIATION
ANN Artificial Neural Network
SOM Self-Organizing Maps
CHAPTER 1
INTRODUCTION
1.1Motivation
Forecasting is a development of making a decision about an event which actual outcome has not yet been observed and it is the basic facet of making a decision. Load forecasting is an critical device for power system activity and planning [1], [2]. With power system development and the expansion in their complexity, various aspects have given affect to the electric power generation and consumption; such load management, energy exchange, spot pricing, and etc. In this way, the forecasting procedure has turned out to be much more complex, and more precise forecasts are required [3]. For electric utilities, it is essential to have an authentic load forecasting for variety time measure. By deregulation of energy industries, forecasting is significantly more imperative for a dispatcher to settle on a superior choice and conform to them. Consequently, electric utilities decrease events of equipment failure and power outage [4].
For the medium term load forecasting, lots of variables are contributing to the load causes an exact prediction of load forecast becomes a complicated process since the variables are characterized to be a non-linear and non-stationary process. The process is complicated since the load can encounter rapid changes due to many factors and variables such as weather, seasonal and macroeconomic variations thus the load forecasting using the classical prediction models are not suitable [6]. Artificial Neural Networks (ANNs) methods are considered to be other more advanced forecasting methods which are useful for a multi-variable model. The ability of it forecast the non-linear and non-stationary load make it widely used in electricity load forecasting since 1990 [7].
The Self-Organizing Maps (SOMs) are being used since other architecture required the supervised training and do not have a favourable ability to disclose data outside of the domain of trained data. Thus the SOMs have been designed to overcome these shortcomings.
1.2Problem Statement
1.3Objectives
The main objectives of this research are:
1. To understand the ability Self-Organizing Maps in forecasting the load demand.
2. To train and testing via the Self-Organizing Maps method using selected features (average temperature, K; holiday list; seasons).
3. To analyse and predict the missing data and calculate the MAPE value.
1.4Scope of Work
CHAPTER 2
LITERATURE REVIEW
2.1Introduction
This chapter introduces the theoretical background for the load forecasting and the methods of load forecasting based on the past researches.
2.2Theoretical Background
2.2.1 Load Forecasting
It is critical for electrical utilities to have an explicit data of load forecasting for the distant duration of time. With the self-regulating market of energy industries, forecasting has been essential especially for the dispatcher to make a choice and accede with them [4]. Forecasting is a process of prediction about an event which the real outcomes is yet not been occurs. Load forecasting is the divination of electrical load using the historical load data for a certain geographical area [1].
2.2.2 Important of load forecasting
applications such as in maintenance scheduling, medium term hydrothermal coordination, and competence assessment, managements of limited energy resources and agreement of progressive contracts and building of cost adequate fuel purchasing strategies [2]. Although it plays as the main factor in economic operation, the load forecasting is a two-dimensional concept which based on the consumer and load forecasting. Thus the significance for both is can be handled separately [8].
2.2.3 Categories of load forecasting
Load forecasting can be classified into three divisions which are short term, medium term, and long term. Although the period of the categories is not declared clearly in the research, the short-term load forecasting (STLF) covers hour to weekly forecast [8]. The STLF is important for the action of power systems such as a unit of commitment, economic dispatch, and security dispatch. The medium term load forecasting (MTLF) covers the prediction from weekly to a year. The MTLF normally used in the power system operational planning such as hydrothermal coordination and maintenance of scheduling [2]. The long term load forecasting (LTLF) normally covers the load forecasting for few years ahead and primarily purposed for bulk expansion plans, investments and corporate estimation [2], [8].
2.2.4 Factors and variable affect the load forecasting
The STLF usually take into account a few factors which; time influence, weather data and classification of the consumer. The MTLF and LTLF usually consider using the historical load data and climate data, customers in various classes, the appliances at a particular field and their distinctive, the economic and analytical data of the forecast, the data of appliances sales, and other factors [5].
The electric usage or load is quite different for the each class of the customer which; residential, commercial, and industrial. The load pattern for each class has a large difference in the consumption of demand and load is much higher for the industrial compared to the residential [1], [5]. The holiday influence may affect the load usage and demand especially during major holidays [4].
2.2.5 Methods of load forecasting
Many forecasting designs have been refined over the last few decades. The researchers had been classified the methods into two which are econometric approach and artificial neural network (ANN) [1].
The econometric approach is using the statistical approach which usually uses the mathematical model that use the load as a function of various factors; time data, climate data, and customer classification as the load. However, the traditional econometric approach often assuming the linear relationship which adapting the functional relationship between weather factors and load demand. According to Park et al. indicates that the econometric approach might not give an accurate result due to the non-linear and non-static relationships between the load and the climate factor. Thus the ANN methods are preferable compared the econometric approach [2], [10].
Figure 2.1: The methods for load forecasting [7].
2.2.6 Artificial Neural Networks
The Artificial neural network has been broadly experimental for load forecasting methods since 1990. ANNs are electronic clone based on the structure of neural in the brain as shown in Figure 2.2. The artificial neuron process are motivated by models of the neural which recognized the pattern, and then used the pattern to utilize and affect the formation of huge parallel networks, and coaching those networks to solve specific problems [8], [11]. Figure 2.2Figure 2. shows the similarities between the brain neuron with the artificial neuron as compared to Figure 2.3.
[image:22.595.227.377.563.678.2]Figure 2.3: The neuron model
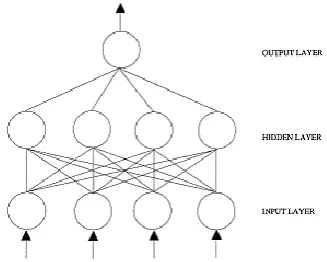
The ANNs is essentially non-linear circuits its output in linear or non-linear mathematical functions its inputs. The input of the data may be outputs or inputs of the other network elements. The ANNs normally have three layers as shown in Figure 2.4. The first layer is connected to the input variables known as the input layer. The third layer is connected to the output variables known as the output layer. The layer in-between the input and output layer known as the hidden layer. The hidden layer can be existed more than one layer [8], [12]. The processing elements in each layer are called nodes. Every node is connected to other neighbouring layers. Thus the parameter that involves with each connection is called weight [12].
Figure 2.4: A typical ANN layer [12].
Before the network can be used, the network must learn the information beforehand. After coaching, it can be applied for pragmatic function. In broad, there are two types of learning which; supervised learning and unsupervised learning.
[image:23.595.218.382.413.544.2] Unsupervised learning means the exact answer are not known. The network needs to discover its own pattern based on input data which it purely depends on the input variables. The output generated will not use to learn from. The learning also does not need human interaction and can be handled with a broad and/or complicated dataset [13].
2.2.7 Classification of ANN
ANN techniques have many types of method approach. To apply the ANN technique into the load forecasting, one must choose one of the architecture approaches; Back-propagation, Hopfield, Kohonen‟s self-organizing maps, etc. [5]. The Back-propagation (1970) adopts continuously valued function and supervised learning. Through supervised learning, the real numerical weight is actuated by matching the past load data to the aspire output in a pre-operational coaching session [8].
The Hopfield (1982) introduce a chain neural network which; perform as a related memory that can recall a case from fractional or deformed version. The networks are not layered with complete attached between the nodes. The results of the network are not exactly being the function of the inputs [11]. The Kohonen‟s self-organizing maps (1982) are inspired by the self-organizing behaviour of the human brain and no supervised is required. The Kohonen‟s learn by itself through unsupervised competitive learning [13].
2.2.8 Introduction of Self-Organizing Maps (SOMs)
![Figure 2.1: The methods for load forecasting [7].](https://thumb-us.123doks.com/thumbv2/123dok_us/72232.6787/22.595.227.377.563.678/figure-methods-load-forecasting.webp)