Supplementary appendix
This appendix formed part of the original submission and has been peer reviewed.
We post it as supplied by the authors.
Effectiveness and cost-effectiveness of systemic family therapy compared with
treatment as usual for young people after self-harm: a pragmatic randomised controlled
trial. Cottrell et al, 2018, Lancet Psychiatry
Appendix
Table of Contents
1. Inclusion and exclusion criteria and their rationale: Table 1 2
2. Family therapy and TAU interventions: Table 2 4
3. Full young person and caregiver scores at baseline: Tables 3 & 4 7
4. Full young person and caregiver scores on secondary outcomes at 12 and 18 months: Tables 5 & 6 11
5. Predictive and process measures: Figure 1; Tables 7 & 8 15
6. Comparison of baseline scores with population data 7. 19
7. Health Economics: Intervention Costs: Tables 9 & 10 20
8. Health Economics: Monte Carlo simulation, model parameters: Figure 2 and Table 11 23
2
1. Inclusion and exclusion criteria and their rationale
This was a pragmatic trial involving young people who could be at significant risk of further self-harm. In deciding on inclusion and exclusion criteria we had to balance the need to be inclusive, in order to be as representative as we could of real-world practice, against the very real anxieties of local clinical services about randomising to interventions, young people at risk of further self-harm.
Our funder specified that the trial must include young people, aged 11-17, who had self-harmed at least once before this index presentation. In common with UK, European and Australasian practice, we defined self-harm as any form of intentional non-fatal self-poisoning or self-injury (including cutting, taking excess medication, hanging, self-strangulation, jumping from height, and running into traffic), regardless of suicidal intent; this includes the US definitions of non-suicidal self-injury (NSSI) and suicidal behaviour.
In addition, we specified that:
• The self-harm had to have led to referral to a CAMHS team (we did not have the resources to identify participants in the community);
• Participants were living with a primary caregiver who was willing to take part in therapy (as we were evaluating a family-based intervention we needed to know that there was at least one other family member/ caregiver willing to be involved);
• If the index episode was due solely to alcohol or recreational drugs, participants had explicitly stated that they intended self-harm;
• It was the intention of the CAMHS team to offer their usual out-patient treatment – see exclusion criteria.
In considering exclusion criteria our concern was primarily to ensure participant safety and the integrity of the research process. Our exclusion criteria were:
• Serious suicide risk making outpatient treatment unsafe in the opinion of CAMHS clinicians. (Most young people who self-harm in the UK are assessed quickly by a CAMHS clinician and offered out-patient follow-up treatment. In a few cases where suicide risk is judged to be very high, local clinicians may make alternative treatment arrangements: in-patient admission, intensive outreach services etc. In such cases randomisation to TAU would not be possible as clinical judgement deemed other treatments urgently necessary);
• The need for specialist CAMHS services (most UK CAMHS teams have specialist clinics for a few serious specific conditions, for example, early intervention in psychosis, eating disorders. In such cases
randomisation to TAU would also not be possible as clinical judgement deemed other treatments necessary);
• Current pregnancy (the need to attend ante and post-natal care was likely to interfere with the usual delivery of TAU or FT);
• Current CAMHS treatment (it was considered unethical to potentially disrupt already ongoing treatment to randomise to a new treatment);
• Sibling in trial or receiving family therapy (it was considered unethical to potentially disrupt already ongoing treatment to randomise to a new treatment);
• Living in a children’s home or short-term foster placement where changes of placement were likely, and it was therefore unlikely that a stable caregiver presence at FT would be possible). Participants were eligible if living in longer term foster care as long as other criteria were met;
• Moderate to severe learning disability (if lacking capacity to comply with trial requirements of consent or of involvement in treatment);
• Involved in conflicting research (it was considered unethical to involve a young person in a second possibly conflicting research project)
• Insufficient proficiency in English to provide self-reported data (interpreters were available for therapy sessions in both arms of the trial. This exclusion criterion related only to inability to complete self-report data).
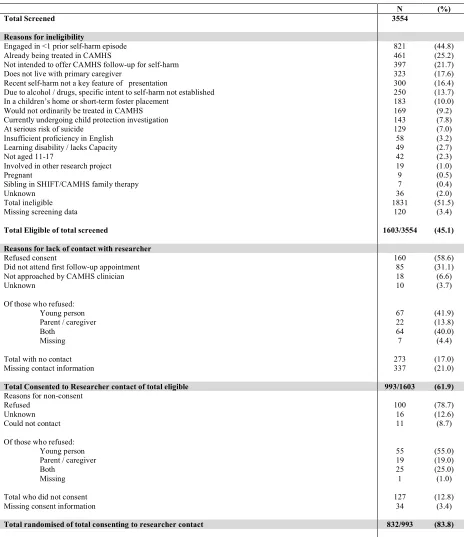
Table 1: Recruitment data, reasons for ineligibility, no contact and non-consent
N (%)
Total Screened 3554
Reasons for ineligibility
Engaged in <1 prior self-harm episode 821 (44.8)
Already being treated in CAMHS 461 (25.2)
Not intended to offer CAMHS follow-up for self-harm 397 (21.7)
Does not live with primary caregiver 323 (17.6)
Recent self-harm not a key feature of presentation 300 (16.4)
Due to alcohol / drugs, specific intent to self-harm not established 250 (13.7)
In a children’s home or short-term foster placement 183 (10.0)
Would not ordinarily be treated in CAMHS 169 (9.2)
Currently undergoing child protection investigation 143 (7.8)
At serious risk of suicide 129 (7.0)
Insufficient proficiency in English 58 (3.2)
Learning disability / lacks Capacity 49 (2.7)
Not aged 11-17 42 (2.3)
Involved in other research project 19 (1.0)
Pregnant 9 (0.5)
Sibling in SHIFT/CAMHS family therapy 7 (0.4)
Unknown 36 (2.0)
Total ineligible 1831 (51.5)
Missing screening data 120 (3.4)
Total Eligible of total screened 1603/3554 (45.1)
Reasons for lack of contact with researcher
Refused consent 160 (58.6)
Did not attend first follow-up appointment 85 (31.1)
Not approached by CAMHS clinician 18 (6.6)
Unknown 10 (3.7)
Of those who refused:
Young person 67 (41.9)
Parent / caregiver 22 (13.8)
Both 64 (40.0)
Missing 7 (4.4)
Total with no contact 273 (17.0)
Missing contact information 337 (21.0)
Total Consented to Researcher contact of total eligible 993/1603 (61.9)
Reasons for non-consent
Refused 100 (78.7)
Unknown 16 (12.6)
Could not contact 11 (8.7)
Of those who refused:
Young person 55 (55.0)
Parent / caregiver 19 (19.0)
Both 25 (25.0)
Missing 1 (1.0)
Total who did not consent 127 (12.8)
Missing consent information 34 (3.4)
4
2. Family therapy and TAU interventions
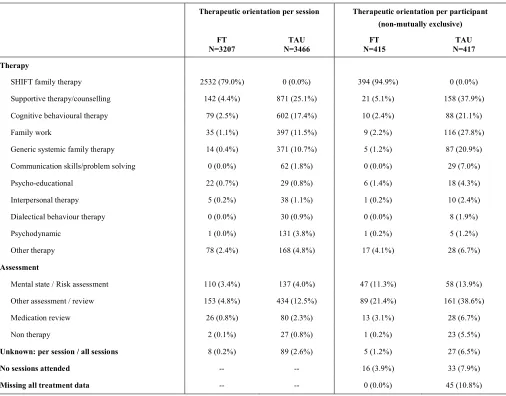
Therapeutic interventions for both arms of the trial were delivered within CAMHS, and all participants were treated within their local service. Family therapists were formally linked with specific CAMHS teams to ensure lines of clinical responsibility were clear. Appendix Table 2 sets out the broad therapeutic orientation of sessions delivered.
All therapists (FT and TAU) were able to exercise their clinical judgement and make referrals to colleagues where they deemed this was clinically necessary, for example, access to local child and adolescent psychiatrists if medication or hospitalisation needed to be considered, or to colleagues with different assessment and therapeutic skills if specialised assessments or alternative treatments for problems other than self-harm were required. Without this condition local services would not have consented to randomisation of high risk participants.
Family Therapy: The funder specified a family intervention. There are many schools of family therapy (FT), but much of the outcome literature focuses on more structural/ behavioural model1. In the UK, the predominant model of family therapy is less behavioural and integrates different approaches and models allowing greater clinical flexibility than is usually the case with more narrowly defined models. The authors had available an existing FT manual derived from detailed observations of actual practice, the development and validation of which was funded by the Medical Research Council (MRC) to support trials of FT2. As this was a pragmatic trial the authors wished to evaluate a form of FT that was widely practised in the UK, and so adapted this existing manual to have an additional, significant focus on self-harm and risk assessment. This step also had the advantage of making the trial more acceptable to local clinical services.
The theoretical approach of the manual (available online3) allows for flexibility and integration of a broad range of conceptualizations from within the field of family therapy and other therapeutic approaches. It emphasizes the relational context of problems that families bring to therapy and that language, meaning, behaviour and emotions are all part of the change process. The manual permitted seeing the adolescent alone or in parallel sessions with a team member seeing the parents, and it encouraged the use of a reflecting team.
FT sessions lasted approximately 1¼ hours and were delivered over 6 months at approximately monthly intervals, though more frequently initially. The intention was to offer approximately 8 sessions according to clinical need. It was expected that some participants would receive fewer sessions due to drop-out or mutually agreed-upon termination of treatment. Equally, it was expected that some might receive more sessions (within the predefined 6-month period or extending beyond 6 months) where this was deemed clinically appropriate. Clinical data indicated that the average number of sessions offered in UK CAMHS clinics was around 6.
Clinicians also told us that young people who had self-harmed were difficult to engage in longer-term treatment. As this was a pragmatic trial we designed an intervention that would be broadly equivalent in ‘dose’ (number of sessions) to TAU, and likely to be attended by participants and funded by the UK health care system. Delivering a more intensive intervention in real world settings would not have been feasible.
Wherever possible, and where consent was provided, sessions were video-recorded as this is part of good family therapy practice and facilitates supervision. In addition, this procedure facilitated central review of a selection of sessions to monitor adherence to the manual.
Qualified Family Therapists (those eligible for registration with the UK Council for Psychotherapy, UKCP, the highest level of accreditation in the UK) were appointed specifically to work on the trial. Therapists recruited to the study were expected to be at a senior grade usually requiring a minimum of 3 years post-qualifying practice. They were therefore senior and experienced practitioners.
Family therapists worked in teams of 3, one interviewing and two observing the family, and provided trial FT as a team for a cluster of CAMH services. Before the start of the trial SHIFT family therapists attended two days of group training and conducted a supervised pilot case before being assessed as ready to treat trial participants. One FT interviewing and two FTs observing the family, were expected to be present for most sessions. Once the trial had started the two senior trial family therapists (PB & IE) conducted monthly two-hour group supervision with each team. If a family therapist left during the trial, replacement therapists received 1-to-1 training with a senior SHIFT supervisor (PB or IE), a period of observation of team members’ therapy, and a 1-to-1 session with the supervisor.
the number and timing of sessions was as planned. With consent, sessions were video-recorded to facilitate supervision. A random sample of videotapes (at least two per therapist) were independently rated to measure adherence to the core elements of the manualised family therapy, using a structured rating scale4 (scored 0-5 for adherence, 0-6 for competence; higher scores indicate greater adherence / competence).
Strength of therapeutic alliance was reported by the young person, caregiver and SHIFT family therapist at the participant’s third treatment session using the SOFTA questionnaire in which higher scores (ranging 0 to 80) represent greater alliance. The young person and therapist reported similar overall levels of alliance whilst caregivers consistently reported the highest levels of alliance, with overall alliance 57.9 (95% CI 56.7, 59.2, n=274) for the young person, 57.5 (95% CI 56.5, 58.4, n=293) for the family therapist and 65.4 (95% CI 64.4, 66.4, n=279) for the caregiver.
Contamination:The possibility of cross-arm contamination was considered during the design stage of the trial. Due to the nature of appointment scheduling, and the fact that this was family-specific therapy (that is, not a group intervention), there was little opportunity for participants to meet and discuss treatment, so contamination resulting from participant discussion was deemed very unlikely. In addition, SHIFT family therapists were prohibited from treating participants within the TAU arm for the duration of the trial. Any family-orientated clinical interventions in the TAU group were likely to be different from the trial FT intervention, which required adherence to the manual by fully-trained family therapists eligible for United Kingdom Council for
Psychotherapy (UKCP) registration. SHIFT family therapists were also precluded from providing supervision to any TAU cases being seen within their own service. During the course of the study the SHIFT family therapy manual was embargoed.
6
Table 2: Therapeutic orientation of all sessions and per participant
Therapeutic orientation per session Therapeutic orientation per participant (non-mutually exclusive) FT
N=3207
TAU N=3466
FT N=415
TAU N=417 Therapy
SHIFT family therapy 2532 (79.0%) 0 (0.0%) 394 (94.9%) 0 (0.0%)
Supportive therapy/counselling 142 (4.4%) 871 (25.1%) 21 (5.1%) 158 (37.9%)
Cognitive behavioural therapy 79 (2.5%) 602 (17.4%) 10 (2.4%) 88 (21.1%)
Family work 35 (1.1%) 397 (11.5%) 9 (2.2%) 116 (27.8%)
Generic systemic family therapy 14 (0.4%) 371 (10.7%) 5 (1.2%) 87 (20.9%)
Communication skills/problem solving 0 (0.0%) 62 (1.8%) 0 (0.0%) 29 (7.0%)
Psycho-educational 22 (0.7%) 29 (0.8%) 6 (1.4%) 18 (4.3%)
Interpersonal therapy 5 (0.2%) 38 (1.1%) 1 (0.2%) 10 (2.4%)
Dialectical behaviour therapy 0 (0.0%) 30 (0.9%) 0 (0.0%) 8 (1.9%)
Psychodynamic 1 (0.0%) 131 (3.8%) 1 (0.2%) 5 (1.2%)
Other therapy 78 (2.4%) 168 (4.8%) 17 (4.1%) 28 (6.7%)
Assessment
Mental state / Risk assessment 110 (3.4%) 137 (4.0%) 47 (11.3%) 58 (13.9%)
Other assessment / review 153 (4.8%) 434 (12.5%) 89 (21.4%) 161 (38.6%)
Medication review 26 (0.8%) 80 (2.3%) 13 (3.1%) 28 (6.7%)
Non therapy 2 (0.1%) 27 (0.8%) 1 (0.2%) 23 (5.5%)
Unknown: per session / all sessions 8 (0.2%) 89 (2.6%) 5 (1.2%) 27 (6.5%)
No sessions attended -- -- 16 (3.9%) 33 (7.9%)
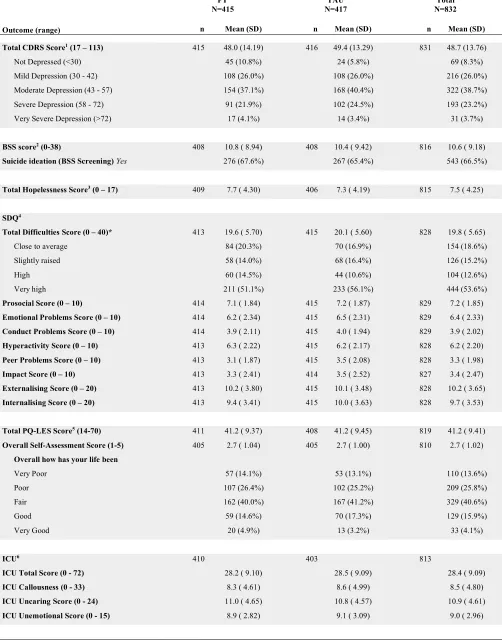
3. Full young person and caregiver scores at baseline
Table 3: Full baseline young person question scores and subscales
FT
N=415 N=417 TAU N=832 Total
Outcome (range) n Mean (SD) n Mean (SD) n Mean (SD)
Total CDRS Score1 (17 – 113) 415 48.0 (14.19) 416 49.4 (13.29) 831 48.7 (13.76)
Not Depressed (<30) 45 (10.8%) 24 (5.8%) 69 (8.3%)
Mild Depression (30 - 42) 108 (26.0%) 108 (26.0%) 216 (26.0%)
Moderate Depression (43 - 57) 154 (37.1%) 168 (40.4%) 322 (38.7%)
Severe Depression (58 - 72) 91 (21.9%) 102 (24.5%) 193 (23.2%)
Very Severe Depression (>72) 17 (4.1%) 14 (3.4%) 31 (3.7%)
BSS score2 (0-38) 408 10.8 ( 8.94) 408 10.4 ( 9.42) 816 10.6 ( 9.18)
Suicide ideation (BSS Screening) Yes 276 (67.6%) 267 (65.4%) 543 (66.5%)
Total Hopelessness Score3 (0 – 17) 409 7.7 ( 4.30) 406 7.3 ( 4.19) 815 7.5 ( 4.25)
SDQ4
Total Difficulties Score (0 – 40)* 413 19.6 ( 5.70) 415 20.1 ( 5.60) 828 19.8 ( 5.65)
Close to average 84 (20.3%) 70 (16.9%) 154 (18.6%)
Slightly raised 58 (14.0%) 68 (16.4%) 126 (15.2%)
High 60 (14.5%) 44 (10.6%) 104 (12.6%)
Very high 211 (51.1%) 233 (56.1%) 444 (53.6%)
Prosocial Score (0 – 10) 414 7.1 ( 1.84) 415 7.2 ( 1.87) 829 7.2 ( 1.85)
Emotional Problems Score (0 – 10) 414 6.2 ( 2.34) 415 6.5 ( 2.31) 829 6.4 ( 2.33)
Conduct Problems Score (0 – 10) 414 3.9 ( 2.11) 415 4.0 ( 1.94) 829 3.9 ( 2.02)
Hyperactivity Score (0 – 10) 413 6.3 ( 2.22) 415 6.2 ( 2.17) 828 6.2 ( 2.20)
Peer Problems Score (0 – 10) 413 3.1 ( 1.87) 415 3.5 ( 2.08) 828 3.3 ( 1.98)
Impact Score (0 – 10) 413 3.3 ( 2.41) 414 3.5 ( 2.52) 827 3.4 ( 2.47)
Externalising Score (0 – 20) 413 10.2 ( 3.80) 415 10.1 ( 3.48) 828 10.2 ( 3.65)
Internalising Score (0 – 20) 413 9.4 ( 3.41) 415 10.0 ( 3.63) 828 9.7 ( 3.53)
Total PQ-LES Score5 (14-70) 411 41.2 ( 9.37) 408 41.2 ( 9.45) 819 41.2 ( 9.41)
Overall Self-Assessment Score (1-5) 405 2.7 ( 1.04) 405 2.7 ( 1.00) 810 2.7 ( 1.02)
Overall how has your life been
Very Poor 57 (14.1%) 53 (13.1%) 110 (13.6%)
Poor 107 (26.4%) 102 (25.2%) 209 (25.8%)
Fair 162 (40.0%) 167 (41.2%) 329 (40.6%)
Good 59 (14.6%) 70 (17.3%) 129 (15.9%)
Very Good 20 (4.9%) 13 (3.2%) 33 (4.1%)
ICU6 410 403 813
ICU Total Score (0 - 72) 28.2 ( 9.10) 28.5 ( 9.09) 28.4 ( 9.09)
ICU Callousness (0 - 33) 8.3 ( 4.61) 8.6 ( 4.99) 8.5 ( 4.80)
ICU Uncaring Score (0 - 24) 11.0 ( 4.65) 10.8 ( 4.57) 10.9 ( 4.61)
8
FT N=415
TAU N=417
Total N=832
Outcome (range) n Mean (SD) n Mean (SD) n Mean (SD)
McMaster FAD7 (1 – 4)
Overall FAD Score 404 2.5 ( 0.33) 405 2.4 ( 0.36) 809 2.5 ( 0.35)
General Functioning 410 2.5 ( 0.53) 408 2.5 ( 0.56) 818 2.5 ( 0.54)
Unhealthy (≥2.0) 354 (86.3%) 339 (83.1%) 693 (84.7%)
Behaviour Control Subscale 413 2.1 ( 0.38) 409 2.1 ( 0.37) 822 2.1 ( 0.38)
Unhealthy (≥1.9) 319 (77.2%) 311 (76.0%) 630 (76.6%)
Affective Involvement Subscale 412 2.5 ( 0.48) 409 2.5 ( 0.49) 821 2.5 ( 0.48)
Unhealthy (≥2.1) 345 (83.7%) 341 (83.4%) 686 (83.6%)
Affective Responsiveness Subscale 410 2.6 ( 0.48) 408 2.6 ( 0.51) 818 2.6 ( 0.50)
Unhealthy (≥2.2) 343 (83.7%) 335 (82.1%) 678 (82.9%)
Roles Subscale 412 2.5 ( 0.35) 409 2.5 ( 0.37) 821 2.5 ( 0.36)
Unhealthy (≥2.3) 310 (75.2%) 309 (75.6%) 619 (75.4%)
Communication Subscale 413 2.6 ( 0.37) 409 2.6 ( 0.38) 822 2.6 ( 0.37)
Unhealthy (≥2.2) 360 (87.2%) 343 (83.9%) 703 (85.5%)
Problem Solving Subscale 410 2.5 ( 0.47) 409 2.5 ( 0.53) 819 2.5 ( 0.50)
Unhealthy (≥2.2) 331 (80.7%) 306 (74.8%) 637 (77.8%)
1 CDRS - Children’s Depression Rating Scale: Higher scores represent greater levels of depression. 2 BSS - Beck Scale for Suicide Ideation: Higher scores indicate a higher level of suicide ideation.Median presented as scores considerably skewed and zero inflated at follow up.
3 Hopelessness Scale for Children: Higher scores reflect greater hopelessness or negative expectations toward the future.
4 SDQ - Strengths and Difficulties Questionnaire: Higher scores represent greater levels of concern in all categories bar prosocial where the reverse is true.
5 PQ-LES - Paediatric quality of Life Enjoyment and Satisfaction measure: Higher scores indicative of greater enjoyment and satisfaction.
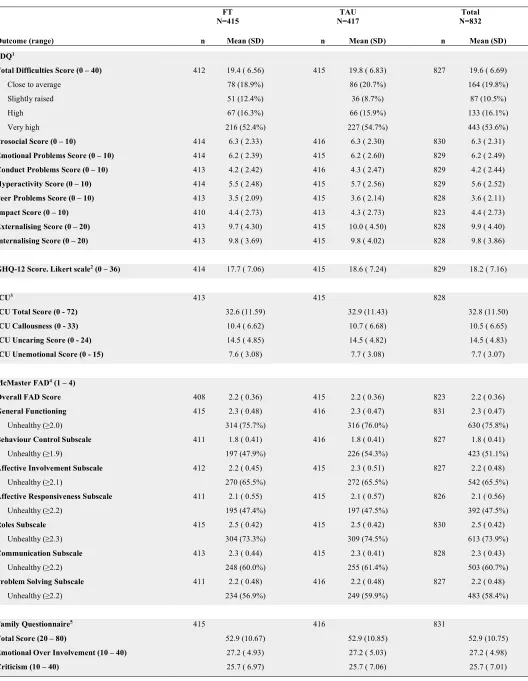
Table 4: Full baseline caregiver question scores and subscales
FT N=415
TAU N=417
Total N=832
Outcome (range) n Mean (SD) n Mean (SD) n Mean (SD)
SDQ1
Total Difficulties Score (0 – 40) 412 19.4 ( 6.56) 415 19.8 ( 6.83) 827 19.6 ( 6.69)
Close to average 78 (18.9%) 86 (20.7%) 164 (19.8%)
Slightly raised 51 (12.4%) 36 (8.7%) 87 (10.5%)
High 67 (16.3%) 66 (15.9%) 133 (16.1%)
Very high 216 (52.4%) 227 (54.7%) 443 (53.6%)
Prosocial Score (0 – 10) 414 6.3 ( 2.33) 416 6.3 ( 2.30) 830 6.3 ( 2.31)
Emotional Problems Score (0 – 10) 414 6.2 ( 2.39) 415 6.2 ( 2.60) 829 6.2 ( 2.49)
Conduct Problems Score (0 – 10) 413 4.2 ( 2.42) 416 4.3 ( 2.47) 829 4.2 ( 2.44)
Hyperactivity Score (0 – 10) 414 5.5 ( 2.48) 415 5.7 ( 2.56) 829 5.6 ( 2.52)
Peer Problems Score (0 – 10) 413 3.5 ( 2.09) 415 3.6 ( 2.14) 828 3.6 ( 2.11)
Impact Score (0 – 10) 410 4.4 ( 2.73) 413 4.3 ( 2.73) 823 4.4 ( 2.73)
Externalising Score (0 – 20) 413 9.7 ( 4.30) 415 10.0 ( 4.50) 828 9.9 ( 4.40)
Internalising Score (0 – 20) 413 9.8 ( 3.69) 415 9.8 ( 4.02) 828 9.8 ( 3.86)
GHQ-12 Score. Likert scale2 (0 – 36) 414 17.7 ( 7.06) 415 18.6 ( 7.24) 829 18.2 ( 7.16)
ICU3 413 415 828
ICU Total Score (0 - 72) 32.6 (11.59) 32.9 (11.43) 32.8 (11.50)
ICU Callousness (0 - 33) 10.4 ( 6.62) 10.7 ( 6.68) 10.5 ( 6.65)
ICU Uncaring Score (0 - 24) 14.5 ( 4.85) 14.5 ( 4.82) 14.5 ( 4.83)
ICU Unemotional Score (0 - 15) 7.6 ( 3.08) 7.7 ( 3.08) 7.7 ( 3.07)
McMaster FAD4 (1 – 4)
Overall FAD Score 408 2.2 ( 0.36) 415 2.2 ( 0.36) 823 2.2 ( 0.36)
General Functioning 415 2.3 ( 0.48) 416 2.3 ( 0.47) 831 2.3 ( 0.47)
Unhealthy (≥2.0) 314 (75.7%) 316 (76.0%) 630 (75.8%)
Behaviour Control Subscale 411 1.8 ( 0.41) 416 1.8 ( 0.41) 827 1.8 ( 0.41)
Unhealthy (≥1.9) 197 (47.9%) 226 (54.3%) 423 (51.1%)
Affective Involvement Subscale 412 2.2 ( 0.45) 415 2.3 ( 0.51) 827 2.2 ( 0.48)
Unhealthy (≥2.1) 270 (65.5%) 272 (65.5%) 542 (65.5%)
Affective Responsiveness Subscale 411 2.1 ( 0.55) 415 2.1 ( 0.57) 826 2.1 ( 0.56)
Unhealthy (≥2.2) 195 (47.4%) 197 (47.5%) 392 (47.5%)
Roles Subscale 415 2.5 ( 0.42) 415 2.5 ( 0.42) 830 2.5 ( 0.42)
Unhealthy (≥2.3) 304 (73.3%) 309 (74.5%) 613 (73.9%)
Communication Subscale 413 2.3 ( 0.44) 415 2.3 ( 0.41) 828 2.3 ( 0.43)
Unhealthy (≥2.2) 248 (60.0%) 255 (61.4%) 503 (60.7%)
Problem Solving Subscale 411 2.2 ( 0.48) 416 2.2 ( 0.48) 827 2.2 ( 0.48)
Unhealthy (≥2.2) 234 (56.9%) 249 (59.9%) 483 (58.4%)
Family Questionnaire5 415 416 831
Total Score (20 – 80) 52.9 (10.67) 52.9 (10.85) 52.9 (10.75)
Emotional Over Involvement (10 – 40) 27.2 ( 4.93) 27.2 ( 5.03) 27.2 ( 4.98)
10 1 SDQ - Strengths and Difficulties Questionnaire: Higher scores represent greater levels of concern in all categories bar prosocial where the reverse is true.
4. Full young person and caregiver scores on secondary outcomes at 12 and 18 months
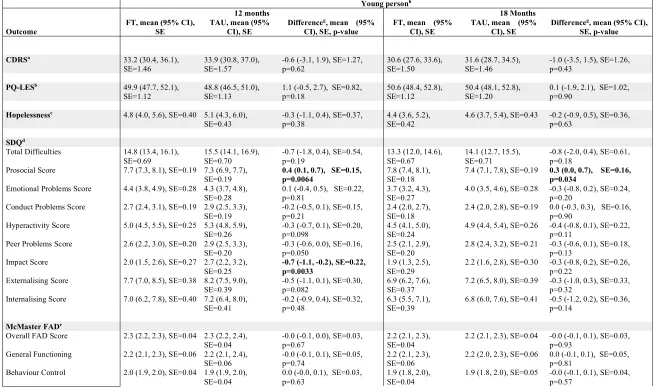
Table 5: Mean young-person questionnaire scores with 95% Confidence Intervals for young person questionnaire outcomes at 12 and 18 months, adjusted for baseline score and covariates with multiple imputationi
Young personh
12 months 18 Months
Outcome FT, mean (95% CI), SE TAU, mean (95% CI), SE Difference
g, mean (95%
CI), SE, p-value FT, mean (95% CI), SE TAU, mean (95% CI), SE Difference
g, mean (95% CI),
SE, p-value
CDRSa 33.2 (30.4, 36.1),
SE=1.46
33.9 (30.8, 37.0), SE=1.57
-0.6 (-3.1, 1.9), SE=1.27, p=0.62
30.6 (27.6, 33.6), SE=1.50
31.6 (28.7, 34.5), SE=1.46
-1.0 (-3.5, 1.5), SE=1.26, p=0.43
PQ-LESb 49.9 (47.7, 52.1),
SE=1.12 48.8 (46.5, 51.0), SE=1.13 1.1 (-0.5, 2.7), SE=0.82, p=0.18 50.6 (48.4, 52.8), SE=1.12 50.4 (48.1, 52.8), SE=1.20 0.1 (-1.9, 2.1), SE=1.02, p=0.90
Hopelessnessc 4.8 (4.0, 5.6), SE=0.40 5.1 (4.3, 6.0), SE=0.43
-0.3 (-1.1, 0.4), SE=0.37, p=0.38
4.4 (3.6, 5.2), SE=0.42
4.6 (3.7, 5.4), SE=0.43 -0.2 (-0.9, 0.5), SE=0.36, p=0.63
SDQd
Total Difficulties 14.8 (13.4, 16.1), SE=0.69
15.5 (14.1, 16.9), SE=0.70
-0.7 (-1.8, 0.4), SE=0.54, p=0.19
13.3 (12.0, 14.6), SE=0.67
14.1 (12.7, 15.5), SE=0.71
-0.8 (-2.0, 0.4), SE=0.61, p=0.18
Prosocial Score 7.7 (7.3, 8.1), SE=0.19 7.3 (6.9, 7.7), SE=0.19
0.4 (0.1, 0.7), SE=0.15, p=0.0064
7.8 (7.4, 8.1), SE=0.18
7.4 (7.1, 7.8), SE=0.19 0.3 (0.0, 0.7), SE=0.16, p=0.034
Emotional Problems Score 4.4 (3.8, 4.9), SE=0.28 4.3 (3.7, 4.8),
SE=0.28 0.1 (-0.4, 0.5), SE=0.22, p=0.81 3.7 (3.2, 4.3), SE=0.27 4.0 (3.5, 4.6), SE=0.28 -0.3 (-0.8, 0.2), SE=0.24, p=0.20 Conduct Problems Score 2.7 (2.4, 3.1), SE=0.19 2.9 (2.5, 3.3),
SE=0.19
-0.2 (-0.5, 0.1), SE=0.15, p=0.21
2.4 (2.0, 2.7), SE=0.18
2.4 (2.0, 2.8), SE=0.19 0.0 (-0.3, 0.3), SE=0.16, p=0.90
Hyperactivity Score 5.0 (4.5, 5.5), SE=0.25 5.3 (4.8, 5.9),
SE=0.26 -0.3 (-0.7, 0.1), SE=0.20, p=0.098 4.5 (4.1, 5.0), SE=0.24 4.9 (4.4, 5.4), SE=0.26 -0.4 (-0.8, 0.1), SE=0.22, p=0.11 Peer Problems Score 2.6 (2.2, 3.0), SE=0.20 2.9 (2.5, 3.3),
SE=0.20
-0.3 (-0.6, 0.0), SE=0.16, p=0.050
2.5 (2.1, 2.9), SE=0.20
2.8 (2.4, 3.2), SE=0.21 -0.3 (-0.6, 0.1), SE=0.18, p=0.13
Impact Score 2.0 (1.5, 2.6), SE=0.27 2.7 (2.2, 3.2), SE=0.25
-0.7 (-1.1, -0.2), SE=0.22, p=0.0033
1.9 (1.3, 2.5), SE=0.29
2.2 (1.6, 2.8), SE=0.30 -0.3 (-0.8, 0.2), SE=0.26, p=0.22
Externalising Score 7.7 (7.0, 8.5), SE=0.38 8.2 (7.5, 9.0),
SE=0.39 -0.5 (-1.1, 0.1), SE=0.30, p=0.082 6.9 (6.2, 7.6), SE=0.37 7.2 (6.5, 8.0), SE=0.39 -0.3 (-1.0, 0.3), SE=0.33, p=0.32 Internalising Score 7.0 (6.2, 7.8), SE=0.40 7.2 (6.4, 8.0),
SE=0.41
-0.2 (-0.9, 0.4), SE=0.32, p=0.48
6.3 (5.5, 7.1), SE=0.39
6.8 (6.0, 7.6), SE=0.41 -0.5 (-1.2, 0.2), SE=0.36, p=0.14
McMaster FADe
Overall FAD Score 2.3 (2.2, 2.3), SE=0.04 2.3 (2.2, 2.4), SE=0.04
-0.0 (-0.1, 0.0), SE=0.03, p=0.67
2.2 (2.1, 2.3), SE=0.04
2.2 (2.1, 2.3), SE=0.04 -0.0 (-0.1, 0.1), SE=0.03, p=0.93
General Functioning 2.2 (2.1, 2.3), SE=0.06 2.2 (2.1, 2.4), SE=0.06
-0.0 (-0.1, 0.1), SE=0.05, p=0.74
2.2 (2.1, 2.3), SE=0.06
2.2 (2.0, 2.3), SE=0.06 0.0 (-0.1, 0.1), SE=0.05, p=0.81
Behaviour Control 2.0 (1.9, 2.0), SE=0.04 1.9 (1.9, 2.0), SE=0.04
0.0 (-0.0, 0.1), SE=0.03, p=0.63
1.9 (1.8, 2.0), SE=0.04
12 Young personh
12 months 18 Months
Outcome FT, mean (95% CI), SE TAU, mean (95% CI), SE Difference
g, mean (95%
CI), SE, p-value FT, mean (95% CI), SE TAU, mean (95% CI), SE Difference
g, mean (95% CI),
SE, p-value
Affective Involvement 2.4 (2.3, 2.5), SE=0.05 2.4 (2.3, 2.5), SE=0.05
-0.1 (-0.1, 0.0), SE=0.04, p=0.22
2.3 (2.2, 2.4), SE=0.05
2.4 (2.3, 2.5), SE=0.06 -0.1 (-0.2, 0.0), SE=0.05, p=0.16
Affective Responsiveness 2.4 (2.3, 2.5), SE=0.06 2.4 (2.3, 2.6),
SE=0.06 -0.0 (-0.1, 0.1), SE=0.05, p=0.66 2.4 (2.3, 2.5), SE=0.06 2.4 (2.3, 2.5), SE=0.06 -0.0 (-0.1, 0.1), SE=0.05, p=0.94 Roles 2.3 (2.2, 2.4), SE=0.04 2.3 (2.2, 2.4),
SE=0.04 -0.0 (-0.1, 0.0), SE=0.03, p=0.46 2.2 (2.2, 2.3), SE=0.04 2.2 (2.2, 2.3), SE=0.04 -0.0 (-0.1, 0.1), SE=0.04, p=0.87 Communication 2.4 (2.3, 2.5), SE=0.04 2.4 (2.3, 2.4),
SE=0.04
0.0 (-0.0, 0.1), SE=0.04, p=0.26
2.3 (2.2, 2.4), SE=0.05
2.3 (2.2, 2.4), SE=0.05 0.0 (-0.1, 0.1), SE=0.04, p=0.78
Problem Solving 2.3 (2.2, 2.4), SE=0.05 2.3 (2.2, 2.4),
SE=0.05 -0.0 (-0.1, 0.1), SE=0.04, p=0.81 2.2 (2.1, 2.3), SE=0.05 2.2 (2.1, 2.3), SE=0.05 -0.0 (-0.1, 0.1), SE=0.05, p=0.61
BSS f
Suicide ideation screening: yes 0.26 (0.17, 0.36), SE=0.05 0.36 (0.25, 0.46), SE=0.05 0.64 (0.44, 0.94), p=0.024 0.22 (0.14, 0.31), SE=0.04 0.28 (0.18, 0.37), SE=0.05 0.76 (0.49, 1.16), p=0.20
a CDRS - Children’s Depression Rating Scale: Higher scores represent greater levels of depression.
b PQ-LES - Paediatric quality of Life Enjoyment and Satisfaction measure: Higher scores indicative of greater enjoyment and satisfaction. c Hopelessness scale for Children: Higher scores reflect greater hopelessness or negative expectations toward the future.
d SDQ - Strengths and Difficulties Questionnaire: Higher scores represent greater levels of concern in all categories bar prosocial where the reverse is true. e FAD - McMaster Family Assessment Device: Higher scores are indicative of poorer family functioning.
f BSS - Beck Scale for Suicide Ideation screening – binary outcome. FT and TAU estimates reflect the proportion with suicide ideation, the difference represents the odds
ratio.
g Difference: FT – TAU for continuous outcomes, Odds ratio for binary BSS outcome.
h Estimates derived using multiple imputation of missing data. Complete data was available for a maximum of 261/415 FT and 204/417 TAU participants at 12 months, and
213/415 FT and 182/417 TAU participants at 18 months for participants who had completed the young person booklet. Note slightly less complete data was available for the CDRS, collected through researcher interview.
I Multiple imputation, assuming data were “Missing at Random”, was used to account for missing questionnaire data5; the complete case formed a sensitivity analysis. Using the Markov Chain Monte Carlo method, results from 33 imputations (according to 33% missing data across all time-points) were combined using Rubin’s rules6. Missing
Table 6: Mean young-person questionnaire scores with 95% Confidence Intervals for caregiver questionnaire outcomes at 12 and 18 months, adjusted for baseline score and covariates with multiple imputationg
Caregiverf
12 months 18 Months
Outcome
FT, mean (95% CI), SE
TAU, mean (95% CI), SE
Differencee, mean (95%
CI), SE, p-value
FT, mean (95% CI), SE
TAU, mean (95% CI), SE
Differencee, mean (95%
CI), SE, p-value
GHQ-12a 12.8 (11.6, 14.0),
SE=0.61
13.5 (12.3, 14.8), SE=0.65
-0.7 (-1.8, 0.3), SE=0.54, p=0.19
13.0 (11.8, 14.2), SE=0.62
13.2 (11.8, 14.6), SE=0.71
-0.2 (-1.3, 0.9), SE=0.57, p=0.73
Family Questionnaire (3 & 6m)b
Total Score 50.9 (49.0, 52.7),
SE=0.96 50.2 (48.3, 52.0), SE=0.95 0.7 (-0.7, 2.1), SE=0.73, p=0.34 47.4 (45.3, 49.4), SE=1.06 48.8 (46.7, 50.9), SE=1.07 -1.4 (-3.3, 0.5), SE=0.94, p=0.14
Emotional Sub score 25.9 (24.9, 26.9),
SE=0.50
25.5 (24.6, 26.5), SE=0.50
0.4 (-0.4, 1.1), SE=0.38, p=0.35
23.8 (22.7, 24.9), SE=0.55
24.4 (23.3, 25.5), SE=0.56
-0.6 (-1.6, 0.4), SE=0.50, p=0.26
Criticism Sub score 25.0 (23.9, 26.1),
SE=0.55
24.7 (23.6, 25.8), SE=0.55
0.3 (-0.5, 1.2), SE=0.43, p=0.44
23.6 (22.4, 24.8), SE=0.61
24.4 (23.2, 25.6), SE=0.61
-0.9 (-1.9, 0.2), SE=0.54, p=0.12
SDQc
Total Difficulties 14.1 (12.7, 15.5),
SE=0.72
15.4 (14.0, 16.8), SE=0.71
-1.3 (-2.4, -0.2), SE=0.56, p=0.026
13.2 (11.9, 14.6), SE=0.68
14.9 (13.3, 16.4), SE=0.79
-1.6 (-2.9, -0.4), SE=0.65, p=0.013
Prosocial Score 6.9 (6.5, 7.3), SE=0.21 6.8 (6.4, 7.2),
SE=0.22 0.1 (-0.3, 0.4), SE=0.17, p=0.60 7.1 (6.6, 7.5), SE=0.22 6.9 (6.5, 7.4), SE=0.22 0.2 (-0.2, 0.5), SE=0.18, p=0.39 Emotional Problems Score 4.0 (3.4, 4.5), SE=0.28 4.5 (3.9, 5.1),
SE=0.29
-0.5 (-1.0, -0.1), SE=0.23, p=0.017
3.6 (3.1, 4.2), SE=0.28
4.2 (3.6, 4.8), SE=0.30 -0.6 (-1.1, -0.1), SE=0.25, p=0.022
Conduct Problems Score 3.1 (2.7, 3.4), SE=0.20 3.3 (2.9, 3.7), SE=0.20
-0.3 (-0.6, 0.0), SE=0.17, p=0.093
2.8 (2.4, 3.2), SE=0.20
3.1 (2.7, 3.5), SE=0.21 -0.3 (-0.6, -0.0), SE=0.16, p=0.050
Hyperactivity Score 4.3 (3.8, 4.7), SE=0.24 4.4 (3.9, 4.9), SE=0.25
-0.1 (-0.5, 0.3), SE=0.19, p=0.55
4.3 (3.8, 4.8), SE=0.24
4.5 (4.0, 5.1), SE=0.28 -0.2 (-0.6, 0.2), SE=0.22, p=0.35
Peer Problems Score 2.9 (2.5, 3.3), SE=0.21 3.2 (2.8, 3.6), SE=0.21
-0.3 (-0.7, -0.0), SE=0.17, p=0.037
2.6 (2.2, 3.0), SE=0.20
3.1 (2.7, 3.6), SE=0.23 -0.5 (-0.9, -0.1), SE=0.20, p=0.0092
Impact Score 2.3 (1.7, 2.9), SE=0.31 2.9 (2.2, 3.7), SE=0.37
-0.7 (-1.3, -0.1), SE=0.30, p=0.031
2.4 (1.7, 3.0), SE=0.32
2.6 (1.9, 3.3), SE=0.36 -0.3 (-0.9, 0.3), SE=0.31, p=0.38
Externalising Score 7.3 (6.6, 8.0), SE=0.36 7.7 (6.9, 8.4), SE=0.38
-0.4 (-1.0, 0.2), SE=0.31, p=0.18
7.0 (6.2, 7.8), SE=0.39
7.6 (6.9, 8.4), SE=0.39 -0.7 (-1.3, -0.0), SE=0.32, p=0.045
Internalising Score 6.8 (6.0, 7.7), SE=0.43 7.7 (6.9, 8.6), SE=0.43
-0.9 (-1.5, -0.2), SE=0.34, p=0.011
6.2 (5.4, 7.0), SE=0.41
7.3 (6.3, 8.2), SE=0.48 -1.1 (-1.9, -0.3), SE=0.39, p=0.0074
McMaster FADd
Overall FAD Score 2.1 (2.0, 2.1), SE=0.03 2.1 (2.0, 2.2), SE=0.03
-0.0 (-0.1, 0.0), SE=0.03, p=0.080
2.0 (2.0, 2.1), SE=0.03
2.1 (2.0, 2.1), SE=0.03 -0.0 (-0.1, 0.0), SE=0.03, p=0.64
General Functioning 2.1 (2.0, 2.2), SE=0.04 2.1 (2.0, 2.2),
SE=0.04 -0.0 (-0.1, 0.0), SE=0.04, p=0.24 2.0 (1.9, 2.1), SE=0.05 2.1 (2.0, 2.2), SE=0.04 -0.0 (-0.1, 0.0), SE=0.04, p=0.21 Behaviour Control 1.7 (1.6, 1.8), SE=0.04 1.7 (1.6, 1.8),
SE=0.04
-0.0 (-0.1, 0.1), SE=0.03, p=0.87
1.7 (1.6, 1.7), SE=0.04
1.7 (1.6, 1.8), SE=0.04 -0.0 (-0.1, 0.1), SE=0.03, p=0.82
Affective Involvement 2.1 (2.0, 2.2), SE=0.04 2.1 (2.1, 2.2), SE=0.04
-0.1 (-0.1, 0.0), SE=0.03, p=0.065
2.1 (2.0, 2.2), SE=0.04
14 Caregiverf
12 months 18 Months
Outcome FT, mean (95% CI), SE TAU, mean (95% CI), SE Difference
e, mean (95%
CI), SE, p-value FT, mean (95% CI), SE TAU, mean (95% CI), SE Difference
e, mean (95%
CI), SE, p-value
Affective Responsiveness 2.0 (1.9, 2.1), SE=0.04 2.0 (1.9, 2.1), SE=0.05
-0.0 (-0.1, 0.1), SE=0.04, p=0.67
2.0 (1.9, 2.1), SE=0.05
1.9 (1.9, 2.0), SE=0.05 0.0 (-0.1, 0.1), SE=0.04, p=0.43
Roles 2.4 (2.3, 2.4), SE=0.03 2.5 (2.4, 2.5),
SE=0.04 -0.1 (-0.2, -0.0), SE=0.03, p=0.0020 2.4 (2.3, 2.4), SE=0.04 2.4 (2.3, 2.5), SE=0.04 -0.0 (-0.1, 0.1), SE=0.03, p=0.73 Communication 2.1 (2.0, 2.2), SE=0.04 2.2 (2.1, 2.3),
SE=0.04 -0.0 (-0.1, 0.0), SE=0.03, p=0.13 2.1 (2.0, 2.2), SE=0.04 2.1 (2.1, 2.2), SE=0.04 -0.0 (-0.1, 0.0), SE=0.04, p=0.29 Problem Solving 2.0 (2.0, 2.1), SE=0.04 2.1 (2.0, 2.2),
SE=0.04
-0.0 (-0.1, 0.0), SE=0.03, p=0.26
2.0 (1.9, 2.1), SE=0.04
2.0 (1.9, 2.1), SE=0.04 -0.0 (-0.1, 0.1), SE=0.04, p=0.70
a GHQ-12 - General Health Questionnaire-12: Higher scores are indicative of greater psychological distress. b Family Questionnaire: Higher scores indicate greater levels of expressed emotion.
c SDQ - Strengths and Difficulties Questionnaire: Higher scores represent greater levels of concern in all categories bar prosocial where the reverse is true. d FAD - McMaster Family Assessment Device: Higher scores are indicative of poorer family functioning.
e Difference: FT – TAU
f Estimates derived using multiple imputation of missing data. Complete data were available for a maximum of 254/415 FT and 195/417 TAU participants at 12 months, and
220/415 FT and 176/417 TAU participants at 18 months for participants who had completed caregiver booklet.
g Multiple imputation, assuming data were “Missing at Random”, was used to account for missing questionnaire data5; the complete case formed a sensitivity analysis. Using the Markov Chain Monte Carlo method, results from 33 imputations (according to 33% missing data across all time-points) were combined using Rubin’s rules6. Missing
5. Predictive and process measures
a. Moderator analysis:
Covariates and responses to all baseline questionnaires were explored for moderation. A 5% significance level was used to identify moderation through the interaction of the potential moderator with treatment, irrespective of the main effect of the potential moderator. Analysis was of the ITT population to availability of data (complete case) for each proposed moderator. Proposed moderators included:
• Covariates: age (11-14, 15-17), trust, referral from hospital (yes, no), baseline number of self-harm episodes
(2, >2), type of index self-harm episode (self-poisoning, self-injury, combined), sex (male, female);
• Young person baseline questionnaire responses: BSS; CDRS R; PQ-LES-Q, Hopelessness;
• Caregiver baseline questionnaire responses: Family questionnaire – criticism, emotional over-involvement;
GHQ-12;
• Young person and caregiver baseline questionnaire responses: McMaster FAD - affective involvement,
affective responsiveness, behaviour control communication, general functioning, problem-solving, roles, total score; ICU - callousness, uncaring, unemotional, total score; SDQ - conduct problems, emotional problems, externalising, hyperactivity, impact, internalising, peer problems, prosocial, total difficulties;
• Categorised baseline questionnaire responses: young person BSS, to indicate whether suicidal ideation was
present; young person CDRS-R, to indicate whether depression was present; young person and caregiver
McMaster FAD, to indicate whether family functioning was healthy or unhealthy- affective involvement,
affective responsiveness, behaviour control communication, general functioning, problem-solving, roles.
b. Mediator analysis:
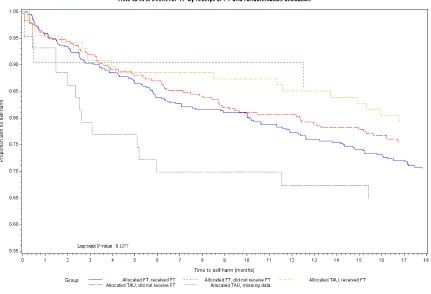
Mediator analysis included both Complier Average Causal Effect (CACE) analysis to model the causal effect of FT receipt on the primary outcome, and further mediation analysis to identify process variables and other potential mediators that influence engagement with and benefit from treatment.
16
Figure 1: Kaplan-Meier plot of time to self-harm by Randomised Treatment group and receipt of Family Therapy
b.2 Further mediation
Methods: Process variables explored as potential mediators included the overall number of sessions attended, the use of psychotropic medications and therapist characteristics. Questionnaire responses were also investigated but results are not presented here due to the significant proportion of missing data.
The Baron and Kenny steps7 were employed to explore mediation:
• Step 1 – establish an effect of randomisation (X) on outcome (Y) that may be mediated
• Step 2 – establish that there is an effect of randomisation (X) on the mediator (M)
• Step 3 – establish that there is an effect of mediator (M) on outcome (Y) while controlling for
randomisation (X)
Following these steps, complete mediation is the case in which randomisation no longer affects the outcome (time to self-harm) after the mediator has been controlled. Partial mediation is the case in which the path from randomisation to time to self-harm is reduced in absolute size but is still different from zero when the mediator is introduced.
Steps 1 and 3 were fitted using a Cox proportional hazards model adjusted for covariates. For the number of sessions, Step 2 was fitted using a linear regression model containing randomised treatment and covariates; for psychotropic medications and therapist characteristics, logistic regression was used containing randomised treatment and covariates apart from NHS trust (owing to lack of convergence).
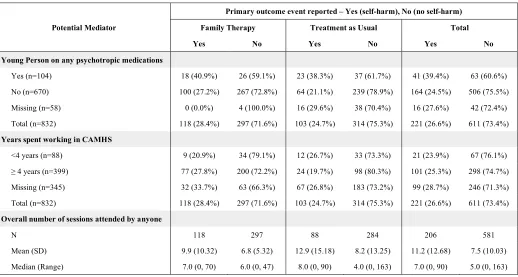
Table 7: Summary of self-harm event by potential process mediator and treatment arm
Primary outcome event reported – Yes (self-harm), No (no self-harm)
Potential Mediator Family Therapy Treatment as Usual Total
Yes No Yes No Yes No
Young Person on any psychotropic medications
Yes (n=104) 18 (40.9%) 26 (59.1%) 23 (38.3%) 37 (61.7%) 41 (39.4%) 63 (60.6%)
No (n=670) 100 (27.2%) 267 (72.8%) 64 (21.1%) 239 (78.9%) 164 (24.5%) 506 (75.5%)
Missing (n=58) 0 (0.0%) 4 (100.0%) 16 (29.6%) 38 (70.4%) 16 (27.6%) 42 (72.4%)
Total (n=832) 118 (28.4%) 297 (71.6%) 103 (24.7%) 314 (75.3%) 221 (26.6%) 611 (73.4%)
Years spent working in CAMHS
<4 years (n=88) 9 (20.9%) 34 (79.1%) 12 (26.7%) 33 (73.3%) 21 (23.9%) 67 (76.1%)
≥ 4 years (n=399) 77 (27.8%) 200 (72.2%) 24 (19.7%) 98 (80.3%) 101 (25.3%) 298 (74.7%)
Missing (n=345) 32 (33.7%) 63 (66.3%) 67 (26.8%) 183 (73.2%) 99 (28.7%) 246 (71.3%)
Total (n=832) 118 (28.4%) 297 (71.6%) 103 (24.7%) 314 (75.3%) 221 (26.6%) 611 (73.4%)
Overall number of sessions attended by anyone
N 118 297 88 284 206 581
Mean (SD) 9.9 (10.32) 6.8 (5.32) 12.9 (15.18) 8.2 (13.25) 11.2 (12.68) 7.5 (10.03)
Median (Range) 7.0 (0, 70) 6.0 (0, 47) 8.0 (0, 90) 4.0 (0, 163) 7.0 (0, 90) 5.0 (0, 163)
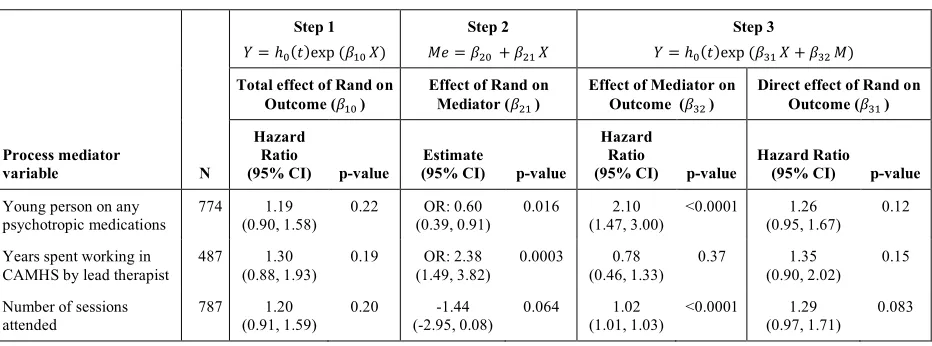
Following the Baron and Kenny steps, there was no evidence that any of the variables investigated formally mediated the effect of treatment on the time to self-harm, largely because of lack of evidence of a treatment effect (step 1) (Supplementary Table 7).
However, there was good evidence (step 2) of an association between randomised treatment and psychotropic medication use during follow-up (less medication in FT: OR 0.6; p = 0.016) and strong evidence (step 3) that the use of psychotropic medication was associated with an increased risk of self-harm (HR 2.10; p < 0.0001). There was, however, no evidence of a direct treatment effect despite the positive association with FT and the mediator (step 3).
There was weak evidence (step 2) of an association between randomised treatment and the number of sessions
(fewer mean sessions in FT: –1.44; p = 0.064) and strong evidence (step 3) that the number of therapy sessions
was associated with the risk of self-harm during follow-up (HR 1.02; p < 0.0001), with risk increasing with more sessions. When the number of sessions attended is accounted for, there is weak evidence of a direct treatment effect (step 3) with an increased risk of self-harm in FT (HR 1.29; p = 0.083).
There was strong evidence (step 2) of an association between treatment group and the length of experience of the lead therapist (more experienced in FT: OR 2.38; p=0.0003), but no evidence that length of experience was associated with the risk of self-harm (step 3).
18
Table 8: Mediators analysis: Assessment of the Baron and Kenny mediation stepsa
Step 1
! = ℎ$(&)exp (,-$ .)
Step 2
/0 = ,1$ + ,1- .
Step 3
! = ℎ$(&)exp (,3- . + ,31 /)
Total effect of Rand on Outcome (,-$ )
Effect of Rand on Mediator (,1- )
Effect of Mediator on Outcome (,31 )
Direct effect of Rand on Outcome (,3- )
Process mediator
variable N
Hazard Ratio
(95% CI) p-value
Estimate
(95% CI) p-value
Hazard Ratio
(95% CI) p-value
Hazard Ratio (95% CI) p-value
Young person on any psychotropic medications
774 1.19 (0.90, 1.58)
0.22 OR: 0.60 (0.39, 0.91)
0.016 2.10 (1.47, 3.00)
<0.0001 1.26 (0.95, 1.67)
0.12
Years spent working in CAMHS by lead therapist
487 1.30 (0.88, 1.93)
0.19 OR: 2.38
(1.49, 3.82)
0.0003 0.78 (0.46, 1.33)
0.37 1.35 (0.90, 2.02)
0.15
Number of sessions attended
787 1.20 (0.91, 1.59)
0.20 -1.44 (-2.95, 0.08)
0.064 1.02 (1.01, 1.03)
<0.0001 1.29 (0.97, 1.71)
0.083
a The effect of Rand is in reference to FT compared to TAU (TAU is the reference category). For psychotropic
6. Comparison of baseline scores with population data
To contextualise the baseline scores, there is good data on a UK population that 10% of children aged 5-15
years score above the clinical threshold on the SDQ (compared with 66.2% in our sample)8. For depression,
most estimates from large epidemiological studies are between 2% and 10% depending on age and severity9.
These studies tend to use diagnostic interviews. However, the CDRS was designed to correlate reasonably well with diagnostic interviews and in our sample, gave a prevalence of 65.7%.
There are fewer population norms available for the FAD but in one study of adults with a range of different psychiatric diagnoses, only 26.1% of families in the control group scored above the clinical cut point, compared
with 61.1–89.5% for families with a member with psychiatric disorder10. Our sample reported 84.7% above the
20
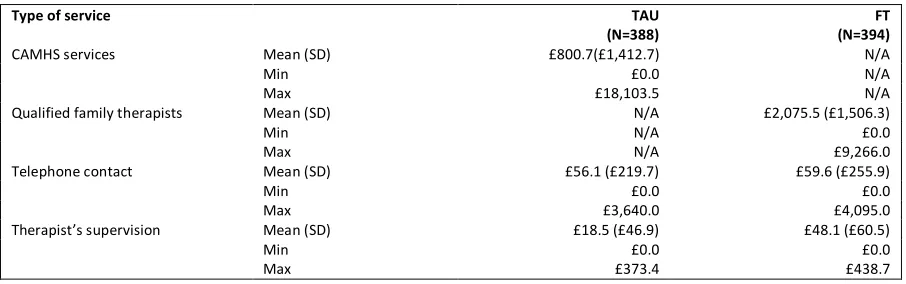
[image:21.595.72.525.111.253.2]7. Health Economics: Intervention costs
Table 9: Average intervention costs by trial arm
Type of service TAU
(N=388) (N=394) FT
CAMHS services Mean (SD) £800.7(£1,412.7) N/A
Min £0.0 N/A
Max £18,103.5 N/A
Qualified family therapists Mean (SD) N/A £2,075.5 (£1,506.3)
Min N/A £0.0
Max N/A £9,266.0
Telephone contact Mean (SD) £56.1 (£219.7) £59.6 (£255.9)
Min £0.0 £0.0
Max £3,640.0 £4,095.0
Therapist’s supervision Mean (SD) £18.5 (£46.9) £48.1 (£60.5)
Min £0.0 £0.0
Table 10: Total costs of NHS resources used by trial arm with multiple imputations*
TAU
(N=388) (N=394)FT (Mann-Whitney test)p-value
Total NHS costs^
(including actual intervention costs) Mean (SD) (£3,786.0) £3,725.5 (£3,766.9) £4,991.70 <0.0001
Median £2,750.0 £3,976.6
Min £164.0 £403.4
Max £29,215.9 £32,085.2
Total actual intervention costs^^ Mean
(SD) (£1,471.2) £875.3 (£1,558.8) £2,183.2 <0.0001
Median £409.6 £1939.5
Min £0.0 £0.0
Max £18,683.5 £9,350.0
Total health and social services costs Mean
(SD) (£1,760.4) £1,403.8 (£1,462.8) £1,259.1 0.12
Median £813.7 £722.8
Min £0.0 £0.0
Max £15,650.0 £12,451.2
Total hospital services costs from NHS Digital records
(inpatient stays and accident and emergency visits)^^ Mean (SD) (£2,217.4) £1,335.9 (£2,550.8) £1,412.9 0.29
Median £812.5 £810.2
Min £0.0 £0.0
Max £15,390.4 £24,190.2
Total reported hospital outpatient visits costs Mean
(SD) (£325.8) £117.7 (£444.6) £136.7 0.78
Median £5.5 £4.5
Min £0.0 £0.0
Max £3,852.8 £7,194.4
Total costs of appointments
post-randomisation but before first treatment appointment^^ Mean (SD) N/A N/A £39.8 £5.3 N/A
Median N/A £28.0
Min N/A £0.0
Max N/A £575.0
Medication costs^^ Mean
(SD) (£11.0) £0.7 (£60.5) £3.3 0.71
Median £0.0 £0.0
Min £0 £0
Max £214.8 £1,197.1
22 ^The cost of appointments that took place after randomisation but before the first treatment appointment in the FT arm is also included. ^^These costs were not
8. Health Economics: Monte Carlo simulation, model parameters
Health economic evaluation studies aim to assess health strategies in terms of their cost-effectiveness and inform public policies. While the within-trial analysis provides an evaluation of the cost-effectiveness restricted to the follow-up horizon of 18 months, the NHS is interested to understand the cost and the consequences between competing treatments beyond the trial follow-up. A longer time horizon will reflect all important differences in costs or consequences between FT and TAU. Decision analysis modelling is key in this context and consists in extrapolating the costs and the consequences using probabilities and assumptions based on the data collected in a trial and literature data extraction. Markov models are recursive (repetitive) decision trees that are used for modelling conditions that have events that may occur repeatedly over time.
[image:24.595.97.283.278.445.2]The model (figure HE.1) included three possible health states: self-harm (SH) defined as self-harming at least once in a period of six months, no self-harming (noSH), and death. Markov models describe participant progression over time through a pathway of health states, with movement between the health states being triggered by events - in this case self-harm events or death.
Figure 2: Three-state Markov model (self-harm – SH, no self-harming - noSH)
The model inputs were derived from the trial data. Specifically, the proportion of the participants beginning in each health state in the model was derived directly from the proportion of participants in the trial who remained in the SH state or moved to noSH. In the first cycle of the model, all participants started from SH in both arms and this was informed by the inclusion criteria for the trial. No participants died over the 18 months of trial follow-up but, to account for possible death, it was assumed that the probability of a participant moving from SH to death or from noSH to death was minimal and equal to 0.0001, regardless of the trial arm. Derivation of the post-18-month transition rates between the different states required extrapolation beyond the follow-up period of the trial.
Any intervention costs were assumed to occur equally over the first 12 months for each arm based on the trial data. Since, it was not possible to distinguish whether these costs were incurred only by those in the SH state, in the noSH state, or both, it was assumed to be the same for any of the states.
Resource use and costs were associated with each health state and participants’ accumulated costs and health benefits in each state over 6-month cycles. Participant cost and utility data were available at 6 months, 12 and 18 months from the trial data and were directly included into the model to estimate longer term costs and health benefits. Death was assumed to be associated with a zero utility and zero cost.
24
Table 11: Markov input parameters (self-harm – SH, no self-harming – noSH, YP - Young People)
Mean Distribution Standard
error Source
Global parameters Discount rate 0.035 Fixed NICE guidance
Health state costs in TAU arm
(6 months) SH £1,182 Lognormal £1,493
SHIFT trial data
Health state costs in TAU arm
(12 months) SH noSH £1,698 £709 Lognormal Lognormal £1,628 £1,116
Death 0 Fixed -
Health state costs in TAU arm
(18 months) SH noSH £1,510 £817 Lognormal Lognormal £1,022 £1,432
Death 0 Fixed -
Health state costs in FT arm (6
months) SH £1,049 Lognormal £1,482
Health state costs in FT arm
(12 months) SH noSH £2,186 £763 Lognormal Lognormal £2,198 £1,228
Death 0 Fixed -
Health state costs in FT arm
(18 months) SH noSH £2,530 £649 Lognormal Lognormal £2,282 £1,054
Death 0 Fixed -
Health state utilities in TAU
arm (6 months) SH 0.760 Beta 0.161
Health state utilities in TAU
arm (12 months) SH noSH 0.751 0.784 Beta Beta 0.187 0.180
Death 0 Fixed -
Health state utilities in TAU arm
(18 months)
SH 0.754 Beta 0.033
noSH 0.808 Beta 0.157
Death 0 Fixed -
Health state utilities in FT arm
(6 months) SH 0.799 Beta 0.178
Health state utilities in FT arm
(12 months) SH noSH 0.793 0.813 Beta Beta 0.184 0.194
Death 0 Fixed -
Health state utilities in FT arm
(18 months) SH noSH 0.732 0.823 Beta Beta 0.239 0.179
Death 0 Fixed -
Transition probabilities
(at 6 months) Proportion YPs stopping SH (noSH) from SH in the TAU arm 0.858 Beta 0.0003
Proportion of YPs stopping SH
(noSH) from SH in the FT arm 0.845 Beta 0.0003
Transition probabilities
(at 12 months) Proportion of YPs stopping SH (noSH) from SH in the TAU arm 0.716 Beta 0.004
Proportion of YPs SH from noSH in
the TAU arm 0.066 Beta 0.0002
Proportion of YPs stopping SH
(noSH) from SH in the FT arm 0.803 Beta 0.003
Proportion of YPs SH from noSH in
Transition probabilities
(at 18 months) Proportion of YPs stopping SH (noSH) from SH in the TAU arm 0.775 Beta 0.004
Proportion of YPs SH from noSH in
the TAU arm 0.063 Beta 0.0002
Proportion of YPs stopping SH
(noSH) from SH in the FT arm 0.684 Beta 0.006
Proportion of YPs SH from noSH in
26
9. References
1. Carr A. The effectiveness of family therapy and systemic interventions for child-focused problems.
Journal of Family Therapy 2009; 31(1): 3-45.
2. Pote H, Stratton P, Cottrell D, Shapiro D, Boston P. Systemic family therapy can be manualised: research process and findings. Journal of Family Therapy 2003; 25: 236-62.
3. Boston P, Eisler I, Cottrell D. Systemic Family Therapy Manual for adolescent Self-Harm. Leeds: University of Leeds; 2009.
https://medhealth.leeds.ac.uk/info/645/psychiatry_and_behavioural_sciences/1365/leeds_family_therapy_and_r esearch_centre Downloaded 05/04/2007
4. Masterson C, Barker C, Jackson D, Boston P. Constructing a SHIFT adherence measure (SAM): the development of a family therapy integrity measure for the SHIFT trial. Journal of Family Therapy 2016; 38: 274-90.
5. Schafer JL. Analysis of incomplete multivariate data. Boca Raton: CRC press; 1997. 6. Rubin DB. Multiple Imputation for Nonresponse in Surveys. . New York: Wiley; 1987.
7. Baron RM, Kenny DA. The moderator-mediator variable distinction in social psychological research: conceptual, strategic and statistical considerations. Journal of Personality and Social Psychology 1986; 51: 1173-82.
8. Meltzer H, Gatward R, Goodman R, et a. Mental Health of Children and Adolescents in Great Britain. London: Stationery Office; 1999.