White Rose Research Online URL for this paper:
http://eprints.whiterose.ac.uk/118911/
Version: Published Version
Article:
Ahmad, Jumana, Swan, Garrett, Bowman, Howard et al. (4 more authors) (2017)
Competitive interactions affect working memory performance for both simultaneous and
sequential stimulus presentation. Scientific Reports. pp. 1-16. ISSN 2045-2322
https://doi.org/10.1038/s41598-017-05011-x
[email protected]
https://eprints.whiterose.ac.uk/
Reuse
This article is distributed under the terms of the Creative Commons Attribution (CC BY) licence. This licence
allows you to distribute, remix, tweak, and build upon the work, even commercially, as long as you credit the
authors for the original work. More information and the full terms of the licence here:
https://creativecommons.org/licenses/
Takedown
If you consider content in White Rose Research Online to be in breach of UK law, please notify us by
www nature com scientificreports
Competitive interactions a ect
working memory performance for
both simultaneous and sequential
stimulus presentation
Jumana Ahmad
Garrett
Swan
Howard
Bowman
Brad
Wyble
Anna C
Nobre
Kimron L
Shapiro & Fiona McNab
Competition between simultaneously presented visual stimuli lengthens reaction time and reduces
both the BOLD response and neural ring In contrast conditions of sequential presentation have been assumed to be free from competition Here we manipulated the spatial proximity of stimuli Near versus Far conditions to examine the e ects of simultaneous and sequential competition on di erent measures of working memory WM for colour With simultaneous presentation the measure of WM precision was signi cantly lower for Near items and participants reported the colour of the wrong item more often These e ects were preserved when the second stimulus immediately followed the rst disappeared when they were separated by ms and were partly recovered evident for our measure
of mis-binding but not WM precision) when the task was altered to encourage participants to maintain
the sequentially presented items together in WM Our results show for the rst time that competition a ects the measure of WM precision and challenge the assumption that sequential presentation removes competition
Objects in a visual scene compete for neural coding during perception. Single cell recordings1–3 and fMRI results indicate mutual suppression of items within the same receptive ield (RF)4, 5. he efects of competitive interac-tions between stimuli are apparent behaviourally, with greater feature similarity between targets and distractors slowing visual search performance e.g. ref. 6.
It has been claimed that the efects of such competition extend beyond ‘perception’ to the higher-level pro-cesses of working memory (WM). Shapiro and Miller7 review evidence to support this assertion, citing Ihssen, Linden, and Shapiro8 (see also ref. 9), who reveal greater WM capacity for eight items presented in two sequen-tial displays, compared to simultaneous presentation of all items. his suggests more items can be held in WM when competition between stimuli is reduced. Here we examine whether the efects of competition extend to WM precision. We do not address whether items compete within WM, we examine whether the efects of competitive-interactions (irrespective of the stage at which they occur) can be observed in the measure of WM precision.
Furthermore, we address whether competition operates only when both items are perceived together or whether items held in WM can also contribute to, or be subject to, the efects of competition. It is oten assumed that conditions in which items are presented sequentially are free from the efects of competition e.g. refs 4 and 5. However, given the recruitment of early visual cortex for WM maintenance10, 11, and evidence for early visual cor-tex providing a cortical basis for the active maintenance of information about features and locations of stimuli12, it is also possible that items held in WM may compete with each other, or with new stimuli that are being encoded.
In order to address these two questions we used the ‘colour wheel’ variant of the change-detection paradigm, which enables WM precision to be estimated e.g. refs 13–15. We manipulated competition by varying the spatial
School of Psychology, University of Birmingham, Birmingham, UK. Department of Forensic and Neurodevelopmental Science, Kings College London, London, UK. Department of Psychology, The Pennsylvania State University, Pennsylvania, USA. Centre for Cognitive Neuroscience and Cognitive Systems (CCNCS), School of Computing, University of Kent, Canterbury, UK. Department of Experimental Psychology and Oxford Centre for Human Brain Activity, University of Oxford, Oxford, UK. Department of Psychology, University of York, York, UK. Correspondence and requests for materials should be addressed to F.M. (email: ona mcnab york ac uk)
Received: 18 January 2017
Accepted: 5 June 2017
Published: xx xx xxxx
proximity within which the stimuli were presented. Manipulating proximity has been shown to inluence per-formance in tasks other than change detection, for example in multiple object identiication and tracking16–18. Consistently, the extent of neural suppression due to competition is inversely related to the degree of spatial sepa-ration between stimuli5. With a suicient distance between stimuli, the efects of competition can be eliminated19. Furthermore, crowding efects reveal another example of substantial interference in identifying one stimulus when other stimuli with similar features are nearby20.
We manipulated the spatial separation of coloured stimuli at encoding irst with simultaneous presentation (Experiment 1), then with sequential presentation (Experiments 2–5). In line with others e.g. ref. 21, we interpret any diference in WM performance between conditions of high spatial separation and conditions of low spatial separation as evidence of competition.
Recent studies have begun to address whether the efects of competition extend to various measures of WM performance. Also using the “colour wheel” approach, Emrich and Ferber21 observed more binding errors (reporting the colour of an uncued item) for the high competition condition, but no diference in WM precision. he spatial distance between stimuli in their high competition condition (3.1°) may explain the absence of a precision diference. hese stimuli were unlikely to compete strongly within primary visual cortex, where RFs are estimated to be less than 2° in monkeys22 and humans5. With our irst experiment, we compared conditions of high and low spatial proximity, presenting the items in the Near condition within 0.6°, to create greater com-petition throughout the visual hierarchy. We examined whether the efects of comcom-petition extend to a measure of WM precision as well as binding.
Using a similar approach, in which participants reproduced the orientation of a bar presented in conditions of high or low spatial crowding, Tamber-Rosenau, Fintzi and Marois23 reported more binding errors (reporting the orientation of an uncued item) in the high crowding condition. his was observed for both a perceptual task in which the stimuli remained on the screen during the response phase, and a WM task in which the stimuli dis-appeared 800 ms prior to the response phase. In their results, the precision with which the orientation was repro-duced was lower for the high crowding condition compared to the low crowding condition only for the perceptual task, not in the WM task. Again, it is possible that the stimuli presented in the high crowding condition were not close enough for the efects of competition to be observed on WM precision.
Apparently contradictory indings were provided by Lin and Luck24, who reported that greater colour simi-larity between items enhanced WM performance. Participants were required to detect changes in colour, which was also the feature used for the competition manipulation. he conlation of the competing feature (colour) and the task demand (colour report) may have accounted for Lin and Luck’s result24. In the current design, the feature dimension used to create competition (spatial proximity) was orthogonal to the response dimension (colour report) and the stimuli were always a ixed distance apart in colour space.
In this way, our ive experiments addressed whether competition between simultaneously-presented proximal stimuli afects various measures of WM performance and whether items held within WM can also contribute to or be subject to the efects of competition.
General Method
All ive experiments were approved by the Ethical Review Committee of the University of Birmingham and were conducted in accordance with the Declaration of Helsinki. Written, informed consent was obtained from all participants.
Experiment
Method
In each trial, participants were asked to retain two simultaneously presented items in WM. In the Near condition, stimuli were positioned 0.25° apart (centre to centre) so that, according to estimates of RF size, they should compete throughout the visual hierarchy. In the Far condition, items were positioned 6.70° apart (centre to centre) such that there should be less competition in most visual areas. he subsequent WM rep-resentation for one of the items was examined by asking participants to use the mouse to indicate the colour of the probed item on a colour wheel cf. refs 13–15. WM performance was assessed using a mixture model15. We used two approaches. First, we adopted the established approach of estimating a separate mixture model for each spatial separation condition and comparing the resulting model parameters using ANOVA e.g. ref. 21, 23. Due to concerns that summary statistics are unreliable for model comparison25, we also used a non-parametric hierarchical model comparison approach in which permutation testing was used to determine whether diferent components of WM performance difered with spatial competition.Participants
Twenty-one students from the University of Birmingham participated in Experiment 1. Data from one participant were removed as they failed to follow instructions on a substantial number of trials, did not perform the phonological suppression task correctly and clicked outside the colour wheel on a large number of trials. Two participants withdrew during the experimental procedure. Data from a further participant were removed as they had a score of more than 3 standard deviations from the group mean for at least one of the WM measures. his let 17 participants (15 females, 2 males; mean age = 22 years, range = 18–32 years).All participants were naive to the purpose of the experiment, and were compensated for their participation with course credit or £6 per hour. All had normal or corrected-to-normal vision, and passed the Farnsworth Munsell Dichotomous D15 Colour Vision Test.
www.nature.com/scientificreports/
of 70 cm throughout the experiment. he stimuli were presented using MATLAB with Psychophysics Toolbox 3 extensions26, 27.
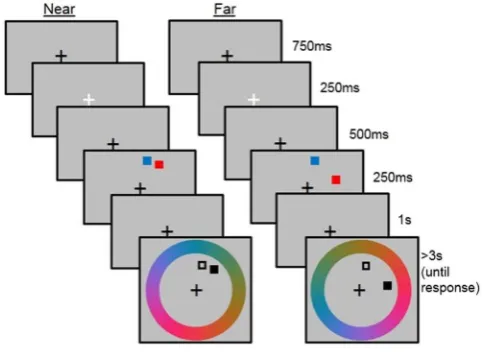
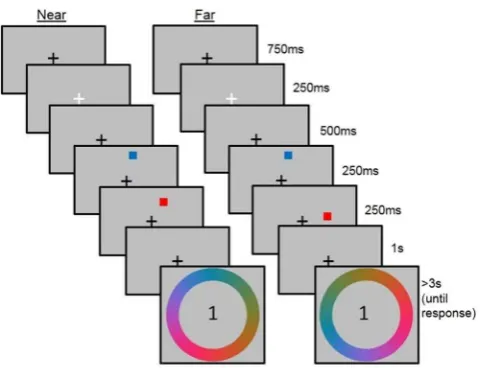
In each trial, participants were asked to encode the colours of two squares (0.21° × 0.21°) appearing along an invisible circle at 5.50° eccentricity. Both squares always appeared in one quadrant of the screen (Fig. 1). he two squares were either 0.25° apart (centre-to-centre; contained within 0.60°; Near condition), or 6.70° apart (centre-to-centre; contained within 7.00°; Far condition). he quadrant in which the squares appeared was varied pseudo-randomly, and counterbalanced across conditions.
Participants were asked to indicate the colour of one of the squares (the target), the position of which was indicated by a black illed square. In the place of the other coloured square (the non-target) a black outline square was shown. Participants were asked to indicate the colour of the target by clicking on a colour wheel; a ring that was 1.60° thick and centred on the monitor with a radius of 9.33° (centre to outer edge). he colour wheel con-sisted of 180 colours, with two degrees on the wheel allocated to each colour. Due to an error in Experiment 1, the colour wheel consisted of 179 colours, with four degrees for one of the colours. Trials featuring a target stimulus of that colour, or the missing colour, were removed from the analysis (no more than three trials per condition, per participant).
he colour values were evenly distributed along a circle in the CIE L*a*b colour space, centred at (L= 70,
a= 22, b= 13), with a radius of 60. he centre was chosen to maximise the radius and the discriminability of the colours cf. ref. 14. All colours were of equal luminance, varying in hue. he colour wheel was rotated randomly for each trial, with 10 possible positions, each separated by 36°, so that the position of the colours could not be predicted.
Each coloured square was illed with one of the colours represented in the colour wheel. Colour allocation was pseudo-random, such that for each pair of squares, the colours difered by 60 colour units (120° on the colour wheel), so that the colour distance between items was equated across all trials. Although this may have made it possible for a participant to infer the colour of a stimulus from the colour of the other stimulus, they would not have been able to infer whether the second stimulus was to 120° clockwise or 120° counter-clockwise to the irst. he same colour pairs were used for stimuli in the Near and Far conditions, to avoid any confound associated with the choice of colours.
Following 30 practice trials, participants completed 640 experimental trials (half were Near trials and half were Far trials, presented in a randomised and unpredictable order). he experiment was divided into four equal length experimental blocks, separated by breaks.
[image:4.595.154.399.46.222.2]Procedure
he trial procedure and durations of presentation are shown in Fig. 1. Each trial began with a black ixation cross (presented for 750 ms), which turned white for 250 ms to prepare participants for the onset of the memory stimuli (the stimuli to be encoded). he memory stimuli (presented for 500 ms) were followed by a 1000 ms delay period, during which time a black ixation cross was displayed. A colour wheel was then shown, together with two squares in the positions that had been occupied by the memory stimuli. One of the stimuli was outlined in black and the other was illed black. Participants were asked to report the colour of the memory stimulus that had been in the position of the illed black square, by clicking on the colour wheel. he colour wheel remained on the screen until for at least 3 s, beyond which it was removed when a response was made. Responses were made using a computer mouse and either the right or let hand. Participants were told to respond as accu-rately as possible, and to maintain ixation in the centre of the screen until a response was required. hey were not told that the stimuli would vary in their spatial separation, and no feedback of task performance was given. In order to minimise the opportunity for verbal rehearsal, participants performed a phonological suppression task throughout the experiment, whereby they repeated three random numbers out loud at an approximate rate of three every two seconds, which was monitored by the experimenter. he numbers changed at each of the three breaks.Data Analysis
Trials in which a participant clicked outside of the colour wheel were removed from the analysis. For each participant and each condition, the distribution of responses was analysed using a probabilistic three-component mixture model15 (http://www.paulbays.com/code). he contribution of each of three compo-nents was estimated using a maximum likelihood approach: target responses (PT, the probability of respondingcorrectly), non-target responses (PNT, the probability of responding with the colour of the unprobed memory
stimulus, which may result from mis-binding the colour and the location), and uniform responses (PU, the
prob-ability of a response that did not match the colour of either of the two memory stimuli, which is interpreted as a guess). From this model, the precision (K) with which items are represented can be estimated using the standard deviation of the circular analogue of Gaussian distributions around both the target and the non-target values. We did not correct for multiple comparisons because we had a priori identiied the precision measure as being key to our hypothesis.
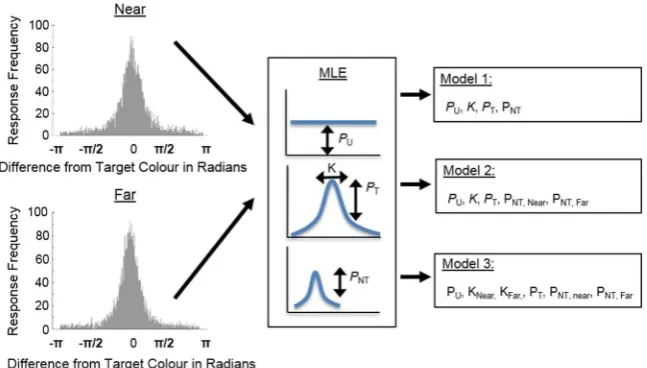
Response distributions for each participant were also subjected to a non-parametric hierarchical model com-parison (illustrated in Fig. 2). his approach enabled us to determine whether, for example, a model in which there were separate values for precision (K) and PNT for the Near and Far conditions provided a better it than a
model in which these parameters did not difer between the Near and Far conditions. Using hierarchical model comparison, we determined whether and how responses difered between Near and Far conditions. For each model, we used the constraint that PT (the probability of correctly reporting the target), PNT (the probability
of reporting the non-target), and PU (the probability of guessing) sum to one. In our “null hypothesis mixture
model” (Model 1), we it the mixture model15 to the data from each participant and made no distinction between Near and Far conditions, i.e., one set of parameter values was used irrespective of condition and participant. We then compared this model to alternative models, which allowed the proportion of non-target responses and pre-cision to vary for the Near and Far conditions.
Results
For each condition, the distribution of responses, relative to the target colour, is shown in Fig. 3a.
Precision
Mean estimates of precision are shown for each condition in Fig. 3b. In line with our prediction, precision was lower for the Near compared to the Far condition (paired t-test t(16) =−2.85, p= 0.012, Cohen’s d: −0.693).P
TP
NTand
P
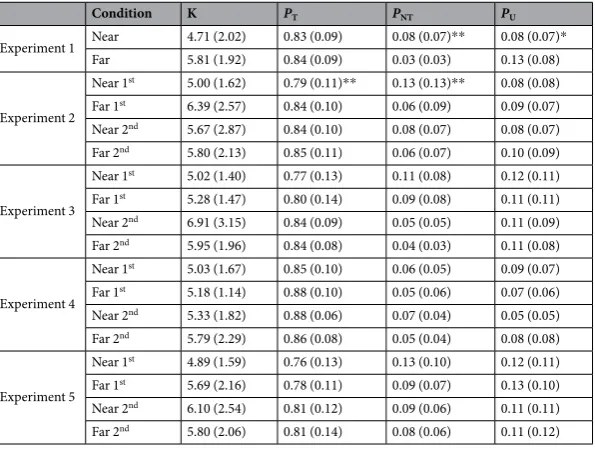
U Estimates for the probability parameters, PT, PNT, and PU are shown in Table 1.The probability of correctly reporting the target (PT) did not differ between conditions (t(16) =−0.07,
p= 0.944, Cohen’s d: −0.018). he probability of incorrectly reporting the non-target (PNT) was signiicantly
greater for the Near condition (t(16) = 4.20, p= 0.001, Cohen’s d: 1.259). he probability of guessing (PU) was
[image:5.595.157.481.46.230.2]greater in the Far condition, (t(16) =−2.28, p= 0.037, Cohen’s d: −0.560). This is discussed further in the General Discussion.
Figure 2. An illustration of the model comparison process. he Near and Far condition data was it using Maximum Likelihood Estimation (MLE). he number of free parameters in the MLE is determined by the Model on the right. PT represents the probability of responding correctly to the target, PNT represents the
probability of responding with the colour of the unprobed memory stimulus (the non-target), PU represents the
probability of a response that did not match the colour of either of the two memory stimuli, which is interpreted as a guess, K represents the precision with which items are represented. In our “null hypothesis mixture model” (Model 1), we it the Bays et al. mixture model15 to the data from each participant and made no distinction between Near and Far conditions. For Model 2, only PNT could vary between Near and Far conditions. For
www.nature.com/scientificreports/
Figure 3. he results of Experiment 1. (a) he distribution of responses relative to the target colour (shown at 0 radians) for the Near and Far conditions, pooled across participants. (b) he mean precision estimates (K) for each condition, calculated using the mixture model outlined by Bays, Catalao, & Husain15. Error bars indicate the standard error of the mean. *Indicates p < 0.05 for the paired t-test between Near and Far conditions.
Condition K PT PNT PU
Experiment 1 Near 4.71 (2.02) 0.83 (0.09) 0.08 (0.07)** 0.08 (0.07)* Far 5.81 (1.92) 0.84 (0.09) 0.03 (0.03) 0.13 (0.08)
Experiment 2
Near 1st 5.00 (1.62) 0.79 (0.11)** 0.13 (0.13)** 0.08 (0.08)
Far 1st 6.39 (2.57) 0.84 (0.10) 0.06 (0.09) 0.09 (0.07)
Near 2nd 5.67 (2.87) 0.84 (0.10) 0.08 (0.07) 0.08 (0.07)
Far 2nd 5.80 (2.13) 0.85 (0.11) 0.06 (0.07) 0.10 (0.09)
Experiment 3
Near 1st 5.02 (1.40) 0.77 (0.13) 0.11 (0.08) 0.12 (0.11)
Far 1st 5.28 (1.47) 0.80 (0.14) 0.09 (0.08) 0.11 (0.11)
Near 2nd 6.91 (3.15) 0.84 (0.09) 0.05 (0.05) 0.11 (0.09)
Far 2nd 5.95 (1.96) 0.84 (0.08) 0.04 (0.03) 0.11 (0.08)
Experiment 4
Near 1st 5.03 (1.67) 0.85 (0.10) 0.06 (0.05) 0.09 (0.07)
Far 1st 5.18 (1.14) 0.88 (0.10) 0.05 (0.06) 0.07 (0.06)
Near 2nd 5.33 (1.82) 0.88 (0.06) 0.07 (0.04) 0.05 (0.05)
Far 2nd 5.79 (2.29) 0.86 (0.08) 0.05 (0.04) 0.08 (0.08)
Experiment 5
Near 1st 4.89 (1.59) 0.76 (0.13) 0.13 (0.10) 0.12 (0.11)
Far 1st 5.69 (2.16) 0.78 (0.11) 0.09 (0.07) 0.13 (0.10)
Near 2nd 6.10 (2.54) 0.81 (0.12) 0.09 (0.06) 0.11 (0.11)
Far 2nd 5.80 (2.06) 0.81 (0.14) 0.08 (0.06) 0.11 (0.12)
[image:6.595.159.457.455.680.2]Model comparison
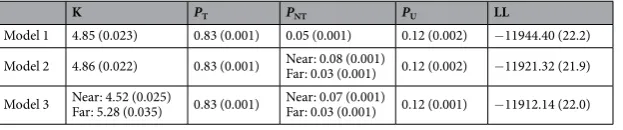
For model 1 we summed the log likelihood (LL), collapsed across participants, which resulted in an LL of −11946.4. Next, we used the same itting procedure, but allowed the PNT parameter to varybetween the Near and Far conditions (Model 2). his irst alternative hypothesis, allowed for the possibility that the only diference between the proximity conditions was the proportion of non-target responses. he resulting summed log likelihood was −11923.3. Lastly, in Model 3, both the PNT and precision parameter values were
allowed to vary. he resulting summed log likelihood was −11914.4.
hese log likelihood values indicate that Model 2 provided a better model it than Model 1, relecting more non-target responses (i.e. higher PNT) for the Near than the Far condition (Table 2, which also shows parameter
estimates for PT, PNT and PU). Furthermore, Model 3 provided a better model it than Model 2, relecting the
lower precision for the Near condition than the Far condition (Fig. 3). To determine whether these diferences in log likelihood were statistically signiicant, a permutation test was conducted on the magnitude of the difer-ences in summed LL between the three models. First, the data were permuted between the Near and Far condi-tions, collapsed across participants. hese permuted data sets were submitted to the same model itting procedure described above for all three mixture models in the hierarchy. Over repeated permutations, we produced a null distribution of the expected diference between the LL values for Model 1 and Model 2. he same procedure was then used to obtain a null distribution of expected LL diferences between Models 2 and 3. We compared the empirically observed diferences in LL to these null distributions. In 1000 permutations, no permutation produced a greater diference than the observed diference for either of these model comparisons (i.e. Model 2 versus Model 1 and Model 3 versus Model 2), which can conservatively be stated as p < 0.001. hus, the model comparison revealed that there were signiicantly more non-target responses for the Near than the Far condition. Furthermore, from the signiicant diference between Model 3 and Model 2 we can conclude that, even when allowing the proportion of non-target responses to vary between conditions, WM precision was signiicantly lower in the Near than the Far condition.
Discussion
he greater number of non-target responses in the Near condition is consistent with a previous claim that compe-tition causes errors in binding21, 23. Importantly, however, our indings indicate that the inluence of competition extends to the measure of WM precision. We show, for the irst time, that items presented within close spatial proximity are reported with lower WM precision, presumably due to greater competition within the visual cortex.
Experiment
he results of Experiment 1 indicates that competition afects the precision of an item, and increases the probabil-ity of mis-binding. It is not clear whether competition is a purely perceptual phenomenon, occurring only when both items are presented together, or whether items that are held in WM can compete. While higher-order neural areas, including the prefrontal, temporal, and parietal cortices, are involved in WM maintenance28–34, according to the sensory recruitment hypothesis of WM see ref. 35, early visual areas involved in perception, including area V1, also support the active maintenance of visual information in WM. Imaging studies e.g. refs 10 and 11 have provided support for this hypothesis. We reasoned that if neurons within the same RF are recruited for the active maintenance of multiple items, as well as the encoding of items that are being perceived, then the efects of competition may still be seen even when the competing items are not presented simultaneously. his would challenge the assumption that items which are presented sequentially are free from the efects of competition e.g. refs 4, 5, 8 and 9.
In Experiment 2, we manipulated the spatial proximity between two items that were presented sequentially. We also examined whether the order of presentation inluenced the extent to which an item was subject to com-petitive efects.
Method
In each trial, participants were asked to retain two sequentially presented items in WM (Stimulus 1 was followed by Stimulus 2). In the Near condition, stimuli were positioned so that Stimulus 2 appeared 0.25° from the location of Stimulus 1 (centre to centre). In the Far condition, Stimulus 2 appeared 6.70° from the location of Stimulus 1 (centre to centre).
Participants
Twenty-seven students from the University of Birmingham gave informed consent to partici-pate in the experiment. Participants were compensated for their time, had normal or corrected-to-normal vision, and passed the Farnsworth Munsell Dichotomous D15 Colour Vision Test. One participant withdrew during theK PT PNT PU LL
Model 1 4.85 (0.023) 0.83 (0.001) 0.05 (0.001) 0.12 (0.002) −11944.40 (22.2)
Model 2 4.86 (0.022) 0.83 (0.001) Near: 0.08 (0.001)
Far: 0.03 (0.001) 0.12 (0.002) −11921.32 (21.9)
Model 3 Near: 4.52 (0.025)
Far: 5.28 (0.035) 0.83 (0.001)
Near: 0.07 (0.001)
[image:7.595.157.469.46.111.2]Far: 0.03 (0.001) 0.12 (0.001) −11912.14 (22.0)
Table 2. Estimates from the mixture models for Experiments 1 calculated using a model in which neither K nor PNT could difer between Near and Far conditions (Model 1), a model in which only PNT could difer
(Model 2) and a model in which both K and PNT could difer (Model 3). he 95% conidence interval is shown in
www.nature.com/scientificreports/
testing procedure. We applied the same outlier criteria as in Experiment 1. his let 22 participants (16 females, 6 males; mean age = 20.5 years, range = 18–30 years).
Stimuli and Design
Stimuli were presented using the same equipment as in Experiment 1. On each trial, participants were asked to encode two squares (0.21° × 0.21°) appearing sequentially for 250 ms each, on aninvisible circle with a radius of 5.50°. Both squares always appeared in the same quadrant of the screen, and the second square appeared at the instant the irst square disappeared. he two squares were either 0.25° apart (centre-to-centre; contained within 0.60°; Near condition), or 6.70° apart (centre-to-centre; contained within 7.00°; Far condition). he quadrant in which the squares appeared was varied pseudo-randomly, and counterbal-anced across conditions.
Participants were asked to indicate the colour of one of the squares (the target) by clicking on the colour wheel. Either the irst or second item was cued by the presentation of the number one or two in the centre of the colour wheel. As with Experiment 1, colour allocation was pseudo-random, such that for each pair of squares, the col-ours difered by 60 colour units (120° on the colour wheel) and the colour distance between items was the same across all trials. he same colour pairs were used for stimuli in the Near and Far conditions, to avoid any confound associated with the choice of colours. Following 30 practice trials, participants completed 192 experimental trials (half were Near trials and half were Far trials, presented in a randomised and unpredictable order). he experi-ment was divided into four equal length experiexperi-mental blocks, separated by self-paced breaks. he trial sequence for Near and Far conditions is shown in Fig. 4 (and also Fig. 5, for comparison with the subsequent experiments).
Procedure
Participants were required to ixate on the ixation cross until they were asked to make a response. Each trial began with a black ixation cross (presented for 750 ms), which turned white for 250 ms to prepare participants for the onset of the irst stimulus to be encoded. he irst stimulus was presented for 250 ms and was immediately followed by the onset of the second stimulus, which was also presented for 250 ms. his was followed by a 1000 ms delay period, during which time a black ixation cross was displayed. Participants then saw a colour wheel and were cued to report the colour of the irst or second stimulus by the number one or two, which was presented inside the colour wheel. All other procedures were maintained from Experiment 1.Results
Figure 6 shows the mean precision estimates (Fig. 6a) and the distribution of responses relative to the target col-our (Fig. 6b) for each condition of Experiments 2–5.
Precision
The ANOVA revealed a significant main effect of proximity (F(1, 21) = 6.65, p= 0.018,ηp2= 0.241), with lower precision for Near trials. here was no main efect of order (F(1, 21) = 0.01, p= 0.918,
ηp2= 0.001), and no signiicant interaction between order and proximity, (F(1, 21) = 1.84, p= 0.190, ηp2= 0.080).
P
TP
NTand
P
U Mean values for the probability parameters, PT,PNT, and PU are shown in Table 1.For the probability of correctly reporting the target, PT, there was a signiicant main efect of proximity (F(1,
21) = 10.77 p= 0.004, ηp2= 0.339), with lower PT for Near than Far trials. here was no signiicant main efect of
order (F(1, 21) = 1.40, p= 0.25, ηp2= 0.063). he interaction between proximity and order just failed to reach
sig-niicance (F(1, 21) = 4.08, p= 0.056, ηp2= 0.163. We further investigated this near-signiicant interaction. here
was a signiicant diference in PT between Near and Far conditions for the irst item (paired t-test: t(21) =−4.49,
p< 0.001) but not the second item, (paired t-test: t(21) =−0.33, p= 0.748).
For the probability of incorrectly reporting the non-target, PNT, there was a signiicant main efect of proximity
(F(1, 20) = 17.66, p< 0.001, ηp2= 0.457), with greater PNT for Near compared to Far trials. here was no
[image:8.595.156.397.43.227.2]signii-cant main efect of order (F(1, 21) = 1.94, p= 0.178, ηp2= 0.084), but there was a signiicant interaction between
proximity and order (F(1, 21) = 5.01, p= 0.036, ηp2= 0.193). here was a greater diference between the Near and
Far conditions for the irst item (paired t-test: t(21) = 4.06, p= 0.001), compared to the second item (paired t-test:
t(21) = 2.02, p= 0.056). his indicates that mis- binding was greater for the Near condition, particularly when the item was irst in the trial.
For the probability of guessing, PU, there was no signiicant main efect of proximity (F(1, 21) = 0.78, p= 0.389,
ηp2= 0.036), no signiicant main efect of order (F(1, 21) = 0.003, p= 0.955, ηp2< 0.01) and no signiicant
inter-action between proximity and order, (F(1, 21) = 0.08, p= 0.780, ηp2= 0.004). Unlike Experiment 1, from which
we observed greater values of PU for the Far condition, Experiment 2 found no diference between Near and Far
conditions. his supports the idea that the diference in PU observed for the Far condition of Experiment 1 may
have been due to participants splitting their attention between the two far-apart regions of space.
[image:9.595.94.553.47.211.2]Model comparison
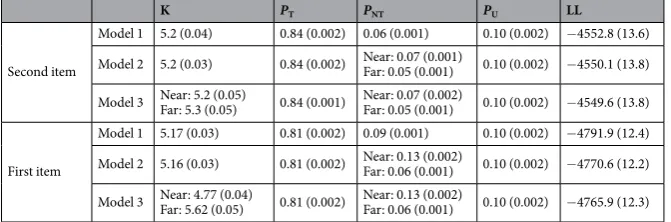
To conirm the above results, model comparison was used again. he model compar-ison was run separately for items presented irst in the trial and items presented second in the trial, to deter-mine the efects of proximity. he parameters and its are displayed in Table 3. For the irst item, Model 2 gave a Figure 5. he trial sequence for the Near conditions of Experiments 2–5. [image:9.595.100.552.259.520.2]www.nature.com/scientificreports/
signiicantly better it than Model 1 (p < 0.001) and Model 3 gave a signiicantly better it compared to Model 2 (p < 0.001). However, for the second item, while Model 2 gave a signiicantly better it than Model 1 (p < 0.05), there was no signiicant diference between Model 3 and Model 2. hus, letting the precision and PNT values difer
between Near and Far conditions gave the best it to the data, but only for the irst item, which replicates results of our ANOVA approach.
Discussion
he greater number of non-target responses and reduced precision in the Near condition, now observed with sequential stimulus presentation, is consistent with the indings of Experiment 1, which used simultaneous pres-entation. Importantly, the indings of Experiment 2 indicate that simultaneous presentation is not a requirement for competition. his extends previous work which shows greater competition for simultaneous compared to sequential presentation, but has not examined whether competition also occurs within this sequential “control” condition4, 5, 8, 9.
While there was a main efect of proximity upon PT, there was also a signiicant interaction between
prox-imity and the order in which the items were presented. Participants were most likely to mistakenly report the non-target when the irst item was probed in the Near condition. Since the second stimulus was presented imme-diately ater the ofset of the irst stimulus, perceptual processing of the irst stimulus may still have been ongoing when the second stimulus was presented. Our indings indicate that the representation of the irst item is more likely to be disrupted when the second item is presented in close proximity. Interestingly, the diference between Near and Far conditions just failed to reach statistical signiicance for the second stimulus.
he competitive efects reported here may arise in iconic memory, with the perception of a second item dis-torting the processing or consolidation of the irst item. To determine whether items held within WM (and no longer in iconic memory) can contribute to, or be susceptible to competition, we added a 500 ms inter-stimulus interval (ISI) between the presentation of the two stimuli.
Experiment
In Experiment 3 we introduced a 500 ms ISI between Stimulus 1 and Stimulus 2. If the competition we observed in Experiments 1 and 2 requires both items to be perceived together, or for at least one of the items to be held in iconic memory, then we should see equivalent WM performance for the Near and Far conditions in Experiment 3. If items held in WM can also compete, then we would expect to replicate the results of Experiments 1 and 2.
Method
Participants
Twenty-one students from the University of Birmingham (none of whom had participated in Experiments 1 and 2) gave informed consent to participate in Experiment 3. One participant withdrew ater the practice block. Data from three participants were removed due to values for at least one of the model components in any of the four conditions being greater than 3 standard deviations from the group mean. his let 17 partici-pants (11 females, 6 males, mean age = 23.4 years; range = 19–34 years).Stimuli and Design
he same stimuli were used as in Experiment 2. Following 30 practice trials, partici-pants completed 192 experimental trials.Procedure and Data analysis
The experimental procedure and data analysis were the same as for Experiment 2, with the addition of a 500 ms delay period between the ofset of Stimulus 1 and the onset of Stimulus 2 (see Fig. 5). he distributions of responses were analysed in the same way as in Experiments 1–3.Results
Figure 6 shows the mean precision estimates (Fig. 6a) and the distribution of responses relative to the target col-our (Fig. 6b) for each condition of Experiments 2–5.
Precision
he results of the ANOVA indicate that there was no signiicant main efect of proximity (F(1, 16) = 0.74, p= 0.404, ηp2= 0.044) upon WM precision. There was a significant main effect of order (F(1,K PT PNT PU LL
Second item
Model 1 5.2 (0.04) 0.84 (0.002) 0.06 (0.001) 0.10 (0.002) −4552.8 (13.6)
Model 2 5.2 (0.03) 0.84 (0.002) Near: 0.07 (0.001)
Far: 0.05 (0.001) 0.10 (0.002) −4550.1 (13.8)
Model 3 Near: 5.2 (0.05)
Far: 5.3 (0.05) 0.84 (0.001)
Near: 0.07 (0.002)
Far: 0.05 (0.001) 0.10 (0.002) −4549.6 (13.8)
First item
Model 1 5.17 (0.03) 0.81 (0.002) 0.09 (0.001) 0.10 (0.002) −4791.9 (12.4)
Model 2 5.16 (0.03) 0.81 (0.002) Near: 0.13 (0.002)
Far: 0.06 (0.001) 0.10 (0.002) −4770.6 (12.2)
[image:10.595.155.491.47.158.2]Model 3 Near: 4.77 (0.04) Far: 5.62 (0.05) 0.81 (0.002) Near: 0.13 (0.002) Far: 0.06 (0.001) 0.10 (0.002) −4765.9 (12.3)
Table 3. Estimates from the mixture models for Experiment 2, calculated using a model in which neither K nor PNT could difer between Near and Far conditions (Model 1), a model in which only PNT could difer (Model
2) and a model in which both K and PNT could difer (Model 3). he 95% conidence interval is shown in
16) = 6.23, p= 0.024, ηp2= 0.280), with greater precision for Stimulus 2, but no interaction between order and
proximity, (F(1, 16) = 2.51, p= 0.133, ηp2= 0.136).
We had observed a signiicant main efect of proximity for Experiment 2. An ANOVA with factors Experiment (Experiment 2 or Experiment 3), order and proximity revealed a signiicant interaction between proximity and Experiment (F(1, 37) = 5.15, p= 0.029, ηp2= 0.122). his demonstrates that proximity afected precision when
Stimulus 2 immediately followed Stimulus 1 (Experiment 2), but not when there was a 500 ms gap between the two stimuli (Experiment 3).
P
TP
NTand
P
U Mean values for the probability parameters, PT,PNT, and PU are shown in Table 1.For the probability of correctly reporting the target, PT, the main effect of proximity (F(1, 16) = 1.18
p= 0.293, ηp2= 0.069) was not signiicant. he main efect of order was signiicant (F(1, 16) = 10.659, p= 0.005, ηp2= 0.400). In contrast to Experiment 2, the interaction between order and proximity was not signiicant (F(1,
16) = 1.14, p= 0.302, ηp2= 0.066). he diference in the efect of proximity between Experiments 2 and 3 did
not reach signiicance (the experiment by proximity interaction was not signiicant; F(1, 37) = 0.457, p= 0.503, ηp2= 0.012.
For the probability of incorrectly reporting the non-target, PNT, there was no signiicant main efect of
prox-imity (F(1, 16) = 2.397, p= 0.141, ηp2= 0.130). here was a main efect of order (F(1, 16) = 15.24, p= 0.001, ηp2= 0.488, and there was no signiicant interaction between proximity and order (F(1, 16 = 0.498, p= 0.490, ηp2= 0.030). This significantly differed from Experiment 2, whereby a mixed ANOVA with experiment as
a between group factor revealed a signiicant interaction between proximity and experiment upon PNT, (F(1,
37) = 5.21, p= 0.028, ηp2= 0.123), demonstrating that proximity afects the probability of incorrectly reporting
the non- target when Stimulus 2 immediately followed Stimulus 1, but not in Experiment 3.
For the probability of guessing, PU there was no significant main effect of proximity (F(1, 16) = 0.109,
p= 0.745, ηp2= 0.007) and no signiicant main efect of order (F(1, 16) = 0.079, p= 0.782, ηp2= 0.005). here
was no signiicant interaction between order and proximity (F(1, 16) = 0.124, p= 0.729, ηp2= 0.008).
Model comparison
he same model comparison process used in Experiment 2 was used for Experiment 3. he parameters and its are displayed in Table 4. For the irst item, Model 2 gave a signiicantly better it than Model 1 (p < 0.05), but there was no signiicant diference between Model 3 and Model 2 (p = 0.17). For the sec-ond item, Model 2 was not signiicantly better than Model 1 (p = 0.59) and Model 3 was not signiicantly better than Model 1 (p = 0.496). herefore, proximity had minimal efects on precision and PNT.Discussion
In Experiment 2, we demonstrated reduced precision and PT and increased PNT in the Near condition,
particu-larly for the irst item in the sequence. In Experiment 3, with a 500 ms gap between Stimulus 1 and Stimulus 2, the efect of competition was eliminated. his might indicate that items were competing within perception in Experiment 2, with the irst stimulus still in iconic memory. It might also suggest that items held within WM are better protected from competition with incoming information than items held within iconic memory. However, as we go on to explain, the results of Experiment 5 indicate that the efects of competition on items held in WM are task-dependent, and that with certain task conditions, representations held within WM may also be afected by competition.
Experiment
Experiment 1 revealed that competition afects the number of mis-binding errors and the precision of an item within WM. In Experiment 2 we observed this efect when the stimuli are presented sequentially. he results of Experiment 3 suggest that this might arise only during perception, when the irst item is still in iconic memory. In Experiment 4 we reduced the period between the ofset of Stimulus 2 and the colour wheel to 500 ms. One possibility is that with the addition of a 500 ms delay period in Experiment 3, the irst item had been in WM for too long to see an efect of competition on precision. Inserting a 500 ms interval from the ofset of Stimulus 2 to the response period allowed us to equate the overall time between the onset of Stimulus 1 and the response period with Experiment 2.
K PT PNT PU LL
Second item
Model 1 5.0 (0.04) 0.87 (0.001) 0.06 (0.001) 0.07 (0.002) −3761.6 (12.7)
Model 2 5.0 (0.04) 0.87 (0.001) Near: 0.07 (0.002)
Far: 0.06 (0.001) 0.07 (0.002) −3760.8 (12.7)
Model 3 Near: 5.0 (0.04)
Far: 5.0 (0.05) 0.87 (0.001)
Near: 0.07 (0.002)
Far: 0.06 (0.001) 0.07 (0.002) −3760.3 (12.7)
First item
Model 1 4.9 (0.03) 0.86 (0.002) 0.05 (0.001) 0.09 (0.002) −3881.5 (12.1)
Model 2 4.9 (0.03) 0.86 (0.002) Near: 0.06 (0.002)
Far: 0.04 (0.001) 0.09 (0.002) −3880.1 (12.1)
[image:11.595.155.495.45.159.2]Model 3 Near: 4.67 (0.05) Far: 5.1 (0.05) 0.86 (0.002) Near: 0.06 (0.002) Far: 0.04 (0.001) 0.09 (0.002) −3878.5 (12.1)
Table 4. Estimates from the mixture models for Experiment 3, calculated using a model in which neither K nor PNT could difer between Near and Far conditions (Model 1), a model in which only PNT could difer (Model 2)
and a model in which both K and PNT could difer (Model 3). he 95% conidence interval is shown in
www.nature.com/scientificreports/
Method
Participants
Twenty students from the University of Birmingham (none of whom had participated in Experiments 1–3) gave informed consent to participate in Experiment 4. Data from 1 participant were removed due to values for at least one of the model components in any of the four conditions being greater than 3 standard deviations from the group mean. his let 19 participants (mean age = 25 years; range = 20–32 years).Stimuli Design Procedure and Data Analysis
The stimuli and procedure replicated those of Experiments 3, but there was 500 ms instead of 1000 ms between the ofset of Stimulus 2 and the probe, during which time a ixation cross was shown (see Fig. 5). Following 30 practice trials, participants completed 192 exper-imental trials. he distribution of responses was analysed in the same way as in Experiments 1–3.Results
Figure 6 shows the mean precision estimates (Fig. 6a) and the distribution of responses relative to the target col-our (Fig. 6b) for each condition of Experiments 2–5.
Precision
Figure 6a shows the mean precision estimates for each condition. here was no signiicant main efect of proximity (F(1, 18) = 0.84, p= 0.37, ηp2= 0.045) upon WM precision, and no signiicant main efect oforder (F(1, 18) = 1.62, p= 0.219, ηp2= 0.083). here was no signiicant interaction between order and proximity
(F(1, 18) = 0.31, p= 0.584, ηp2= 0.017).
P
TP
NTand
P
U Mean values for the probability parameters, PT,PNT, and PU are shown in Table 1. For theprobability of correctly reporting the target, PT, there was no signiicant main efect of proximity (F(1, 18) = 0.10
p= 0.758, ηp2= 0.005) and no signiicant main efect of order (F(1, 18) = 0.14, p= 0.717, ηp2= 0.007). here was
an almost signiicant interaction between proximity and order (F(1, 18) = 4.38, p= 0.051, ηp2= 0.196). Although
not signiicant, PT was greater for the Far compared to the Near condition when Stimulus 1 was probed (paired
t-test: t(18) =−1.93, p= 0.069), but greater for the Near condition when Stimulus 2 was probed (although this diference was far from reaching signiicance, paired t-test: t(18) = 0.99, p= 0.337). his pattern of results repli-cates that of Experiment 2, where PT was also reduced for the irst item in the Near condition.
For the probability of incorrectly reporting the non-target, PNT, in contrast to Experiments 1–2, there was no
signiicant main efect of proximity (F(1, 18) = 1.57, p= 0.226, ηp2= 0.08), and no signiicant main efect of order
(F(1, 18) = 0.48, p= 0.497, ηp2= 0.026). here was no signiicant interaction between proximity and order (F(1,
18) = 0.93, p= 0.347, ηp2= 0.049).
For the probability of guessing, PU there was no signiicant main efect of proximity (F(1, 18) = 0.14, p= 0.711,
ηp2= 0.008), and no signiicant main efect of order (F(1, 18) = 0.884, p= 0.360, ηp2= 0.047). he interaction
between proximity and order was close to reaching signiicance (F(1, 18) = 4.27, p= 0.054, ηp2= 0.192). Although
not signiicantly diferent, PU was greater for the Near condition compared to the Far condition when Stimulus
1 was probed (paired t-test: t(18) = 1.42, p= 0.17), but PU was greater in the Far condition compared to the Near
condition when Stimulus 2 was probed (paired t-test: t(18) =−1.43, p= 0.17).
Model comparison
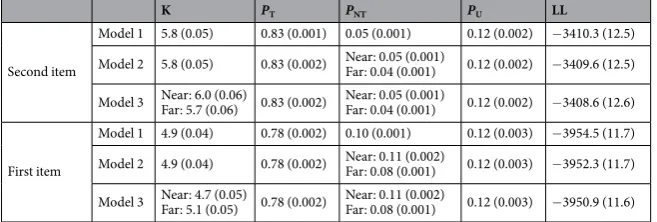
The same model comparison process used in Experiments 2 and 3 was used for Experiment 4. he parameters and its are displayed in Table 5. For the irst item, Model 2 did not give a signii-cantly better it than Model 1 (p = 0.1) and Model 3 did not give a signiicantly better it than Model 2 (p = 0.19). For the second item, Model 2 did not give a signiicantly better it than Model 1 (p = 0.84) and Model 3 did not give a signiicantly better it than Model 1 (p = 0.36). herefore, there was no efect of proximity on precision andPNT for Experiment 4.
Discussion
As with Experiment 3, we failed to ind a diference between Near and Far conditions in Experiment 4. Our ind-ings indicate that the precision and mis-binding efects we observed in Experiments 1–2 may be due to perceptual competition. his includes competition between simultaneously presented items (Experiment 1), and sequen-tial presentation with Stimulus 1 still remaining in iconic memory when Stimulus 2 is shown (Experiment 2).
K PT PNT PU LL
Second item
Model 1 5.8 (0.05) 0.83 (0.001) 0.05 (0.001) 0.12 (0.002) −3410.3 (12.5)
Model 2 5.8 (0.05) 0.83 (0.002) Near: 0.05 (0.001)
Far: 0.04 (0.001) 0.12 (0.002) −3409.6 (12.5)
Model 3 Near: 6.0 (0.06)
Far: 5.7 (0.06) 0.83 (0.002)
Near: 0.05 (0.001)
Far: 0.04 (0.001) 0.12 (0.002) −3408.6 (12.6)
First item
Model 1 4.9 (0.04) 0.78 (0.002) 0.10 (0.001) 0.12 (0.003) −3954.5 (11.7)
Model 2 4.9 (0.04) 0.78 (0.002) Near: 0.11 (0.002)
Far: 0.08 (0.001) 0.12 (0.003) −3952.3 (11.7)
[image:12.595.155.484.47.158.2]Model 3 Near: 4.7 (0.05) Far: 5.1 (0.05) 0.78 (0.002) Near: 0.11 (0.002) Far: 0.08 (0.001) 0.12 (0.003) −3950.9 (11.6)
Table 5. Estimates from the mixture models for Experiment 4, calculated using a model in which neither K nor PNT could difer between Near and Far conditions (Model 1), a model in which only PNT could difer (Model
2) and a model in which both K and PNT could difer (Model 3). he 95% conidence interval is shown in
Alternatively, as information about the location of the stimuli was not relevant to the task, participants may have failed to maintain this information in WM, reducing or removing the efects of competition.
Experiment
In Experiment 5, we encouraged participants to maintain information about the location of the stimuli. Participants were asked to make a location-based judgment on 25% of the trials, instead of performing the colour wheel task. To perform well on the location-based task, participants must maintain the precise location of the stimuli in WM. his was done to address the possibility that items held in WM can be afected by competing proximal stimuli if their spatial position is maintained in WM, and that we had failed to see the efects of compe-tition in Experiments 3 and 4 because their spatial position had not been maintained.
Method
Participants
Twenty seven students from the University of Birmingham (none of whom had participated in Experiments 1–4) gave informed consent to participate in Experiment 5. Two participants withdrew during the experimental procedure. Data from 6 participants were removed due to values for at least one of the model components in any of the four conditions being greater than 3 standard deviations from the group mean, or due to the participant responding to the target on less than 50% of the trials. his let 19 participants (mean age = 19 years; range = 18–23 years).Stimuli and Design
he stimuli and presentation times replicated those of Experiment 3. here was a 1000 ms delay period between the ofset of Stimulus 2 and the response phase. here were two tasks; 1) the colour report task in which participants reported the colour of one of the two stimuli on a colour wheel, as used in Experiments 2–4, and 2) a location judgment task. For the colour report task, there were 384 trials; 192 were Near condition trials, 192 were Far condition trials. For the location judgment trials there were 128 trials. At the response phase, participants were presented with the two squares simultaneously. he colours of the two squares matched the colours used at presentation. Participants were asked to report whether the location of either of the squares had changed. For 32 trials, neither of the squares changed location, for 32 trials both of the squares changed location and for 64 trials just one of the squares changed location. Participants indicated “change” or “no change” by pressing buttons 1 or 2 on the keyboard. here were 30 practice trials, composed of both colour report and location judgement trials.Procedure
The experimental procedure for Experiment 3 was maintained, except that participants in Experiment 5 were asked to perform the colour report task when they saw the colour wheel during the response phase and the location judgement (change detection) task when they saw the two squares presented during the response phase. Participants did not know which task they would be asked to perform until the response phase. Figure 6 shows the trial sequence for the Near condition.Data Analysis
he distribution of responses was analysed in the same way as in Experiments 1–4.Results
Figure 6 shows the mean precision estimates (Fig. 6a) and the distribution of responses relative to the target col-our (Fig. 6b) for each condition of Experiments 2–5.
Precision
he results of the ANOVA indicate that there was no signiicant efect of proximity (F(1, 18) = 1.42,p= 0.249, ηp2= 0.073) upon WM precision, and no significant effect of order (F(1, 18) = 2.81, p= 0.111,
ηp2= 0.135). here was no signiicant interaction between order and proximity (F(1, 18) = 1.30, p= 0.269,
ηp2= 0.067).
P
TP
NTand
P
U Mean values for the probability parameters, PT,PNT, and PU are shown in Table 1. For theprobability of correctly reporting the target, PT, there was no signiicant main efect of proximity (F(1, 18) = 0.43
p= 0.521, ηp2= 0.023). here was a signiicant main efect of order (F(1, 18) = 6.47, p= 0.020, ηp2= 0.264), with
a reduced probability of reporting the target for Stimulus 1. here was no signiicant interaction between order and proximity (F(1, 18) = 0.19, p= 0.670, ηp2= 0.010).
For the probability of incorrectly reporting the non-target, PNT, there was a signiicant main efect of
prox-imity (F(1, 18) = 4.70, p= 0.044, ηp2= 0.207), with greater mis-binding in the Near condition. he main efect
of order was close to reaching signiicance (F(1, 18) = 4.40, p= 0.051, ηp2= 0.196), with more mis-binding of
Stimulus 1 than Stimulus 2. here was no signiicant interaction between proximity and order F(1, 18) = 1.44,
p= 0.245, ηp2= 0.074). Although there was no signiicant interaction between proximity and order, we were
www.nature.com/scientificreports/
For the probability of guessing, PU, there was no significant main effect of proximity (F(1, 18) = 0.612,
p= 0.444, ηp2= 0.033) and no signiicant main efect of order (F(1, 18) = 1.17, p= 0.295, ηp2= 0.061). here was
no signiicant interaction between order and proximity (F(1, 18) = 0.07, p= 0.797, ηp2= 0.004).
Model comparison
he same model comparison process used in Experiments 2, 3 and 4 was used for Experiment 5. he parameters and its are displayed in Table 6. For the irst item, Model 2 gave a signiicantly bet-ter it than Model 1 (p < 0.01), but Model 3 was not signiicantly better than Model 2 (p = 0.212). For the second item, Model 2 was not signiicantly better than Model 1 (p = 0.49) and Model 3 did not give a signiicantly better it than Model 1 (p = 0.79). For Experiment 5, proximity had an efect on PNT only for the irst item.Discussion
In Experiment 5, the introduction of the location judgement task brought back the efect of competition on PNT,
although no efect of competition was observed for WM precision. An efect of competition had been seen on precision with simultaneous stimulus presentation (Experiment 1) and when Stimulus 2 immediately followed Stimulus 1 (Experiment 2). However, the diference in PNT between Near and Far conditions indicates that an
efect of competition can be seen with sequential stimulus presentation, and with a delay of 500 ms between the stimuli, so that Stimulus 1 would not still have been in iconic memory when Stimulus 2 was presented. Again, we do not wish to imply that the competition occurs “within” working memory or iconic memory, and our results do not tell us when the competition occurs, but they do indicate that simultaneous presentation is not a prerequisite for competition to occur.
General Discussion
Across ive experiments, we examined the efects of competition on WM performance by manipulating the spatial proximity between items. Initially, we presented items simultaneously and demon-strated not only more mis-binding in the Near (high competition) condition, but also reduced WM precision in this condition (Experiment 1). We also examined whether spatial proximity also afected performance when stimuli were presented sequentially. When the second item immediately followed the irst, spatial proximity again afected performance (speciically WM precision and the probability of reporting the non-target) (Experiment 2), indicating that competition is not restricted to conditions in which competing stimuli are presented simultane-ously. Order efects also indicate that competition more strongly afected WM performance for the irst stimulus. To address the possibility that these competition efects were dependent upon the irst item being held in iconic memory, we introduced a delay between the two items. In Experiments 3–5, there was a 500 ms delay between the two stimuli. With 1000 ms between the ofset of the second stimulus and the response period, we did not ind any evidence of competition (Experiment 3). Similarly, in Experiment 4, reducing the delay between the ofset of the second stimulus and the response period to 500 ms, we again saw no efect of proximity on WM performance. With Experiment 5, we introduced a second task in order to encourage maintenance of the speciic location of the stimuli. Here, we observed an efect of proximity on the probability of reporting the non-target, as we had seen for simultaneous presentation (Experiments 1 and 2). hese results indicate that competitive interactions between stimuli are not restricted to conditions in which the stimuli are presented together.Although the efects of competition did not extend to the measure of WM precision in Experiment 5, we did observe an efect of competition on WM precision in Experiments 1 and 2. his also extends previous research into competition and sensory suppression during perception e.g. ref. 1, 4, 5, 36, 37. By comparing sequential versus simultaneous stimulus presentation, Ihssen et al.9 report that competition afects WM capacity, but they did not address whether the idelity of a WM representation is afected. Emrich & Ferber21 and Tamber-Rosenau
et al.23 manipulated spatial proximity, and observed a greater probability of reporting the non-target (which they interpret as mis-binding of stimulus features). Interestingly however, they did not ind evidence for an efect of spatial proximity on WM precision, as we observed. We suggest that this discrepancy is due to the diference in the distance between the stimuli used in their studies and ours. he stimuli were closer together in our study. Critically, our indings show that the outcome measure of WM precision can be compromised by competition.
he present results apparently contradict those of Lin and Luck24 who observed enhanced WM performance (capacity) for similarly coloured items (the high competition condition) compared to items of dissimilar colours (the low competition condition). However, their participants were required to report the colour of remembered
K PT PNT PU LL
Second item
Model 1 5.5 (0.05) 0.80 (0.002) 0.08 (0.001) 0.12 (0.002) −4104.1 (14.1)
Model 2 5.5 (0.05) 0.80 (0.002) Near: 0.09 (0.002)
Far: 0.08 (0.002) 0.12 (0.002) −4103.4 (14.1)
Model 3 Near: 5.5 (0.06)
Far: 5.5 (0.06) 0.80 (0.002)
Near: 0.09 (0.002)
Far: 0.08 (0.002) 0.12 (0.002) −4102.7 (14.1)
First item
Model 1 5.0 (0.04) 0.76 (0.002) 0.10 (0.002) 0.14 (0.002) −4535.3 (11.9)
Model 2 5.0 (0.04) 0.76 (0.002) Near: 0.12 (0.002)
Far: 0.09 (0.002) 0.14 (0.002) −4530.8 (11.8)
[image:14.595.154.483.47.159.2]Model 3 Near: 4.7 (0.05) Far: 5.2 (0.06) 0.76 (0.002) Near: 0.12 (0.002) Far: 0.09 (0.002) 0.14 (0.002) −4529.4 (11.8)
Table 6. Estimates from the mixture models for Experiment 5, calculated using a model in which neither K nor PNT could difer between Near and Far conditions (Model 1), a model in which only PNT could difer (Model
2) and a model in which both K and PNT could difer (Model 3). he 95% conidence interval is shown in
items, and colour was also the feature used to manipulate competition. In our experiment, the task demand (colour report) was orthogonal to the dimension being manipulated (spatial proximity). his diference may account for the discrepancy. Alternatively, perceptual averaging38 may explain the diference. In the study by Lin and Luck24, a greater likelihood of the changed item being far from the perceptual average in the high similarity condition may have made the change easier to identify, and account for superior performance in this condition.
Despite the enhanced precision associated with Far trials in Experiment 1, they were also associated with a greater probability of guessing. his diference in guessing may be attributed to a precision-capacity trade-of, as reported elsewheree.g. ref. 39. It is possible that, for some participants, attention was oriented to one item at the expense of the other, leading to more guessing (although no signiicant diference in PT was observed). However,
it should be noted that the estimates for PU were low across all conditions (<0.2).
With Experiments 2 and 5 we tested for competitive efects between stimuli presented sequentially. Previously, sequential presentation has been viewed as a low/no competition control condition, following the assumption that sensory suppression among stimuli within RFs can only take place when they are perceived together8, 9, 21, 40, 41. As far as we are aware, no studies have manipulated spatial proximity between sequentially presented stimuli to address whether competition afects WM performance when the stimuli are not perceived together. his is a critical question given that the visual world is intrinsically continuous and dynamic.
In Experiment 2, we demonstrated that sequential presentation of stimuli presented close together in space, with the second stimulus immediately following the irst, resulted in less precision and greater mis-binding, par-ticularly when the irst stimulus was probed. One possibility is that the irst item was still in iconic memory when it’s processing and consolidation was disrupted by competition from the second item.
Although the efects of competition disappeared when we introduced a 500 ms delay between the irst and second stimuli (Experiments 3 and 4), we again saw evidence of competition in Experiment 5, when an addi-tional task was introduced to encourage participants to maintain the locations of stimuli in WM. In Experiment 5, we observed greater PNT in the Near condition compared to the Far condition, but, unlike in Experiment 1, no
diference in WM precision. One possibility is that we did not observe an efect of proximity on WM precision because, when perceptual competition occurs between one item held in working memory and one item being displayed, the efects are more subtle and only the efect of proximity on PNT reaches signiicance. he fact that,
with simultaneous presentation and a greater distance between stimuli, others have observed an efect of com-petition on PNT but not precision21, 23, supports the idea that the efect of competition on precision is somehow
weaker. Alternatively, it is possible that the efect of proximity on PNT represents a diferent kind of competition
to the efect of proximity on precision. Perhaps, with sequential presentation, the items are precisely represented during encoding, but that proximity afects their maintenance within working memory, even perhaps the bind-ing of colours to locations. Further experiments are needed to address this. Also, for a direct comparison of competition efects with simultaneous and sequential stimulus presentation, further experiments will need to examine whether there are any diferences in eye-movements between the two conditions and these may afect competition.
According to the sensory recruitment hypothesis of WM, early visual areas involved in perception are used to support the active maintenance of visual spatial information see ref. 35. If neurons within the same RF are recruited for the active maintenance of two proximal items, then we suggest that these items may still compete even if they are not presented together. Presumably, our location judgment task in Experiment 5 encouraged par-ticipants to maintain location information such that the efects of competition were brought back, or enhanced. Avoiding retinotopic speciicity (which may have been the case in Experiments 3 and 4) presumably protected the items from competition.
hese results also have important implications for formal models of working memory that simulate the inter-ference between stored items. In Swan & Wyble42, a shared pool of neural resources binds the colours and loca-tions of multiple objects by assigning them to distinct tokens. his model predicts an efect of spatial proximity on precision, since, in the model, items that are spatially closer share more of their neural representation and thus produce greater mutual interference. However, what the model does not predict is the importance of temporal separation during presentation, which is shown here to protect the items from increased interference caused by reduced inter-item distance. he implications for the model are that time plays a key role in increasing the distinc-tiveness between tokens, even at relatively long intervals. Previously, it had been assumed from work on the atten-tional blink that sequential items presented at SOAs longer than 200 ms elicited entirely distinct working memory representations by exceeding the sparing window43, 44, but in Experiment 2 we observed an efect of proximity with a 250 ms SOA, which challenges the idea that 200 ms is suicient for there to be distinct WM representations.