This is a repository copy of Sensing Temperature and Stress Distributions on Rock Samples under Mechanical Loading.
White Rose Research Online URL for this paper: http://eprints.whiterose.ac.uk/96284/
Version: Accepted Version
Proceedings Paper:
Antony, SJ orcid.org/0000-0003-1761-6306, Olugbenga, A, Ozerkan, N et al. (2 more authors) (2017) Sensing Temperature and Stress Distributions on Rock Samples under Mechanical Loading. In: Rock mechanics, geomechanics, spacemechanics, , (ed.) Earth and Space 2016: Engineering for Extreme Environments. 15th Biennial ASCE Conference on Engineering, Science, Construction, and Operations in Challenging Environments, 11-15 Apr 2016, Orlando, Florida. American Society of Civil Engineers , pp. 797-804. ISBN 978-0-7844-7997-1
https://doi.org/10.1061/9780784479971.074
[email protected] https://eprints.whiterose.ac.uk/ Reuse
Unless indicated otherwise, fulltext items are protected by copyright with all rights reserved. The copyright exception in section 29 of the Copyright, Designs and Patents Act 1988 allows the making of a single copy solely for the purpose of non-commercial research or private study within the limits of fair dealing. The publisher or other rights-holder may allow further reproduction and re-use of this version - refer to the White Rose Research Online record for this item. Where records identify the publisher as the copyright holder, users can verify any specific terms of use on the publisher’s website.
Takedown
If you consider content in White Rose Research Online to be in breach of UK law, please notify us by
“This material may be downloaded for personal use only. Any other use requires prior permission of the American Society of Civil Engineers.”
Sensing Temperature and Stress Distributions on Rock Samples under Mechanical Loading
S. J. Antony*1, A. Olugbenga1, N. Ozerkan2 , O. Marumoame1 and G. Okeke1
1 School of Chemical and Process Engineering, University of Leeds, LS2 9JT, UK
2Center for Advanced Materials, P. O. Box: 2713 Qatar University, Qatar
* Corresponding author: Tel.: ++44 (0)113 3432409; Email: [email protected]
ABSTRACT
In the exploration of planetary materials using robotic probes, one of the key priorities is to establish fundamental level understandings on the mechanical response of materials under different levels of loading. In this context, though a number of strength characterisation tools are applied in the space industry, whole-field visualization of stress and temperature distribution on rock samples and their potential relevance to fracture under external loading is not yet well exploited. In this work, we apply two types of tomography namely (i) IR tomography and (ii) PSAT tomography to understand the variation of temperature and shear stress distribution respectively anywhere on the samples at point scale. Sandstone is used as a simulant material here. Potential links between the tomography measures and the fracture strength of the sandstone are revealed in this work.
INTRODUCTION
Rock materials such as sandstone are made of strongly bonded individual grains with different chemical compositions spread in the rock samples. For practical purposes, the sandstone material can be considered as a strongly bonded cementitious granular material (Hudson and Harrison, 2000; Wu et al 2000). Under mechanical loading, stress distribution and dislocation of grains in granular materials could occur in a non-homogeneous manner (Antony 2007; Kruyt and Antony, 2007). Though a number of studies have focused on the strength evaluation of rock samples in the past (Hudson and Harrison, 2000; Wu et al, 2000; Hansen et al, 2011 ) key challenges such as measuring temperature and stress distribution in opaque rock samples at point scale and the correlations between them is not well understood under different mechanical loading conditions. These challenges are addressed in the present work.
TEMPERATURE DISTRIBUTION IN SANDSTONE
rock material at microscopic level is linked to losses in stiffness and growth of irretrievable deformation (Hudson and Harrison, 2000). Hence the detection of cracks in rock materials under different loading conditions is sought in engineering applications.
Infrared tomography is a useful tool to understand the distribution of temperature in materials even at a minute scale. Luong (2007) studied on the energy-dissipation characteristics of sand using the infrared thermography methodology. The author was able to visualise and evaluate heat energy distribution due to the dissipation of energy as a result of frictional movement between the soil grains. An increase in the temperature of about 6oC was observed at some locations in the test samples. Other methods, for example using acoustic emissions (Wu et al, 2000) were also used in the past to investigate the behaviour of grain dislocations and mechanical strength in rock media under external loading. In the present work, we focus on the effects of slit opening angle of Chevron-notch sandstone test samples on the temperature distribution to characterise their micromechanical strength.
Infra Red (IR) Experiments and Measurements
Modified Chevron notch rod samples (Anunmana et al, 2010; Himsolt et al, 1987) were used in the present study (Figure 1). Samples with four cases of notch angles (40°, 45°, 50°and 60°) were considered to evaluate the effect of notch angle on the nature of temperature distribution in the rock samples. An infrared thermal camera was positioned at a distance of about 1 m from the sample to measure the temperature and capture thermal image of sandstone sample subjected to axial point-loading at the notch tip (Figure 1). Loading was applied gradually using a hydraulic pressure pump which was connected to a movable metal part (V-shape with sharp edges to transfer the point loading across the thickness of the sample). The loading was applied in small increments until the samples failed. The IR camera was connected to a computer where all data recorded was stored. The post-processing software helped to analyse the temperature at any point on the surface of the sample, though the interest here is to analyse the data close to the notch tip where the normal load was applied.
Figure 1: Schematic diagram of the modified chevron short rod samples and loading rig used in the experiments.
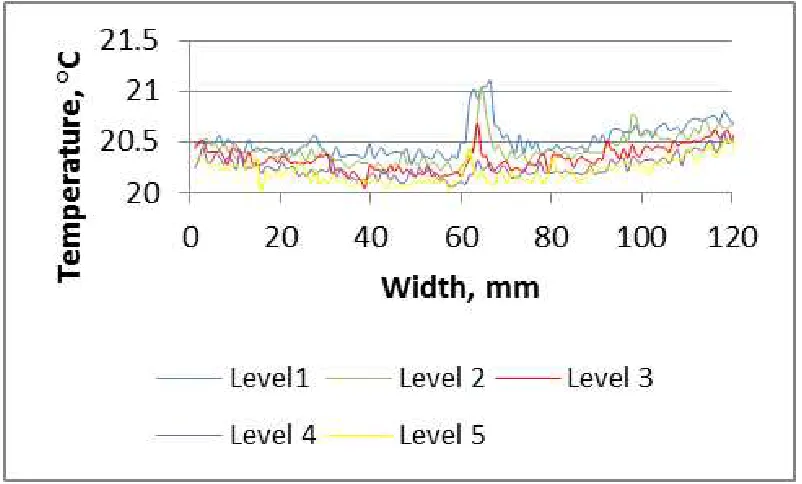
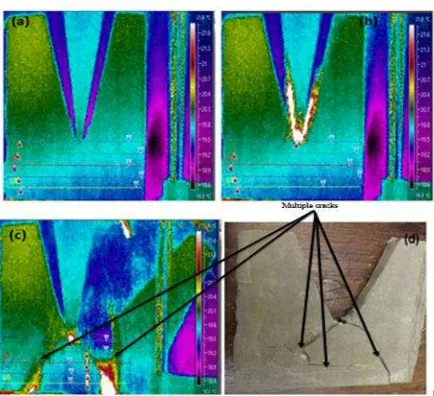
The evolution of temperature distribution in the samples for all the cases of notch angle was tracked. Figure 2 shows such a progression of temperature distribution profile for a typical case of sample with 40º notch angle. For illustrations, the physical image of the sample just after failure is also shown in this plot. It is interesting to note that the locations of the failure line and the temperature concentration line at the verge of failure (where the temperature is relatively higher beneath the point of contact of loading) are quite identical. This confirms that, due to grain sliding at micro scale grain-scale, a strong level of energy dissipation occurred through this path. This shows the usefulness of IR-based temperature measurements as a useful way of measuring localised cracks invisible to naked eyes in sandstone under mechanical loading. Furthermore, to quantify the strength of temperature distribution, corresponding temperature map pertaining to the verge of failure of the sample was analysed. The temperature distribution across the width of the sample at different depths from the tip of the notch (level 1 in Figure 2c) is presented in Figure 3.
Figure 2: A 40 º modified chevron short rod sample results showing; (a, b) gradual progression of temperature concentration pertaining to increase in loading (c) temperature distribution at the verge of material fracture (d) visual observation of the fractured sample.
It is evident that the temperature is the highest beneath the tip of the notch. From this level, it decreases for an increase in the depth of probe. Also the highest temperature is detected around the mid-region of the sample. Relatively higher temperature concentration could mean higher thermal energy dissipation and this is proportional to the amount of loading applied on the sample. Therefore higher temperature is due to possibly high stress concentration and subsequent sliding of the grains resulting
Temperature Concentration
Fracture line
Level 1 2 3 4
energy dissipation near where mechanical loading is applied (Wu et al, 2000). Through image analysis, we also verified that the crack propagated from the tip of the notch to downwards in the sample.
Figure 3: The temperature profile of 40º notch angle sample
Figure 4 shows the temperature distribution profile for the case of 45º notch angle. Similar to the above presented analysis, the temperature distribution across the width of the sample is presented in Figure 5. As discussed earlier, the temperature profile along the tip of the notch is relatively higher than at other levels. The maximum temperature at the peak of the profile is found to be about 37.8 , which is much higher than the 21.1 observed for this in the case of 40º notch angle. There are a
[image:5.612.110.511.160.402.2]Figure 4: A 45º modified chevron short rod sample results showing; (a,b) gradual progression of temperature concentration for an increase in loading (c) temperature distribution at the verge of material fracture (d) visual observation of the fractured sample.
Figure 5: The temperature profile of 45º notch angle sample
level 2 (slightly below the level of the notch tip). Furthermore, we verified that the position of the peak in temperature profile correlated with the postion of crack in the fractured samples.
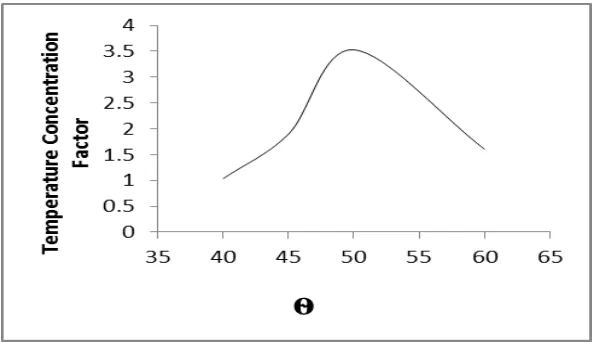
For all the cases of the notch angle ( ), we evaluated the temperature concentration factor (TCF), which is the ratio of the maximum temperature to the nominal temperature of the sample (/room temperature, which was almost the same in all the experiments). The results are presented in Figure 6.
Figure 6: Variation of TCF with notch angle
[image:7.612.102.401.201.372.2]It is evident that the maximum TCF occurred in the case of the sample with notch angle 50º. Hence the energy dissipation in the grains of the sandstone was most dominant in the case of the sample having notch angle 50º.
Figure 7: Characteristic size of plastic zone in a continuum material as a function of crack opening angle (Pook, 1971)
Though a numerical modelling of this behaviour is outside the current scope of the
0.00 0.20 0.40 0.60 0.80 1.00 1.20
0 10 20 30 40 50 60 70 80 90
C h a ra ct e ri st ic d im e n si o n o f p la st ic zo n e ( P o o k , 1 9 7 1 )
investigation, for a qualitative comparison, in Figure 7 we present the theoretical variation of the maximum size of plastic zone from crack tip perpendicular to crack plane of a continuum material (Poisson’s ratio 1/3) reported by Pook (1971). Interestingly some similarities are seen between these plots, which suggests that the notch angle (analogous to crack angle) of about 50º could enhance a stronger dissipation of energy in the materials under mechanical loading. However, further studies are required to examine the details of this nature.
SENSING SHEAR STRESS DISTRIBUTION IN SANDSTONE
The focus of this investigation is to get information on how stress transmission occurs in rock media. However, experimental sensing of stress distribution on sandstone under mechanical loading is not yet well established, considering that sandstone is an opaque material. Previous studies on this are mostly focused on theoretical and computational methodologies apart from conducting macroscopic strength evaluations using experimental characterisation methods (Feng et al, 2013). To address this challenge, a key objective of this investigation is to visualise the shear stress distribution profile on the surface of sandstone which is a cementitious materials (i.e., strongly bonded granular materials) subjected to mechanical loading. The geometry of the test sample and loading condition are similar to the IR tests explained above, but here we use photo stress analysis tomography (PSAT) to measure the stress distribution for the case of 50º notch angle specimen with dimension 18 cmx11.5 cmx4 cm.
different directions to obtain the shear strain component). Figure 8 shows the distribution of maximum shear stress around the notch on the sandstone under loading.
Figure 8: PSAT optical (birefringent) fringe patterns on the sandstone sample. The contours show the distribution of maximum shear stress (MPa) on the surface of the sample (modified chevron notch rod sample).
It is evident that the sensing of maximum shear stress distribution on the surface of sandstone shows a non-homogeneous distribution with regions close to the notch displaying the strongest anisotropy. We had also observed that the level at which maximum shear stress occurs from the tip of the notch was fairly consistent with the IR measurements reported earlier for the maximum temperature.
CONCLUSIONS
[image:9.612.164.473.142.348.2]provided here could help to characterise grain-scale response of new materials under mechanical loading in advanced engineering applications such as on-site characterisation of planetary materials in future.
ACKNOWLEDGEMENT
This publication was made possible by NPRP grant # 6-1010-2-413 from the Qatar National Research Fund (a member of Qatar Foundation). The statements made herein are solely the responsibility of the authors.
REFERENCES
Anunmana, C., Anusavice, K.J., and Mecholsky, J. (2010) “Interfacial toughness of bilayer dental ceramics based on a short-bar, chevron-notch test”, Dental
Materials 26, 111–117
Antony, S.J. (2007) “Link between single-particle properties and macroscopic properties in particulate assemblies: role of structures within structures”, Philosophical Transactions of the Royal Society of London, Series: A 365, 2879-2891 Antony, S.J., Imafidon, O., and Barakat, T. (2015) “Micromechanical analysis of
inclusions in particulate media using digital photo stress analysis tomography”, Optical Engineering, 54(8), 081202
Dally, J.W. and Riley, W.F. (1987) “Experimental Stress Analysis”, McGraw Hill, Singapore
Feng,X., Hudson,J.A., Tan, F. (2013) “Rock Characterisation, Modelling and
Engineering Design Methods”, CRC Press, London
Hansen, L. N., Zimmerman, M. E., and Kohlstedt, D. L. (2011) “Grain boundary sliding in San Carlos olivine: Flow law parameters and crystallographic preferred
orientation”, Jl. Geophys. Res: Solid Earth B8, 1978–2012
Himsolt, G., Munz, D., and Fett, T. (1987) “A modified Chevron specimen for ceramic
materials”, Journal of American Ceramic Society, 70(6), C133-135
Hudson, J. A., and Harrison, J.P. (2000) “Engineering rock mechanics-an introduction to
the principles”, Elsevier, New York
Kruyt, N.P. and Antony, S.J. (2007) “Force, relative displacement and work networks in granular media subjected to quasi-static deformation”, Physical Review E, 75, 051308
Luong, M. P. (2007) “Introducing infrared thermography in soil dynamics”, Infrared Physics and Technology, 49, 306–311
Pook, L.P (1971) “The effect of crack angle on fracture toughness”, Engineering Fracture Mechanics, 3, 205-218