Wettability Alteration Processes
.
White Rose Research Online URL for this paper:
http://eprints.whiterose.ac.uk/136977/
Version: Published Version
Article:
Bekbauov, B., Berdyshev, A., Baishemirov, Z. et al. (1 more author) (2017) Numerical
Validation of Chemical Compositional Model for Wettability Alteration Processes. Open
Engineering, 7 (1). pp. 416-427.
https://doi.org/10.1515/eng-2017-0049
[email protected] https://eprints.whiterose.ac.uk/ Reuse
This article is distributed under the terms of the Creative Commons Attribution-NonCommercial-NoDerivs (CC BY-NC-ND) licence. This licence only allows you to download this work and share it with others as long as you credit the authors, but you can’t change the article in any way or use it commercially. More
information and the full terms of the licence here: https://creativecommons.org/licenses/
Takedown
If you consider content in White Rose Research Online to be in breach of UK law, please notify us by
Research Article
Open Access
Bakhbergen Bekbauov*, Abdumauvlen Berdyshev, Zharasbek Baishemirov, and
Domenico Bau
Numerical Validation of Chemical Compositional
Model for Wettability Alteration Processes
https://doi.org/10.1515/eng-2017-0049
Received June 29, 2017; accepted November 28, 2017
Abstract:Chemical compositional simulation of enhanced oil recovery and surfactant enhanced aquifer remediation processes is a complex task that involves solving dozens of equations for all grid blocks representing a reservoir. In the present work, we perform a numerical validation of the newly developed mathematical formulation which satis-fies the conservation laws of mass and energy and allows applying a sequential solution approach to solve the gov-erning equations separately and implicitly. Through its ap-plication to the numerical experiment using a wettability alteration model and comparisons with existing chemical compositional model’s numerical results, the new model has proven to be practical, reliable and stable.
Keywords: chemical flooding, compositional model for-mulation, wettability alteration.
1 Introduction
Chemical flooding is a general term used for injection processes that use special chemical solutions. Micellar, al-kaline, and surfactants are used to reduce surface tension between coexisting phases in the reservoir. The chemical solutions are pumped through specially distributed injec-tion wells to mobilize oil left behind after secondary recov-ery or groundwater contaminants present as non-aqueous phase liquids. While chemical flooding has a larger scale
*Corresponding Author: Bakhbergen Bekbauov:Al-Farabi Kazakh National University, Almaty, Kazakhstan, E-mail: [email protected]
Abdumauvlen Berdyshev:Abai Kazakh National Pedagogical University, Almaty, Kazakhstan, E-mail: [email protected]
Zharasbek Baishemirov:Abai Kazakh National Pedagogical Uni-versity, Almaty, Kazakhstan, E-mail: [email protected]
Domenico Bau:The University of Sheffield, Sheffield, United King-dom, E-mail: [email protected]
for performing groundwater simulations, some UTCHEM options are not supported in GMS. An IMPEC chemical flooding simulator UTCHEM was originally developed by Pope and Nelson in 1978 and it’s been continually updated since its initial development [1] - [6]. In 2007, Zhangxing Chen et al. [6] presented a numerical approach that solves both pressure and compositions implicitly. The sequen-tial approach splits the coupled system of nonlinear gov-erning equations of the model into individual equations and solves each of them separately and implicitly. The sys-tem of species conservation equations is solved implicitly for the overall concentration of each component. For the numerical tests carried out in their studies, the authors have observed that the sequential technique is approxi-mately twice as fast as the IMPEC. Though the approach was claimed to be sequential and extended from the IM-PEC approach used in UTCHEM model [4], the mathemati-cal formulations for the governing equations did not un-dergo any change in their model. Since the overall con-centration appears only in the accumulation term of the species-conservation equations, it remains unclear how the sequential approach was used to solve these equations implicitly for the overall concentration. The following bal-ance equations are used in UTCHEM model: a) the over-all compositional balance equation for each species; b) pressure (an overall mass-continuity) equation; and c) the energy balance equation. The main assumptions imposed on the model equations are as follows: (i) the rock and fluids are slightly compressible; (ii) the diffusion obeys Fick’s law; (iii) Darcy’s law applies; (iv) approximation of a local thermodynamic equilibrium state can be ap-plied; and (v) mixing is ideal. In this work, we perform a numerical validation of the simulation tool based on the recently developed mathematical formulation [7], [8] by comparing its results on wettability alteration with those of UTCHEM simulator. The simulation tool can be applied to study problems of enhanced oil recovery and remedia-tion of aquifers by surfactants. As the principles involved in both applications are the same, due to the availability of data for validation, laboratory experiments on wetta-bility alteration have been modeled using the simulator based on the improved mathematical formulation. "Wetta-bility alteration" is used in literature to address any change in the original wettability of a rock, either spontaneously or by chemical flooding methods. Castillo (2003) modeled the wettability alteration of alkali or surfactants using the effect of wettability on relative permeability and capillary pressure [9]. In this model the user can specify the initial and altered wetting conditions of the rock. This is done by specifying the water and oil relative permeabilities and water-oil capillary pressure tables for each wettability
oil-wet sand packs. The tests were conducted by various aque-ous solutions having different pHs and salinities. The re-sults demonstrate that streaming potential is measurably changed with the wetting state of the rock surface. Fur-thermore, the authors used bundle-of-tubes model to sim-ulate the experiments and quantify wetting transitions. The results introduce a new method for monitoring the wettability change of porous media during dynamic injec-tion processes. Andersen et al. (2015) presented a mathe-matical model for wettability alteration in fractured reser-voirs [18]. The wettability alteration is described by shift-ing curves for relative permeability and capillary pres-sure from curves representing preferentially oil-wet ditions toward curves representing more-water-wet con-ditions. The numerical code was compared with ECLIPSE for the specific case in which a fixed wetting state was as-sumed. Lashgari et al. (2016) presented a dynamic wet-tability alteration model based on the Gibbs adsorption isotherm equation [19]. The model is conceptually and thermodynamically developed for anionic surfactants that reduce the surface tension between oil phase and rock for-mation based on the contact angle in a preferentially oil-wet formation. In order to apply the effect of contact angle on multiphase fluid flow in porous media, existing relative permeability and capillary pressure models are modified to become a function of contact angle to mimic the influ-ence of wettability alteration. Ju, B. and Fan, T. (2012) de-veloped a numerical simulator considering wettability al-teration to predict oil production [20]. The simulation in-dicates that the wettability alteration during water flood-ing has strong effects on the water cut and oil recovery. It is found that the increase in water wetness during water flooding leads to a higher oil recovery and less accumu-lated production water at a water cut. Flovik et al. (2015) modeled the change in contact angles due to the injection of wettability altering agent in an oil-rich porous medium by a network of disordered pores transporting two immis-cible fluids [21]. In this article, the authors introduced a dynamic wettability altering mechanism, where the time dependent wetting property of each pore is determined by the cumulative flow of water through it. Simulations were performed to reach steady-state for different possible alter-ations in the wetting angle. A thermal mathematical model of the simultaneous flow of immiscible fluids was devel-oped and applied for simulating mechanical and chemi-cal water control (gel/polymer treatment wettability alter-ation and disproportionate permeability reduction) meth-ods [22] and [23]. One of the novelties introduced by the authors was a generalized version of the relative perme-ability and capillary pressure correlations to model the performance of post-treatment production taking into
can be used to simulate multiple processes. It has applica-tions both in modeling chemical remediation of contam-inated aquifers and enhanced oil recovery processes. In this work, we perform a numerical validation of an im-proved chemical compositional simulation tool based on the recently developed mathematical formulation.
2
Formulation of mathematical
model
Derivation of the model equations presented in this paper is given in our previous publication [7] where we the-oretically proved that the newly developed model satisfies the conservation laws of mass and energy precisely, as op-posed to the existing chemical compositional model.
The mass conservation equation for the overall con-centration ˜ciis defined as
∂ ∂t ϕρi˜ci
+∇· " ˆ ϕρi np X α=1 Sαciα − → uα # − −∇· np X α=1 h
Kiα·∇
ˆ
ϕρiSαciα i
=Ri,i= 1,. . .,nc, (1)
whereϕis the porosity,ρiis the density of pure
compo-nentiand˜ciis the overall concentration of componenti.
The modified porosityϕˆ is defined as the fraction of the bulk permeable medium occupied by pore space remain-ing after adsorption. The modified phase saturationSαis defined as the fraction of the reduced pore volume occu-pied by phaseα. ciα is the modified volume fraction of
componentiin phaseα.
The phase flux−→uαis the modified average pore
veloc-ity vector of phaseαowing to convection and calculated from Darcy’s law
− →
uα=− kkrα
ˆ
ϕSαµα(
∇pα−γα∇z) ,α= 1,. . .,np, (2)
wherekis the permeability tensor,krαis the relative per-meability of fluid phaseα,µαis the dynamic viscosity of fluid phaseα,pαis the pressure in fluid phaseα,γαis the
specific weight of fluid phaseαandzrepresents depth. Two components of dispersion tensorKiαfor a homo-geneous isotropic permeable medium [24] are
(Kxx)iα= Diα
τ +
αlαu2xα+αtα u2yα+u2zα − → uα ,
(Kxy)iα= (αlα−αtα )uxαuyα − → uα ,
i= 1,. . .,nc; α=1,. . .,np, (3)
where the subscriptlrefers to the spatial coordinate in the direction parallel or longitudinal to bulk flow andtis any direction perpendicular or transverse tol.Diαis the effec-tive binary diffusion coefficient of componentiin phaseα
[25],αlαandαtαare the longitudinal and transverse
dis-persivities andτis the permeable medium tortuosity. For biodegradation model
Ri=−kiϕρi
1− ncv X j=1 ˆ cj np X α=1
Sαciα+ ˆci
+Qi,i= 1,. . .,nc.
(4)
wherekiis the reaction rate coefficient in units of inverse
time andQirepresents physical sources. The overall con-centration˜ciis defined as
˜
ci=
1− ncv X j=1 ˆ cj np X α=1
Sαciα+ ˆci,i= 1,. . .,nc. (5)
whereˆcjis the absorbed concentration of componentsj,
ncvis the total number of volume-occupying components andnpis the number of phases.
The magnitudes of the vector flux for each phase,
− →
uα, are computed as follows:
− →
uα= q
(uxα)2+ (uyα)2+ (uzα)2.
The porosity depends on pressure due to rock com-pressibility. Therefore,
ϕ=ϕR[1 +cr(p1−pS)] , (6)
whereϕRis the porosity at a specific pressurepS,p1is the water phase pressure andcris the rock compressibility at
pS. For a slightly compressible fluid, the component den-sity can be written as:
ρi=ρiRh1 +c0i (p1−pR) i
,i= 1,. . .,nc, (7)
whereρiR is the density of componentiat the standard pressurepR.c0i is the compressibility of componenti.
in each of the phase flux terms. By using the capillary pres-sure definition,the pressure equation in terms of the refer-ence phase pressure (phase 1) will be:
ϕRct∂p1 ∂t −∇·
kλrTc∇p1
=
=∇· k np X
α=1
λrαc∇pcα1 !
−∇· k np X
α=1
(λrαcγα)∇z !
−
−∆tF(˜ci) +
nc X
i=1 Qi
ρiR, (8)
wherectis the total system compressibility,p1is the pres-sure of phase 1, pcα1 is the capillary pressure, z is the depth,λrαcis the relative mobility andλrTcis the total rel-ative mobility.
The relative mobilities and total compressibility in(8)
are calculated using the following equations:
λrαc =λrα nc X
i=1
ρiciα, λrα= krα
µα, α= 1,. . .,np, (9)
λrTc= np X
α=1
λrαc, (10)
ct=cr+ [1 +cr(2p1−pS−pR)] nc X
i=1
c0i˜ci
. (11)
The term
∆tF(˜ci) =ϕ(p1−pR) nc X
i=1
c0i ∂
˜
ci ∂t
(12)
can be treated as a source type function.
To increase the stability and robustness in numerical modeling, on the contrary to what is commonly used in the literature, we do not neglect higher order terms in the con-servation equations.
The energy conservation equation reads
∂ ∂t " ˆ ϕ np X α=1
ραSαCVα+1−ϕˆρsCs #
T+
+∇· ϕˆ np X
α=1
ραSαCpα−→uαT−kT∇T !
=qc−qL, (13)
whereTis the temperature;CVαandCpαare the heat ca-pacities of phaseαat constant volume and pressure, re-spectively;Csis the heat capacity of the solid phase;kTis the thermal conductivity;qcis the heat source term; and qLis the heat loss to overburden and underburden forma-tions or soil.
All equations other than the basic equations (1), (2), (8) and (13) and auxiliary relations in the recently de-veloped model formulation, including the adsorption, chemical reaction, phase behavior and well modeling approaches, remain unchanged from the currently used chemical compositional model, details of which can be found in [4] and [7].
3
Wettability alteration model
In this section we present a brief description of the wettability alteration model. Relative permeabilities are calculated based on the Corey model as follows:
krl=k0rlS el
l ,l= 1, 2, 3, (14)
where subscript lindicates water, oil or microemulsion phase,k0rlis the relative permeability endpoint for phasel,
elis the Corey exponent of phaselandSlis the normalized
saturation of phasel. The normalized saturations are cal-culated as
Sl=
Sl−Slr
1−P3l=1Slr
,l= 1, 2, 3, (15)
whereSlis the saturation of phaselandSlris the
resid-ual saturation of phasel.Residual phase saturations are modeled as follows
Slr=Shighlr +
Slowlr −Shighlr
1 +TlNTl ,l= 1, 2, 3, (16)
whereShighlr andSlowlr are residual saturations of phaselat high and low trapping numbers, respectively (given as in-put parameters),Tlis a positive input trapping parameter
of phaselandNTlis the trapping number of phasel.Shighlr
are typically zero.
The trapping number for phaseldisplaced by phase
NTl=
−k·∇Φl′−k·
g(ρl′−ρl)∇h
σll′
l= 1, 2, 3, (17)
wherelandl′are the displaced and displacing fluids, re-spectively,Φis the flow potential,gis the gravitational ac-celeration,kis the permeability tensor,his the height to a reference datum,ρlandρl′are densities of the displaced
and displacing fluids, respectively, andσis the IFT. The endpoint relative permeability enhancements caused by residual-saturation reduction of the conjugate phase as a function of the trapping number are modeled using the following correlation validated against experi-mental data:
k0rl=k0rllow+ S
low l′r −Sl′r
Slow l′r −S
high l′r
×
×k0rlhigh−k0rllow, l= 1,2,3,
(18)
wherek0rllow and k0rlhigh represent the endpoint relative permeability of phasel at low and high trapping num-bers, respectively,Slowl′r andS
high
l′r are residual saturations
for phaselat low and high trapping numbers, respectively, andSl′ris the residual saturation of the conjugate phase
(e.g. oil is the conjugate phase for microemulsion phase). The following equation gives the relative permeability exponents as a function of the trapping number:
el=elowl +
Slowl′r −Sl′r
Slow l′r −S
high l′r
×
×ehighl −elowl , l= 1,2,3,
(19)
whereelowl andehighl represent the Corey exponents for low and high trapping numbers, respectively, specified as in-put parameters.
The equations above are solved once for the initial reservoir wettability conditionkinitialrl and once for the
altered condition of strongly water-wetkfinalrl . Two sets
of relative permeabilities k0rl,Srl,el
and trapping param-eters(Tl)corresponding to each wettability state are re-quired as model inputs. The relative permeability in each gridblock(krl)is then obtained by linear interpolation be-tween the relative permeabilities corresponding to the two different wettability conditions, provided the concentra-tion of surfactant in the gridblock is greater than the criti-cal micelle concentration. Interpolation is based on a scriti-cal- scal-ing factorω.
krl=ωkfinalrl + (1−ω)k initial
rl ,l= 1,2,3, (20)
whereωis the interpolation scaling factor andkfinalrl and kinitialrl represent the relative permeabilities corresponding to the two extreme wetting states (i.e., final and initial wet-tability states, respectively).
The scaling factor is either a constant user input pa-rameter or related to the adsorbed surfactant concentra-tion in each gridblock as follows:
ω= ˆ
Csurf
ˆ
Csurf+Csurf
, (21)
where Csurfˆ and Csurf represent the adsorbed and total concentration of surfactant, respectively.
The capillary pressure Pc is scaled with the oil/microemulsion and oil/water IFT (σomandσow)
as follows:
Pc= σom
σowCpc 1−Sl Epc
, (22)
whereCpcandEpcare endpoint and exponent for capillary pressure, respectively.Cpctakes into account the effect of permeability and porosity using the LeverettJ-function.
The capillary pressure as a function of wettability is also modeled using linear interpolation between the initial and final wetting state capillary pressures, as follows:
Pc=ωPfinalc + (1−ω)Pinitialc ,l= 1,2,3, (23)
4
Numerical simulation of
wettability alteration processes
While we developed the mathematical formulation for chemical flooding simulation, we did not provide enough numerical evidence to support our theoretical arguments made in our previous publication[7].
For validation of the enhanced simulation model, two laboratory experiments on wettability alteration are mod-eled using the modified code.
gives full description of the matching procedure and ob-tained results for each experiment[15].
In this work, an attempt was made to match the simu-lation results on wettability alteration modeling with those that have been published in the literature as a validation of the newly developed chemical compositional model for-mulation.
4.1
Numerical simulation of wettability
alteration processes in a static
imbibition cell test
To validate the implemented wettability alteration model described in section 3, the laboratory alka-line/surfactant imbibition experiments reported by Hirasaki and Zhang (2004) were used [13]. For numerical study of wettability effects on oil/water relative permeabil-ity and oil capillary-desaturation curve, we used the data measured by Mohanty (1983) and Morrow et al. (1973) [26], [27]. The parameters of capillary pressure and relative permeabilities used in our simulation are listed in Table 1.
Table 1:Relative Permeability and Capillary Pressure Parameters (Low Trapping Number in Matrix)
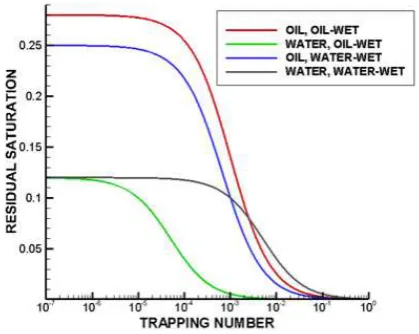
[image:8.595.336.546.72.239.2]Residual saturations, endpoint relative permeabilities and relative permeability exponents are given in Figs. 1 through 3 as functions of trapping number for different wetting conditions. Relative permeabilities calculated us-ing Eqs. 14 through 20 with a constant wettability scalus-ing factor of 0.5 for trapping number of10−7are given in Fig. 4. The capillary pressure curves calculated for water-wet and oil-wet conditions using Eq. 22 and a mixed-wet curve us-ing the scalus-ing factor of 0.5 in Eq. 23 are shown in Fig. 5.
Figure 1:Capillary desaturation curves used in simulations
Figure 2:Endpoint relative permeabilities varying with trapping number
The properties of the core and liquid are given in Table 2. Surfactant solution is a mixture of 0.025 weight% CS-330 (C12-3EO-sulfate) and 0.025% by weight of TDA-4PO-sulfate (C13-4PO-TDA-4PO-sulfate) added with 0.3 mole of sodium carbonate to reduce the adsorption of surfactants. The al-kalinity of sodium carbonate is also a reason for the forma-tion of surfactant. Descripforma-tion of the entire experimental and modeling procedure can be found in Fathi Najafabadi (2009) [15].
[image:8.595.64.314.429.535.2]sur-Table 2:The properties of the core used for the absorption experi-ment
[image:9.595.54.293.95.202.2]Table 3:The parameters of relative permeability and capillary pres-sure
Figure 3:Relative permeability exponents varying with trapping number
round the core. The middle 5×5×5 portion of the grids was given petrophysical properties representing the rock (Ta-ble3) and the remaining gridblocks were given properties representing the imbibition cell.
At first, the simulation model was run to determine the oil recovery based on the assumption that the wetta-bility is not altered from the original oil-wet conditions. It only models the effect of surfactant on interfacial ten-sion reduction and oil mobilization. Surfactant
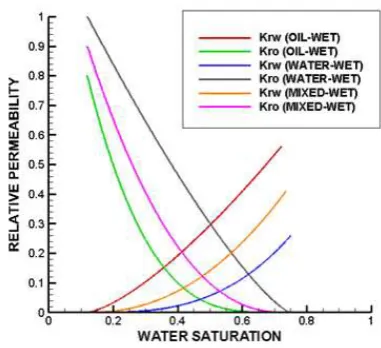
concen-Figure 4:Relative permeability curves for different wettability condi-tions at low trapping number of10−7
Figure 5:Capillary pressure curves for different wettability condi-tions
tration in gridblocks comprising the oil-wet core initially increases primarily due to an effective molecular diffu-sion and influences the onset of oil being produced from the core, but with very little impact on final oil recovery. An effective molecular diffusion/dispersion coefficient of
[image:9.595.53.283.244.555.2] [image:9.595.315.522.315.488.2]Next, the enhanced simulator was used to model com-bined interfacial tension reduction and wettability alter-ation effects of surfactant/alkali solution on oil recovery. It was assumed that the altered wettability state was water-wet with relative permeability and capillary pressure pa-rameters as shown in Table3. The interpolation scaling factors for this simulation were assumed to be a constant value of 0.5. The distribution of surfactant concentration and oil saturation after 10 days of imbibition are given in Figs. 7 and 8.
Figure 6:Initial surfactant concentration (volume fraction) for the imbibition test model. The vertical XZ cross section through the center (at Y-slice=4) of the model.
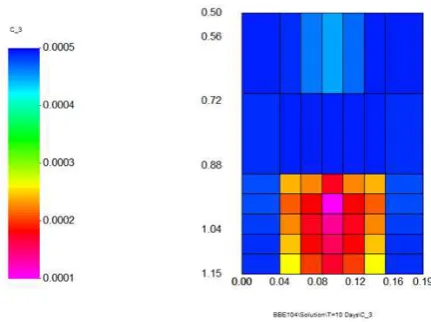
Figure 7:Surfactant concentration (volume fraction) after 10 days of imbibition. The vertical XZ cross section through the center (at Y-slice=4) of the model.
Figure 8:Oil saturation distribution after 10 days of imbibition. The vertical XZ cross section through the center (at Y-slice=4) of the model.
There is a good agreement between the surfactant con-centration and oil saturation as shown in Figs. 7 and 8. The rock gridblocks with higher surfactant concentration have lower oil saturation. These two figures also indicate the role of gravity in the oil recovery from the core plug. The rock gridblocks in the lower parts of the core have smaller oil saturations due to gravity drainage of the oil. The result with wettability alteration gives a much better agreement with the laboratory data than the case without wettability alteration. The simulation with wettability alteration has a faster response to oil production and a higher cumula-tive oil recovery. This is due to the increase in oil relacumula-tive permeability and initial change in capillary pressure from negative to positive during the wettability alteration pro-cess. Therefore, more surfactant solution is imbibed into the rock gridblocks displacing more oil before the interfa-cial tension reduction decreases the capillary pressure to zero. Alteration of the wettability towards more water-wet conditions increases oil mobility, recovery rate and its fi-nal recovery. Successful modeling of this experiment val-idates implementation of wettability alteration model in the modified simulation tool for the spontaneous imbibi-tion test.
4.2
Numerical simulation of wettability
alteration processes in a fractured block
[image:10.595.79.295.464.625.2]was examined. The Fractured Block experiment was car-ried out by Dr. Q. P. Nguyen and J. Zhang. The details and steps taken in modeling the fractured block experiment us-ing the UTCHEM simulator with the wettability alteration model were described in[15].
[image:11.595.61.286.264.388.2] [image:11.595.308.526.424.631.2]A numerical experiment was designed to get a better understanding of the mechanisms occurring in the flow of fluids such as alkali and surfactant in naturally fractured formations. Alkali agent was used as a wettability modi-fier and surfactant solution was used to lower the interfa-cial tension and enhance oil recovery by oil emulsification (Fathiet al., 2008) [14]. A 3D discrete fracture model con-sisting of 6 fractures was used (Fig. 9).
Figure 9:The computational domain and pressure distribution re-solved with 31×11×3 (X×Y×Z) grid points
Two of these fractures are parallel and four are per-pendicular to the flow direction. The end caps were mod-eled as fractures and the injection and production wells were placed in these openings to model the same condi-tions as in the experiment. The matrix gridblock size was
1/3′′×1/3′′×1/3′′. Fracture aperture was 1 mm (0.039370"). Fracture gridblocks were assumed to have a porosity of 1 as opposed to 0.298 for matrix blocks (based on laboratory material balance). A uniform and isotropic matrix perme-ability of3.36 ×10−14m2(34 md) was used based on labo-ratory measurements. A uniform initial saturation was as-sumed based on the measured values. Table 4 summarizes the base case simulation parameters.
Table 4:Simulation input parameters for base case model of frac-ture block experiment
Oil recovery was measured for the three different fluid injection steps. Injection of 4.8 wt% NaCl solution at 5 ml/hr resulted in an ultimate recovery of about 15% OOIP. During the first few hours of waterflood, no oil was pro-duced from the setup. This delay was due to the volume of the tube connecting the fracture block setup to the sam-ple collection unit. This was not properly communicated to the modeling group at the time of modeling of the ex-periment. Next, water containing 1 wt% sodium metabo-rate(NaBO2)and 3.8 wt%NaClinjected at the same rate
mobilized additional 15% OOIP. The producing oil cut was reduced to zero at the end of the alkaline flood. A mix-ture of alkali/surfactant was then injected at the same flow rate, rendering incremental recovery of 6% OOIP. The surfactant solution contained 1.5 wt% PetroStep®S-1 and 0.5 wt% PetroStep®S-2, 2 wt% secondary butanol as co-solvent, 1 wt% sodium metaborate and 3.8 wt% NaCl. This surfactant formulation formed a microemulsion with the crude oil which exhibits an IFT of 0.0008 mN/m. It is im-portant to note that the pressure gradient was around 0.8 psi/ft throughout the experiment. This pressure gradient corresponds to the pressure difference at the inlet and out-let of the setup.
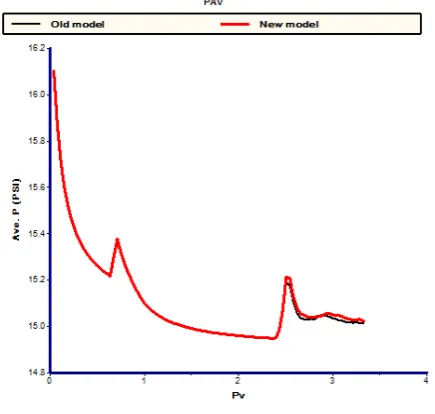
[image:11.595.53.294.661.719.2]The result of this model for the range of 0 - 4 PV for average pressure in the form of integral curve is shown in Figure 10.
Figure 10:Average pressure vs. injected pore volume
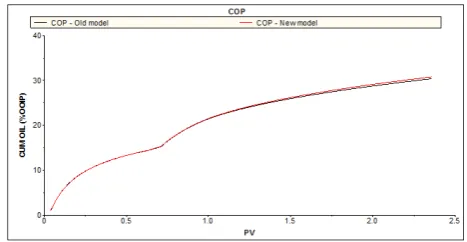
pro-vided well-correlated data when compared with the vali-dated and published results (see Fig.11).
Figure 11:Comparison of oil recovery curves simulated using the currently used and the newly developed chemical compositional models for the waterflood and alkali flood part of the fractured block experiment
As it can be seen from the above numerical analy-sis, the new and currently used formulation results are very much the same. In this work, through its application to the above-mentioned numerical experiments and com-parisons with existing chemical compositional model’s numerical results, the newly developed formulation has proven to be practical and reliable. The main mechanism for oil recovery from fractured carbonate reservoirs is a combination of viscous, gravity and capillary forces. Capil-lary pressure and relative permeability curves are the main petrophysical properties affected by the wettability alter-ation. The capillary pressure shift towards positive values (more water-wet conditions) and the shift of relative per-meability curves towards more ideal straight line water-wet conditions are a good indication of an efficient chem-ical EOR process. These processes can be modeled in the newly developed simulator for modeling chemical EOR processes.
Residual oil saturation does not decrease significantly due to small trapping number in gridblocks during chemi-cal process. This process can be simulated by the alkali op-tion in the new simulator with no effect on IFT and residual oil saturation.
5
Conclusion
The new chemical compositional model formulation was validated against existing chemical compositional simu-lator for imbibition test data using matrix carbonate rocks and coreflood cell tests. Numerical oil recovery findings for
imbibitions and coreflood cell tests are in good agreement with observed results in UTCHEM.
Through its application to the numerical experiment using a wettability alteration model and comparisons with existing chemical compositional model’s numerical re-sults, the new formulation has proven to be practical, reli-able and more streli-able.
Test cases’ results of water and alkaline floods in a 3D fractured block were successfully compared with cor-responding results from UTCHEM simulator. Very good match between the currently used chemical compositional model and the new model formulations’ results was ob-tained.
Acknowledgement: This research work was financially supported by the Ministry of Education and Science of the Republic of Kazakhstan under grants No. 1735/GF4 and No. 0128/GF4.
References
[1] Pope, G. A. and Nelson, R. C., 1978. A Chemical Flooding Com-positional Simulator, Soc. Pet. Eng. J., 18, 339-354.
[2] Saad, N., 1989. Field Scale Studies With a 3-D Chemical Flooding Simulator, Ph.D. dissertation, The University of Texas at Austin. [3] Delshad, M., Pope, G. A. and Sepehrnoori, K., 1996. A Composi-tional Simulator for Modeling Surfactant Enhanced Aquifer Re-mediation, Journal of Contaminant Hydrology, 23, 303-327. [4] Delshad, M., Pope, G.A., Sepehrnoori, K., 2000. UTCHEM
Version-9.0, Technical Documentation, Center for Petroleum and Geosystems Engineering. The University of Texas at Austin, Texas.
[5] Chen, Z., Huan, G., and Ma, Y., 2006. Computational methods for multiphase flows in porous media. Philadelphia: Society for Industrial and Applied Mathematics.
[6] Chen, Z., Ma, Y., and Chen, G., 2007. A sequential numerical chemical compositional simulator. Transport in Porous Media 68, 389-411.
[7] Bekbauov, B. E., Kaltayev, A., Berdyshev, A., 2015. A New Math-ematical Formulation of the Governing Equations for the Chem-ical Compositional Simulation // arXiv:1512.08170 [physics.flu-dyn].
[8] Bekbauov, B., Berdyshev, A. and Baishemirov, Zh., 2016. Nu-merical Simulation of Chemical Enhanced Oil Recovery Pro-cesses // In: A. Kononov et al. (eds.): DOOR 2016, published online on the CEUR web site http://ceur-ws.org with ISSN 1613-0073. Vol-1623, 28-34.
[9] Castillo, C. L., 2003. Modeling Wettability Alteration Using a Chemical Compositional Simulator, UTCHEM, Masters report, University of Texas at Austin.
[11] Fathi Najafabadi, N., 2005. Modeling Wettability Alteration in Naturally Fractured Reservoirs, Master’s Thesis, The University of Texas at Austin.
[12] Delshad, M., Fathi Najafabadi, N., Anderson, G. A, Pope, G. A., and Sepehrnoori, K., 2006. Modeling Wettability Alteration in Naturally Fractured Reservoirs, Paper SPE 100081, presented at the SPE/DOE Symposium on Improved Oil Recovery, Tulsa, Ok-lahoma, April, 22-26.
[13] Hirasaki, G. and Zhang, D.L. Surface Chemistry of Oil Recovery from Fractured, Oil-Wet, Carbonate Formation. SPE J. 2004. 9 (2): 151-162. SPE-88365-PA.
[14] Fathi Najafabadi, N., Delshad, M., Sepehrnoori, K., Nguyen, Q. P., and Zhang, 2008. Chemical Flooding of Fractured Carbon-ates Using Wettability Modifiers, presented at SPE Symposium on Improved Oil Recovery, Tulsa, Oklahoma, 19-23. Paper SPE 113369,
[15] Fathi Najafabadi, N., 2009. Modeling Chemical EOR Processes Using IMPEC and Fully Implicit Reservoir Simulators. Disserta-tion, University of Texas at Austin.
[16] Yu, L., Kleppe, H., Kaarstad, T. and Skjaeveland, S. M., 2008. Modelling of wettability alteration processes in carbonate oil reservoirs // Networks and heterogeneous media, Volume 3, Number 1, pp. 149-183.
[17] Sadeqi-Moqadam, M., Riahi, S., Bahramian, A., 2016. Monitor-ing wettability alteration of porous media by streamMonitor-ing poten-tial measurements: Experimental and modeling investigation // Colloids and Surfaces A: Physicochemical and Engineering As-pects. Volume 497, Pages 182-193.
[18] Andersen, P. Ø., Evje, S., Kleppe, H., Skjæveland, S. M., 2015. A Model for Wettability Alteration in Fractured Reservoirs // SPE Journal, SPE-174555-PA, Volume 20, Issue 06. P. 15.
[19] Lashgari, H., Xu, Y., Sepehrnoori, K., 2016. Modeling Dynamic Wettability Alteration Effect Based on Contact Angle // SPE-179665-MS, SPE Improved Oil Recovery Conference, At Tulsa, Oklahoma, USA.
[20] Ju, B. and Fan, T., 2012. Wettability Alteration and Its Effects on Production in Water Flooding // Petroleum Science and Technol-ogy, Volume 30 - Issue 16, Pages 1692-1703.
[21] Flovik, V., Sinha, S. and Hansen, A., 2015. Dynamic Wettability Alteration in Immiscible Two-phase Flow in Porous Media: Effect on Transport Properties and Critical Slowing Down. Front. Phys. 3:86. doi: 10.3389/fphy.2015.00086.
[22] Bekbauov, B. E., Kaltayev, A., Wojtanowicz, A. K., and Pan-filov, M. Numerical Modeling of the Effects of Dispropor-tionate Permeability Reduction Water-Shutoff Treatments on Water Coning // Journal of Energy Resources Technology – March 2013 – Volume 135, Issue 1, 011101 (10 pages) http://dx.doi.org/10.1115/1.4007913.
[23] Bekbauov, B. E., Kaltayev, A., Nagy, S. Three-Dimensional Ther-mal Petroleum Filtration Study of Water Coning // Archives of Mining Sciences. - Cracow, Poland, 2010. - Vol. 55, No 1. - P. 201-215.
[24] Bear, J., 1972. Dynamics of Fluids in Porous Media, Dover, New York.
[25] Bird, R. B., Stewart, W. E., and Lightfoot, E. N., 2002. Transport Phenomena, 2nd edition, John Wiley and Sons, New York. [26] Mohanty, K. K., 1983. Multiphase Flow in Porous Media: III. Oil
Mobilization, Transverse Dispersion, and Wettability paper SPE 12127 presented at the SPE Annual Technical Conference and Exhibition, San Francisco, CA October 5-8.
[27] Morrow, N. R., Cram, P. J., and McCaffery, F. G., 1973. Displace-ment Studies in Dolomite with Wettability Control by Octanoic Acid. SPE J. 13 (4): 221-232; Trans., AIME, 255. SPE-3993-PA. [28] Lam, A. and Schechter, R. S., 1987. The Theory of Diffusion in