This is a repository copy of
IoT Based Energy Consumption Monitoring Platform for
Industrial Processes
.
White Rose Research Online URL for this paper:
http://eprints.whiterose.ac.uk/140447/
Version: Accepted Version
Proceedings Paper:
Gan, S, Li, K, Wang, Y et al. (1 more author) (2018) IoT Based Energy Consumption
Monitoring Platform for Industrial Processes. In: 2018 UKACC 12th International
Conference on Control (CONTROL). CONTROL 2018, 05-07 Sep 2018, Sheffield, UK.
IEEE , pp. 236-240. ISBN 9781538628645
https://doi.org/10.1109/CONTROL.2018.8516828
©2018 IEEE. Personal use of this material is permitted. Permission from IEEE must be
obtained for all other uses, in any current or future media, including reprinting/republishing
this material for advertising or promotional purposes, creating new collective works, for
resale or redistribution to servers or lists, or reuse of any copyrighted component of this
work in other works.
eprints@whiterose.ac.uk https://eprints.whiterose.ac.uk/
Reuse
Items deposited in White Rose Research Online are protected by copyright, with all rights reserved unless indicated otherwise. They may be downloaded and/or printed for private study, or other acts as permitted by national copyright laws. The publisher or other rights holders may allow further reproduction and re-use of the full text version. This is indicated by the licence information on the White Rose Research Online record for the item.
Takedown
If you consider content in White Rose Research Online to be in breach of UK law, please notify us by
IoT based energy consumption monitoring platform
for industrial processes
Shaojun Gan
School of Electronic and Electrical Engineering
University of Leeds Email:s.gan@leeds.ac.uk
Kang Li
School of Electronic and Electrical Engineering
University of Leeds Email:K.li1@leeds.ac.uk
Yanxia Wang
School of Electronic and Electrical Engineering
University of Leeds Email:y.wang2@leeds.ac.uk
Che Cameron
School of Electronics, Electrical Engineering and Computer Science
Queen’s University Belfast Email:ccameron07@qub.ac.uk
Abstract—Reducing the energy consumption is a major con-cern faced by industries worldwide to improve the economic performance while to reduce its CO2 footprint, and monitoring the energy usage at the component level is essential. This paper presents a design of an IoT (Internet of Things) based interactive system which combines non-invasive sensors and data acquisition apparatus, robust communication networks, clouds-based databases and web servers to achieve real-time monitoring of energy usage in industries. The collected energy consumption data are published to the data centre automatically through the wireless communication network using the MQTT protocol, while a web server driven by Apache is developed to provide a human-data interaction dashboard in B/S (Browser / Server) structure. The system can not only assist industrial energy management but also provide a platform to improve energy-saving, emission reduction, along with other potentials. The system has been implemented in a local bakery company, confirming its applicability for remote real-time monitoring of energy consumption in the industry.
I. INTRODUCTION
The impact of global climate change, such as the rise of global temperature, shift of rainfall patterns, and extreme climate patterns, presents one of the most significant chal-lenges for mankind. It is believed that these changes are linked to the substantial emissions of carbon dioxide and other greenhouse gases (GHG) [1]. Research shows that the excessive inefficient use of fossil resources is a key factor which leads to more GHG emissions. Governments worldwide have set ambitious targets to reduce GHG emissions. For example, the UK government has committed to reducing GHG emissions by at least 80 percent by 2050 with respect to 1990 levels [2]. Whilst, the Chinese government has committed to reducing its carbon intensity by roughly 60 to 65 percent from 2005 levels by 2030. Globally, industries account for 33% of the total GHG emotions. It is therefore imperative to improve the energy efficiency and reduce the total energy consumption in the industries in order to achieve lower GHG emissions [3]. To identify and monitor the most energy intensive compo-nents of a process is the first stage for taking further actions to improve the energy efficiency [4]. Complex industrial pro-cesses often have a large number of devices and components, each consuming different amount of energies and working in different states. To audit the energy usage in industry, in particular for SMEs where such information is often
unavail-able, or there is no technical support to help them acquire such insight in energy usage or such technical support is too expensive to deploy, it is imperative to develop a low-cost easy accessible platform for real-time energy monitoring at different level of system granularity [5]. The system should be able to collect, pre-process, transmit and store these data for further analysis, i.e. process maintenance, modelling and optimisation. Different from other applications, to install energy related sensors with wired communication network is unfeasible in industries, while conventional wireless communication net-works are often subject to significant inferences emitted from machines. Furthermore, to enhance industrial acceptance, it is crucial to design the monitoring system to be minimal invasive, such that sensing, data acquisition and transmission cause little interruptions to the process [6].
To tackle the aforementioned challenges, an interactive system based on the Point Energy Technology for industrial energy monitoring was designed and developed. Non-intrusive sensors, such as the current transformers and smart power meters are used to measure the industry electricity usage, ultrasonic flow meters are employed for the gas and water usage. For processes where SCADA data is available, the acquired signals are directly used to calculate the energy usage [7]. To reduce the electromagnetic interference and to simplify the installation process, a MQTT protocol based LoRa communication network is used to transmit the on-site data to the data server which is driven by MySQL. Finally, a web-based dashboard connected to the data server is developed to provide both the historic and real-time energy usage in-formation consumed by key components in the process. The remainder of this paper is organized as follows. Section II introduces the structure of the designed monitoring platform and a detail implementation of the platform is developed in section III. Section VI gives a brief analysis of the collected energy data. Finally, Section V concludes the paper.
II. SYSTEM STRUCTURE
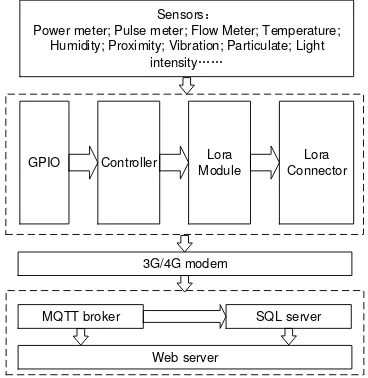
which stores and displays the real-time on-site information data analysis for energy management is also included in this layer. Figure 1 is an illustration of the design structure of the developed system.
Sensors
Power meter; Pulse meter; Flow Meter; Temperature; Humidity; Proximity; Vibration; Particulate; Light
intensity
GPIO Controller Lora Module
Lora Connector
3G/4G modem
MQTT broker SQL server
[image:3.612.82.266.112.301.2]Web server
Fig. 1. System structure of the proposed interactive system
A. Perception layer
The Perception layer is directly linked to the industrial processes which mainly consists of various industrial sensors, such as smart power meters, current transformers, pulse me-ters, flow meme-ters, temperature sensors, humidity sensors, etc. It also interfaces with SCADA system used in the industry if the protocol is available.
B. Data transmission layer
This layer mainly transmits the data acquired from various sensors and SCADA systems to the cloud sever. Data pre-processing methods such as filters and outlier detection and removal are embedded in the controller first, which can help to reduce the quantity of transmitted data, and thus the energy consumption of the communication nodes. After prepossess-ing, the data is transferred to the LoRa module or stored in the transmit queue depends on the data effectiveness time and data length. If the monitored industrial process changes fast, data can be sent to the LoRa module directly with the time stamp. The LoRa communication network is chosen to transmit data in the industrial sites due to a number of merits [8]:
• Lora uses 868 MHz/ 915 MHz ISM bands which is freely
available world wide.
• Lora has a wide coverage range from 5 km in urban areas
and 15 km in suburban areas, thus a single Lora gateway can cover most industrial sites.
• Lora has advantages in terms of battery lifetime due to
lower working power compared to other wireless commu-nications. Researches indicate that a Lora communication node can last up to 10 years on a single AA battery with 12 miles transmitting range [9]. This makes the Lora
network particularly suitable for industry usage with less maintenance.
• Single LoRa Gateway device is designed to cover 1000
end devices and nodes. Thus one or two Lora gateways are sufficient to cover most industrial applications.
• Lora network is easy to install due to its simple
architec-ture.
• Lora uses Adaptive Data Rate technique to vary output
data rate/ Rf output of end devices. This helps to max-imize the battery life as well as overall capacity of the LoRaWAN network. The data rate can vary from 0.3 kbps to 27 Kbps for the 125 KHz bandwidth.
• Lora is widely used for Machine to Machine (M2M) /
IoT applications.
C. Application layer
Data can be published to remote MQTT broker directly through the internet from the LoRa gateway. MQTT is a lightweight messaging protocol designed for M2M (machine to machine) telemetry in low bandwidth environments, it has became one of the main protocols in IoT based deployment [10]. Even though MQTT uses an unsecured TCP, data are able to be encrypted using TLS/SSL which makes the data transmission more secure [11]. Another key feature which makes MQTT suitable for IoT applications is the Quality of Service (QoS). Three different level of QoS is defined in the MQTT protocol based on the importance of each message and the repetitiveness of the messages. Level 0 messages will be transmitted only once. Level 1 messages will be sent several times to ensure the message is received, and the receiver may receive the message more than once. Level 2 is the most secure level of message publication. This mechanism ensures the IoT based communication easier to implement in unreliable network environment as the protocol can handle the re-transmission and guarantee the successful delivery of messages.
To leverage the full potential of platform for effective energy management, a SQL data server is deployed to store all the industrial historic data. Finally, a web server is developed to host a dashboard based web application to present the visualization of data directly collected from the MQTT broker or retrieved from the SQL server. As the web server is published on the internet, the dashboard based web application is accessible anywhere and anytime using computers, laptops, tablets, mobile phones etc, enabling remote energy manage-ment by manufacturers.
III. IMPLEMENTATION
bakery industry, making a significant contribution to the reduc-tion of GHG emissions. Key equipment in a bakery process include mixers, dividers (bun and bread former), fermenters (proofing oven), bake oven, chiller units and boilers, and energy resources consumed in these processes often include electricity, steam and nature gas.
The energy monitoring system deployed in the bakery company include:
• ABB B24 digital power meter .
• HOBUT Split Core Current Transformer. • Gas meter.
• Raspberry Pi2.
• LoRa node MTDOT-915-X1P-SMA-1. • LoRa gateway MTCDT H5.
• 3G/4G router.
Combined with the current transformers, the three-phase voltage, current, power and power factors can be obtained simultaneously through a digital power meter.
In the bakery company, the installed gas meter generates 10 pulses for consuming every cubic meter gas, thus the gas usage can be calculated by counting the number of pulses. The gas consumption rate is also accessible based on the pulse rate. To collect the data from the gas meter and the digital power meter, a raspberry pi is adopted. To transmit the sensor data to the data server via the LoRa network, the LoRa module MTDOT-915-X1P-SMA is used which has a maximum transmission power of 19 dBm, a maximum receiver sensitivity of -137 dBm and a point to point link budget of 147 dB. For the LoRa gateway, Multiconnect Conduit (MTCDT H5) is adopted. The LoRa gateway is then connected to a 3G modem to send the data to the data centre through the internet. The hardware scheme provides the capability of collecting energy consumption data from multiple industrial devices and transmitting data to the data centre.
The software development includes the storage, analysis and visualization of energy consumption data. The development environment includes:
• Ubuntu operating system. • Mosquitto MQTT broker. • MySql database.
• Apache. • Django 2.02. • Python 3.0.
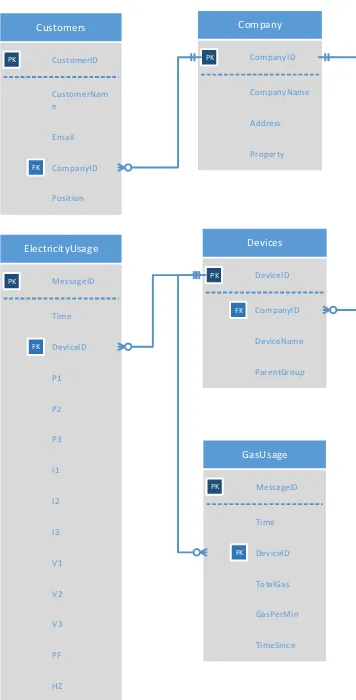
The mosquitto MQTT is a lightweight open source message broker that implements the MQTT protocol and it is embedded in an Ubuntu server. However, it does not support the Web-Socket protocol by default, hence the connection to a web browser is not allowed. To overcome this shortfall to enable the design and development of a web-based interactive system for remote monitoring, it is necessary to make a connection from the web APIs to deliver the real-time display of industrial data. To enable WebSocket support in the mosquitto broker, configurations was modified to add an listener port and asso-ciated protocol. Once this was completed, tables in the SQL server were created to store data, the database ER diagram
is shown in figure 2. The ’ElectricityUsage’ and ’GasUsage’ tables store all the electricity and gas usage in the bakery company. ’Pi’, ’Ii’ and ’Vi’ ( i = 1, 2, 3 ) are the power, current and voltage in each power phase. ’PF’ is the power factor. ’Hz’ is the power frequency. As different devices and processes may consume different type of energy, each table is assigned a field named ’DeviceID’ to distinguish the exact energy consumption of each device and process. Besides, customer information table is designed to store the login information to ensure the secure access of the data. Finally, an Apache based web server was deployed to host the web application which is designed in a dashboard style for remote monitoring. The web server gains the access to both the real-time energy data through the MQTT broker and the historic data through SQL server at the same time. By appropriate authentication and access control, only authorised users and industry administrators can access to the dashboard display of the process data using computers, laptops, tablets or smart phones any time any place. Figures 3 and 4 are snapshots of the designed web page for monitoring the electricity and gas usages in the bakery industry.
Customers
Devices ElectricityUsage
GasUsage Company
CustomerID PK
CustomerNam e
CompanyID FK
Position
DeviceID PK
DeviceName CompanyID FK
ParentGroup MessageID
PK
Time
DeviceID FK
P1
P2
P3
I1
I2
I3
V1
V2
V3
PF
HZ
MessageID PK
Time
To talGas
GasPerMin
TimeSince DeviceID FK
CompanyID PK
CompanyName
Address
[image:4.612.348.526.345.695.2]Property
Fig. 3. The electricity consumption display interface
Fig. 4. The gas usage monitoring in the industrial process
Mixer startup time rate in 24 hours
1
1
2
2
3
3
4
4
6
6
7
7 88 991010
11
11
12
12
18
18
19
19
20
20
21
21
22
22
Highcharts.com
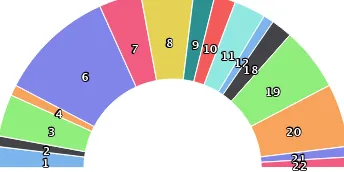
[image:5.612.351.523.55.142.2]power on Mixer Power On Time Rate in 24 Hour
Fig. 5. The hourly power-on rate of the bakery mixer in 24 hours of a
particular date
Mixer shutdown time rate in 24 hours 2
2 7 7
8 8
11 11 13131414
15 1516161818
19 19
20 20 21 21 22 22 23 23 0 0
[image:5.612.83.265.317.537.2]Highcharts.com
Fig. 6. The hourly power-off rate of the bakery mixer in 24 hours of a
particular date
IV. DATA ANALYSIS
Analysis of the collected energy consumption data can help to gain insights of the processes, such as the patterns of energy usages in the process, and potential faults hidden in the process, etc. Figures 5 and 6 are the distributions of the power-on and power-off time of a mixer from 0 am to 24 pm. It is clear that the mixer was powered on at most hours of the day except for 0 am, 5 am, 13 pm, 14 pm, 15pm, 16 pm, 17pm and 23 pm. Likewise, the Mixer was also turned off at most of the hours of the day. A simple statistics show that the hourly power-on probability of the mixer at 6:00 am and 20:00 pm are 23.1% and 16.2% respectively. The most likely time to turn off the mixer is 7 am, 8 am and 19 pm with more than 50% probability.
Fig. 7. The hourly power consumption monitoring of the device from 26th February to 25th March 2018
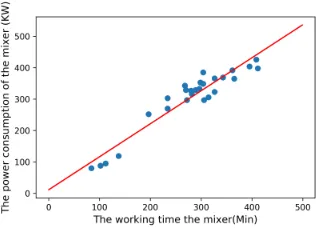
[image:5.612.348.528.381.486.2] [image:5.612.88.260.574.660.2]con-sumption of the mixer was strongly correlated to the working time, however they were not exactly linearly correlated.
Fig. 8. The linear regression of the energy consumption with working time
V. CONCLUSION
This paper has presented an energy consumption monitoring system which integrates the capability of IoT and cloud-based technologies to achieve noninvasive remote monitoring of the industrial process. Through experimental analysis, we have shown that the developed system is scalable and easy to install in industrial sites.
Through the analysis of the monitoring data, the working status of the industrial processes is intuitively inferrable. An example to analyze the mixer data has been made and the result confirms that the energy consumption of the mixer was strongly correlated to the working time, but not exactly linearly correlated.
REFERENCES
[1] P. W. Griffin, G. P. Hammond, and J. B. Norman, “Industrial energy use and carbon emissions reduction: a uk perspective,”Wiley Interdisci-plinary Reviews: Energy and Environment, vol. 5, no. 6, pp. 684–714, 2016.
[2] P. Therkelsen, E. Masanet, and E. Worrell, “Energy efficiency opportuni-ties in the us commercial baking industry,”Journal of Food Engineering, vol. 130, pp. 14–22, 2014.
[3] C. H. Dyer, G. P. Hammond, C. I. Jones, and R. C. McKenna, “Enabling technologies for industrial energy demand management,”Energy Policy, vol. 36, no. 12, pp. 4434–4443, 2008.
[4] Y. Seow and S. Rahimifard, “A framework for modelling energy
consumption within manufacturing systems,”CIRP Journal of
Manu-facturing Science and Technology, vol. 4, no. 3, pp. 258–264, 2011. [5] J. Deng, K. Li, E. Harkin-Jones, M. Price, M. Fei, A. Kelly, J.
Vera-Sorroche, P. Coates, and E. Brown, “Low-cost process monitoring for
polymer extrusion,”Transactions of the Institute of Measurement and
Control, vol. 36, no. 3, pp. 382–390, 2014.
[6] J. Kline and C. Kline, “Power modeling for an industrial installation,” inCement Industry Technical Conference, 2017 IEEE-IAS/PCA. IEEE, 2017, pp. 1–10.
[7] L. I. Minchala, S. Ochoa, E. Velecela, D. F. Astudillo, and J. Gonza-lez, “An open source scada system to implement advanced computer integrated manufacturing,”IEEE Latin America Transactions, vol. 14, no. 12, pp. 4657–4662, 2016.
[8] K. Mikhaylov, J. Petaejaejaervi, and T. Haenninen, “Analysis of capacity and scalability of the lora low power wide area network technology,” in European Wireless 2016; 22th European Wireless Conference; Proceed-ings of. VDE, 2016, pp. 1–6.
[9] A. Augustin, J. Yi, T. Clausen, and W. M. Townsley, “A study of lora: Long range & low power networks for the internet of things,”Sensors, vol. 16, no. 9, p. 1466, 2016.
[10] U. Hunkeler, H. L. Truong, and A. Stanford-Clark, “Mqtt-sa pub-lish/subscribe protocol for wireless sensor networks,” inCommunication systems software and middleware and workshops, 2008. comsware 2008. 3rd international conference on. IEEE, 2008, pp. 791–798.
[11] C. Lesjak, D. Hein, M. Hofmann, M. Maritsch, A. Aldrian, P. Priller, T. Ebner, T. Ruprechter, and G. Pregartner, “Securing smart maintenance services: hardware-security and tls for mqtt,” in Industrial Informatics (INDIN), 2015 IEEE 13th International Conference on. IEEE, 2015, pp. 1243–1250.
[12] A. Mondal and A. Datta, “Bread baking–a review,”Journal of Food