10–150 M models at Z = 10E−3
⊙
.
White Rose Research Online URL for this paper:
http://eprints.whiterose.ac.uk/142408/
Version: Accepted Version
Article:
Laird, Alison Monica orcid.org/0000-0003-0423-363X (2018) Non-standard s-process in
massive rotating stars - Yields of 10–150 M models at Z = 10E−3. Astronomy &
⊙
Astrophysics. A133. ISSN 0004-6361
https://doi.org/10.1051/0004-6361/201833283
[email protected] https://eprints.whiterose.ac.uk/
Reuse
Items deposited in White Rose Research Online are protected by copyright, with all rights reserved unless indicated otherwise. They may be downloaded and/or printed for private study, or other acts as permitted by national copyright laws. The publisher or other rights holders may allow further reproduction and re-use of the full text version. This is indicated by the licence information on the White Rose Research Online record for the item.
Takedown
If you consider content in White Rose Research Online to be in breach of UK law, please notify us by
July 11, 2018
Non standard s-process in massive rotating stars
Yields of
10
−
150
M
⊙models at
Z
=
10
−3Arthur Choplin
1, Raphael Hirschi
2,3,4, Georges Meynet
1, Sylvia Ekström
1, Cristina Chiappini
5and Alison Laird
4,61 Geneva Observatory, University of Geneva, Maillettes 51, CH-1290 Sauverny, Switzerland
e-mail: [email protected]
2 Astrophysics Group, Lennard-Jones Labs 2.09, Keele University, ST5 5BG, Staffordshire, UK
3 Kavli Institute for the Physics and Mathematics of the Universe (WPI), University of Tokyo, 5-1-5 Kashiwanoha, Kashiwa,
277-8583, Japan
4 UK Network for Bridging the Disciplines of Galactic Chemical Evolution (BRIDGCE) 5 Leibniz-Institut für Astrophysik Potsdam, An der Sternwarte 16, 14482, Potsdam, Germany 6 Department of Physics, University of York, York YO10 5DD, United Kingdom
Received/Accepted
ABSTRACT
Context.Recent studies show that rotation significantly affects the s-process in massive stars.
Aims.We provide tables of yields for non-rotating and rotating massive stars between 10 and 150M⊙atZ =10−3([Fe/H]=−1.8).
Tables for different mass cuts are provided. The complete s-process is followed during the whole evolution with a network of 737 isotopes, from Hydrogen to Polonium.
Methods.A grid of stellar models with initial masses of 10, 15, 20, 25, 40, 60, 85, 120 and 150M⊙and with an initial rotation rate
of both 0 or 40% of the critical velocity was computed. Three extra models were computed in order to investigate the effect of faster rotation (70% of the critical velocity) and of a lower17O(α, γ) reaction rate.
Results.At the considered metallicity, rotation has a strong impact on the production of s-elements for initial masses between 20 and
60M⊙. In this range, the first s-process peak is boosted by 2−3 dex if rotation is included. Above 60M⊙, s-element yields of rotating
and non-rotating models are similar. Increasing the initial rotation from 40 % to 70 % of the critical velocity enhances the production of 40.Z.60 elements by∼0.5−1 dex. Adopting a reasonably lower17O(α, γ) rate in the fast rotating model (70 % of the critical
velocity) boosts again the yields of s-elements with 55.Z .82 by about 1 dex. In particular, a modest amount of Pb is produced. Together with s-elements, some light elements (particularly fluorine) are strongly overproduced in rotating models.
Key words. stars: massive−stars: rotation−stars: interiors−stars: abundances−stars: chemically peculiar−nuclear reactions, nucleosynthesis, abundances
1. Introduction
The standard view of the s-process in massive stars is that it oc-curs in He- and C-burning regions and contributes to the pro-duction of elements up to about A = 90, hence giving only s-elements up to the first peak, atN=50, whereNis the number of neutrons (e.g. Peters 1968; Couch et al. 1974; Lamb et al. 1977;Langer et al. 1989;Raiteri et al. 1991a,b,1993;Käppeler et al. 2011, and references therein). In standard models of mas-sive stars, both the neutron source (mainly22Ne) and the seed (mainly 56Fe) decrease with initial metallicity while the main
neutron poison (16O) remains similar whatever the metallicity,
leading to a threshold of aboutZ/Z⊙ = 10−2 below which the
s-process becomes negligible (Prantzos et al. 1990).
Meynet et al. (2006) and Hirschi (2007) suggested that this picture would be modified in rotating stars because of the rotational mixing operating between the H-shell and He-core during the He-core helium burning phase. The abundant 12C and16O isotopes in the convective He-burning core are mixed
to the H-shell, boosting the CNO cycle and forming primary
14N (e.g. Meynet & Maeder 2002b; Ekström et al. 2008).
The 14N is mixed back into the convective He-burning core and allows the synthesis of extra 22Ne, via the reaction chain
14
N(α, γ)18F(,e+νe)18O(α, γ)22Ne. The growth of the convective
He-burning core also helps reaching layers that had been pre-viously enriched in 14N. Neutrons are finally released by the
22Ne(α,n)25Mg reaction.22Ne production in rotating stars is
ex-tensively discussed in Frischknecht et al. (2016) (section 3.1, their Fig. 2 to 5. See also Fig. 1 of Choplin et al. 2016, for a schematic view of this mixing process). By investigating the effect of rotation in a 25 M⊙ model, Pignatari et al. (2008)
have shown that rotational mixing would allow the production of s-elements up to A ≃ 140. Since then, a few studies (e.g.
Frischknecht et al. 2012,2016, F12 and F16 hereafter) started to build a picture of the s-process in massive rotating stars, by computing models of different masses (15 < M <40 M⊙) and
metallicities (10−7 <Z < Z
⊙) while following the complete
s-process during the evolution. So far, the most complete s-s-process study from rotating massive star models was carried out in F16. They computed 29 non-rotating and rotating models of 15, 20, 25 and 40M⊙, with metallicities ofZ = 0.014, 10−3, 10−5 and
10−7and with a nuclear network of 613 or 737 isotopes, depend-ing on the burndepend-ing phase.
The first one is the globular cluster NGC 6522, located in the galactic bulge and possibly being about 12.5 Gyr old (Kerber et al. 2018). It contains eight stars whose pattern is enriched in s-elements (Barbuy et al. 2009) and consistent with the yields of massive rotating models (Chiappini et al. 2011).
The second signature regards the iron-poor low mass stars enriched in s-elements in the halo of the Milky Way. Using an in-homogeneous galactic chemical evolution model,Cescutti et al.
(2013) have shown that the observed scatter in the [Sr/Ba] ratio of normal (i.e. not enriched in carbon, see next discussion) halo stars with [Fe/H]<−2.5 can be reproduced if including yields from fast rotating massive stars.
The third one regards some of the [Fe/H].−4 stars enriched is s-elements. At such a low metallicity, asymptotic giant branch (AGB) stars might not have contributed yet to the chemical en-richment. HE 1327-2326 (Aoki et al. 2006;Frebel et al. 2006,
2008) has [Fe/H]=−5.7, [Sr/Fe]=1.08, [Ba/Fe]<1.39 and is enriched in light elements (C, N, O, Na, Mg, Al) relatively to Fe. As discussed in the Sect. 7.2 ofMaeder et al.(2015), this is con-sistent with the ejecta of a fast rotating low-metallicity massive star, where a strong mixing between H- and He-burning zones occurred, triggering the synthesis of a variety of elements, in-cluding Sr and Ba.
A fourth signature concerns the CEMP-s stars that are Carbon-Enhanced Metal-Poor stars enriched in s-elements (Beers & Christlieb 2005). CEMP-s stars are mostly found at [Fe/H]> −3 (e.g.Yong et al. 2013;Norris et al. 2013). Some significantly s-rich stars also exist at [Fe/H]<−3, like HE 1029-0546 or SDSSJ1036+1212 with [Fe/H] around −3.3 (Behara et al. 2010;Aoki et al. 2013;Hansen et al. 2015). The peculiar chemical pattern of such stars is generally considered as acquired from a AGB star companion during a mass transfer (or wind mass transfer) episode (Stancliffe & Glebbeek 2008;Lau et al. 2009;Bisterzo et al. 2010,2012;Lugaro et al. 2012;Abate et al. 2013,2015a,b;Hollek et al. 2015). A consequence of such a sce-nario is that CEMP-s stars should mostly be in binary systems, which seems to be the case for most CEMP-s since they show ra-dial velocity variations (Lucatello et al. 2005;Starkenburg et al. 2014;Hansen et al. 2016). Nevertheless, some CEMP-s stars are very likely single stars (4 out of 22 in the sample ofHansen et al. 2016), challenging the AGB scenario. The yields of a fast rotat-ing 25 M⊙ model can reproduce the pattern of 3 out of the 4
apparently single CEMP-s stars (Choplin et al. 2017b). It is also not excluded that some CEMP-s stars in binary systems show the nucleosynthetic signature of massive rotating stars since massive rotating stars could have enriched the cloud in which the binary system formed. On the other hand, single CEMP-s stars may be explained by the AGB scenario anyway since (1) single CEMP-s stars might have lost their companion or (2) they might be in a bi-nary system with very long period, explaining the non-detection of radial velocity variation.
Extensive and homogeneous grids of massive stellar models including rotation and full s-process network are needed to fur-ther investigate the role of such stars in the chemical enrichment of the universe.
In this work, we study the impact of the rotation on the s-element production at a metallicity Z = 10−3 in mass fraction
and in the range 10−150 M⊙. We focus on one metallicity but
extend significantly the range of mass compared to the study of F16. It allows us to draw a more complete picture of the s-process in massive stars, at the considered metallicity. We in-vestigate also the impact of a faster initial rotation and a lower
17
[image:3.595.313.549.106.405.2]O(α, γ)21Ne reaction rate. Sect. 2 describes the physical in-gredients used throughout this work. Results are presented in
Table 1.Initial mass (column 1), model label (column 2), initial ratio of
surface velocity to critical velocity (column 3), time-averaged surface velocity during the MS phase (column 4), final nuclear phase computed (column 5), total lifetime (column 6) and final mass (column 7).
Mini Model υini/υcrit hυiMS phase τ Mfin
[M⊙] [km s−1] [Myr] [M⊙]
10 10s0 0.0 0 end C 23.4 9.9
10 10s4 0.4 214 end C 27.1 9.8
15 15s0 0.0 0 end Ne 13.0 14.8
15 15s4 0.4 234 end Ne 15.4 14.3
20 20s0 0.0 0 end Ne 9.32 19.9
20 20s4 0.4 260 end Ne 10.9 17.4
25 25s0 0.0 0 end Ne 7.61 24.7
25 25s4 0.4 281 end Ne 8.81 16.7
25 25s7 0.7 490 end Ne 9.20 16.2
25 25s7Ba 0.7 490 end Ne 9.20 16.0
40 40s0 0.0 0 end Ne 5.24 34.1
40 40s4 0.4 332 end Ne 5.97 24.6
60 60s0 0.0 0 end Ne 4.11 44.2
60 60s4 0.4 375 end Ne 4.62 40.8
85 85s0 0.0 0 end Ne 3.49 59.3
85 85s4 0.4 403 end Ne 3.88 58.3
120 120s0 0.0 0 end Ne 3.06 82.4
120 120s0Ba 0.0 0 end Ne 3.06 83.2
120 120s4 0.4 423 end He 3.36 85.8
150 150s0 0.0 0 end Ne 2.85 100.3
150 150s4 0.4 432 end Ne 3.14 99.6
aModels computed with the rate of17O(α, γ) divided by 10.
Sect.3. In Sect.4we investigate the effect of the mass cut and describe the table of yields. Section5presents the conclusions and additional discussions.
2. Physical ingredients
2.1. Input parameters
We used the Geneva stellar evolution code (Eggenberger et al. 2008). The models were computed atZ =10−3
([Fe/H]=−1.8) with initial masses of 10, 15, 20, 25, 40, 60, 85, 120 and 150M⊙.
The initial rotation rate on the zero-age main-sequence (ZAMS), υini/υcrit1 is 0, 0.4 or 0.7. Only the 25M⊙ was computed with
υini/υcrit = 0.7. As in Ekström et al.(2012) andGeorgy et al.
(2013), we useυini/υcrit =0.4 for the grid. It corresponds well
to the peak of the velocity distribution of the sample of 220 young main-sequence B-type stars ofHuang et al.(2010, their Fig. 6). At lower metallicities, stars are more compact and the mass loss by line driven winds is weaker so that the removal of angular momentum during evolution is smaller. Consequently, for a givenυini/υcritratio, lower metallicity stars have higher
sur-face rotational values during the Main-Sequence phase (Maeder & Meynet 2001).
1 υ
iniis the initial equatorial velocity andυcritis the initial equatorial
velocity at which the gravitational acceleration is balanced by the cen-trifugal force. It is defined asυcrit =
q
2GM
10
-110
0Temperature (GK)
10
-110
010
1 σv ® / σv ® ref
He-c C-sh
22Ne(α,n)25Mg
ja01 (ref) li12 (this work) nacr cf88
il10 rath ths8
10
-110
0Temperature (GK)
10
-210
-110
0 σv ® / σv ® ref
He-c C-sh
22Ne(α,γ)26Mg
nacr (ref) li12 (this work) cf88
il10 rath ths8
10
-110
0Temperature (GK)
10
-110
010
1 σv ® / σv ® ref
He-c C-sh
17O(α,n)20Ne
nacr (ref)
bg13 (this work) cf88
10
-110
0Temperature (GK)
10
-310
-210
-110
0 σv ® / σv ® ref
He-c C-sh
17O(α,γ)21Ne
cf88 (ref)
[image:4.595.47.558.65.464.2]bg13 (this work) bg13 /10bg11
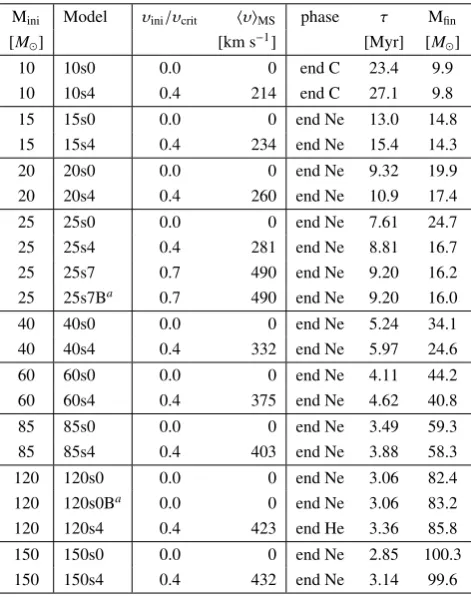
Fig. 1.Comparison between different sources of the important reaction rates for the s-process in massive stars as a function of the temperature.
’ja01’:Jaeger et al.(2001), ’nacr’:Angulo et al.(1999), ’li12’:Longland et al.(2012), ’cf88’:Caughlan & Fowler(1988), ’il10’:Iliadis et al.
(2010), ’rath’:Rauscher & Thielemann(2000), ’ths8’:Cyburt et al.(2010), ’bg11’:Best et al.(2011), ’bg13’:Best et al.(2013). Note that theBest et al.(2011) rate is an experimental lower limit. The shaded bands indicate the approximate ranges of temperature of interest for the s-process in massive stars: the first area named ’He-c’ is associated to the s-process during the core helium burning phase and the second area (’C-sh’) during carbon shell burning.
At the metallicity considered here, F16 computed (with the same stellar evolution code) non-rotating 15, 20 and 25M⊙and
15, 20, 25 and 40M⊙models withυini/υcrit=0.4. These models
were computed again in the present work with the latest ver-sion of the code and with updated nuclear reaction rates (see below, the present section). A comparison of the yields is done in Sect. 3.2. Our models are generally stopped at the end of the neon photo-disintegration phase. Only the 10 M⊙ models
are stopped at the end of C-burning and the rotating 120 M⊙
is stopped at the end of He-burning. Computing the advanced stages is important since the s-process occurs in the C-burning shell (also in the He-burning shell to a smaller extent,The et al. 2007). However, the contribution from He-core burning domi-nates both in non-rotating and rotating models and the C-shell contribution decreases quickly with initial metallicity (F16, es-pecially their Figure 13). Table1shows the initial properties of the models computed in this work as well as the final nuclear phase computed, the total lifetimes, and the final masses.
The nuclear network is fully coupled to the evolution and used throughout all of it. It comprises 737 isotopes, from Hydro-gen to Polonium (Z =84). The size of the network is similar to the network used inThe et al.(2000), F12, and F16, and allows to follow the complete s-process. At the end of evolution, before computing stellar yields, unstable isotopes are decayed to stable ones.
The initial composition of metals (elements heavier than he-lium2) isα-enhanced (we refer to Sect. §2.1 of F16 where more
details are given).
2 The initial helium mass fractionYis calculated according to the
re-lationY=Yp+ ∆Y/∆Z×ZwhereZis the metallicity,Ypthe primordial
helium abundance and∆Y/∆Z =(Y⊙−Yp)/Z⊙the average slope of the
helium-to-metal enrichment law. We setYp =0.248, according to
Cy-burt et al.(2003). We useZ⊙ =0.014 andY⊙ =0.266 as inEkström
Opacity tables are computed with the OPAL tool3. At low
temperature, the opacities fromFerguson et al.(2005) are used to complement the OPAL tables. Radiative mass-loss rates are from Vink et al.(2001) when logTeff ≥ 3.9 and if Mini > 15
M⊙. Otherwise, they are fromde Jager et al.(1988). For rotating
models, the radiative mass-loss rate are corrected with the factor described inMaeder & Meynet(2000). FollowingEkström et al.
(2012), the mass-loss rate is increased by a factor of 3 when the luminosity of any layer in the stellar envelope becomes higher than five times the Eddington luminosity.
The Schwarzschild criterion is used for convection. During the H- and He-burning phases, overshoot is considered: the size of the convective core is extended bydover =αHP whereHPis
the pressure scale height andα=0.1.αwas calibrated so as to reproduce the observed MS width of stars with 1.35 < M <9 M⊙ (Ekström et al. 2012). Rotation is included according to
the shellular theory of rotation (Zahn 1992). The angular mo-mentum is transported according to an advection-diffusion equa-tion (Chaboyer & Zahn 1992)which is fully solved during the Main-Sequence. Only the diffusive part of the equation is solved after the Main-Sequence. For chemicals species, the combination of meridional circulation and horizontal turbu-lence can be described as a pure diffusive process (Chaboyer &Zahn 1992). The associated diffusion coefficient is
Deff = 1 30
|rU(r)|2
Dh
(1) with U(r) the amplitude of the radial component of the meridional velocity (Maeder&Zahn 1998) andDh the
hor-izontal shear diffusion coefficient from Zahn (1992). The equation for the transport of chemical elements is there-fore purely diffusive with a total diffusion coefficientDtot =
D+DeffwhereDis the sum of the various instabilities (con-vection, shear...). After the Main-Sequence, the advective ef-fects are not considered so thatDeff =0.The secular shear dif-fusion coefficient is from Talon & Zahn(1997). It is expressed as
Dshear= fenerg
Hp
gδ
K+Dh
(∇ad− ∇rad)+
ϕ δ∇µ(
K Dh +1)
9π 32Ω
d lnΩ d lnr
!2
.
(2) The efficiency of the shear is calibrated with the fenerg
parame-ter. We set fenerg = 4, which is the value needed for a 15 M⊙
model at solar metallicity and with υini = 300 km s−1 to
ob-tain an enhancement of the surface N abundance by a factor of 3 at core H depletion (a similar calibration is done in e.g.Heger et al. 2000;Chieffi & Limongi 2013). Such an surface enrich-ment agrees qualitatively with observation of 10−20M⊙
rotat-ing stars (e.g.Gies & Lambert 1992;Villamariz & Herrero 2005;
Hunter et al. 2009).
Except for some nuclear rates, we used the same inputs as those used in F16 so that the interested reader can refer to this work for further details. Table2lists the rates important for the s-process that were updated in the present work.
In the stellar evolution code, the rates in their analytical form (Rauscher & Thielemann 2000) are used. The new rates of17O(α, γ) and17O(α,n) fromBest et al.(2013), used in
stel-lar evolution models for the first time, are only tabulated. As a consequence, we derived the analytical form of these rates4. We
3 http://opalopacity.llnl.gov
4 more details here: http://nucastro.org/forum/viewtopic.php?id=22
Table 2.List of the updated reactions important for the s-process. Rates
used in F12 and F16 (column 1), rates used in the present work (column 2).
Reaction F12, F16 This work
12C(α, γ)16O Kunz et al.(2002) Xu et al.(2013) 13C(α,n)16O Angulo et al.(1999) Guo et al.(2012) 14N(α, γ)18F Angulo et al.(1999) Iliadis et al.(2010) 18O(α, γ)22Ne Angulo et al.(1999) Iliadis et al.(2010) 17O(α, γ)21Ne Caughlan & Fowler(1988) Best et al.(2013) 17O(α,n)20Ne Angulo et al.(1999) Best et al.(2013) 22Ne(α, γ)26Mg Angulo et al.(1999) Longland et al.(2012) 22Ne(α,n)25Mg Jaeger et al.(2001) Longland et al.(2012)
checked that the difference between the fit and the tabulated rate was less than 5%. The rates of17O(α, γ),17O(α,n),22Ne(α, γ)
and22Ne(α,n) are still uncertain in the range of temperature of
interest for the s-process in massive stars (e.gBest et al. 2011;
Nishimura et al. 2014). Fig. 1compares the different available rates in the literature for these four reactions. In the range of tem-perature of interest for us (mainly 0.2−0.3 GK, corresponding to the temperature of the helium burning core), the most uncer-tain rate is17O(α, γ). It varies by about 3 dex from the rate of
Caughlan & Fowler(1988) to the rate ofBest et al.(2011) (see the bottom right panel of Fig.1). This motivated us to test the impact of a lower17O(α, γ) rate in some models. We tried a rate
divided by 10 (dotted line in Fig.1) for the fast rotating 25 M⊙
and non-rotating 120M⊙models.
2.2. Yields and production factors
The yields provided contain a contribution from the wind and a contribution from the supernova. The yields from the super-nova depends on the mass cut5 Mcut. Explosive nucleosynthesis,
which is not considered here, will mostly affect the iron-group elements in the innermost layers of the star (Woosley & Weaver 1995; Thielemann et al. 1996; Limongi et al. 2000; Limongi & Chieffi 2003;Nomoto et al. 2006;Heger & Woosley 2010) and is not expected to strongly modify the yields of s-elements (Rauscher et al. 2002;Tur et al. 2009). Our results hence pro-vide good predictions for the yields of light nuclei and s-process nuclei. The yield of an isotopeiis calculated according to the relation
mi= Z Mfin
Mcut
(Xi(Mr)−Xi,0)dMr+ Z τ
0
˙
M(t)(Xi,s(t)−Xi,0)dt, (3)
whereMfinandτare the mass at the end of the evolution and the
total lifetime of the model, respectively (both given in Table1), Xi(Mr) is the mass fraction of isotopeiat coordinateMr, at the
end of the calculation,Xi,0is the initial mass fraction,Xi,s(t) and
˙
M(t) are the surface mass fraction and the mass-loss rate at time trespectively. As a first step,Mcutis estimated using the relation
ofMaeder(1992), that links the mass of the CO-core to the mass of the remnant. Such remnant masses are defined asMrem and
5 At the time of the supernova, the mass cut delimits the part of the star
0 2 4 6 8 10 12 14 16 18 20 22 24
M
r[M
⊙]
10
-1210
-1110
10
-10 -910
-810
-710
-610
-510
-410
-310
-210
10
-1 0Abund. Profile [mass frac.]
25 M⊙ no rot.
Yc=0.95
0
20 40 60 80 100 120 140 160
M
r[M
⊙]
10
-1210
-1110
10
-10 -910
-810
-710
-610
-510
-410
-310
-210
10
-1 0Abund. Profile [mass frac.]
150 M
⊙ no rot.Yc=0.95 1H 4He 12C 13C 14N 16O 22Ne 25Mg 19F Xneut 63Cu 88Sr 138Ba
0 2 4 6 8 10 12 14 16 18 20 22 24
M
r[M
⊙]
10
-1210
-1110
10
-10 -910
-810
-710
-610
-510
-410
-310
-210
10
-1 0Abund. Profile [mass frac.]
25 M⊙ no rot.
Yc=10−3
0
20 40 60 80 100 120 140 160
M
r[M
⊙]
10
-1210
-1110
10
-10 -910
-810
-710
-610
-510
-410
-310
-210
10
-1 0Abund. Profile [mass frac.]
150 M
⊙ no rot. [image:6.595.54.546.56.415.2]Yc=10−3 1H 4He 12C 13C 14N 16O 22Ne 25Mg 19F Xneut 63Cu 88Sr 138Ba
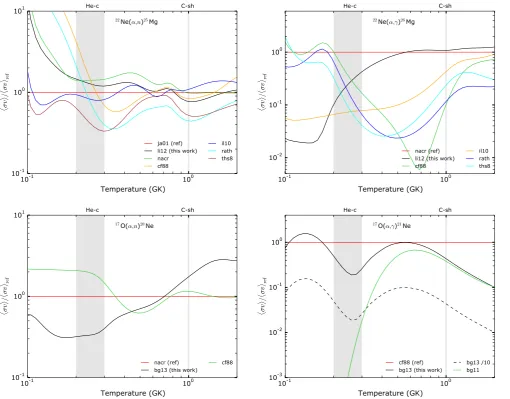
Fig. 2.Abundance profile of the non-rotating 25M⊙(left) and 150M⊙(right) models at the beginning (top panels) and at the end (bottom panels)
of central helium burning phase. Grey areas show the convective zones. The neutron profile is scaled up by a factor of 1018.
are given in the last column of Table 3 for our models6. The
impact of different assumptions on the mass cut, and hence on the remnant mass, are discussed in Sect.4.1.
In addition to the yields, we use in this work the productions factors. For an isotopei, the production factor is defined as
fi=
Mej
Mini
Xi
Xi,0
, (4)
withMejthe total mass ejected by the star,Minithe initial mass
andXi the mass fraction of isotopeiin the ejecta. It expresses
the ratio of what is given back by the star divided by what was present initially in the whole star.
3. Massive stars with rotation and s-process
3.1. Non-rotating models
The central temperature at the beginning of the helium-burning stage (when the central helium mass fractionYc=0.95) is 182,
210 and 220 MK for the 25, 85 and 150M⊙models, respectively.
Above 220 MK, the 22Ne(α,n)25Mg and 22Ne(α, γ)26Ne
reac-tions start to be active and provide the main source of neutrons. 6 InMaeder(1992), the relation between the mass of the CO-core and
the mass of the remnant is applied forMini≤120M⊙. For our 150M⊙
model, we have extrapolated the relation linearly.
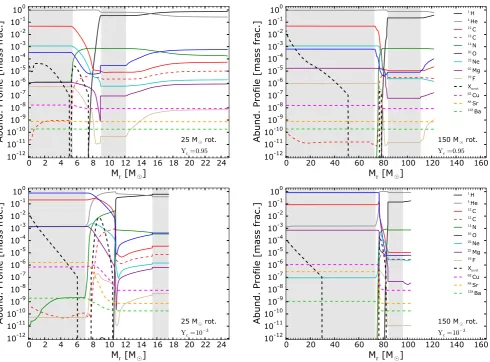
Below 220 MK, the neutrons are provided by other (α,n) reac-tions from elements between C and Ne (especially13C(α,n)16O). The top panels of Fig.2show the neutron profile (black dashed lines) in the 25 and 150M⊙models at the beginning of the core
helium burning phase. The central neutron peak is bigger for the 150M⊙because of the higher central temperature that activates
more efficiently the (α,n) reactions between N and Ne. At this early stage of core He-burning, the s-process is not activated sig-nificantly (see the flat88Sr and138Ba profiles in the top panels of Fig. 2) and leads only to slight overabundances of light s-elements like63Cu (dashed magenta line).
At the end of core helium burning (bottom panels), the tem-perature T > 220 MK in the core so that the main neutron source in the He-burning core is22Ne for both models. Also, in both models and during all the core He-burning phase, the sec-ond neutron peak (at higher mass coordinates) is mainly due to
13C(α,n). The s-process is not efficient in this region (see the 63Cu, 88Sr and 138Ba profiles) because of the high 14N
abun-dance, acting as a strong neutron poison.
In more massive models, the temperature required for the ef-ficient activation of the22Ne(α,n) reaction (220 MK) is reached
earlier during the core helium burning phase: while the 150M⊙
model reaches a central temperatureTc =220 MK at the very
start of core He-burning, the 25M⊙model reaches this
temper-ature only close to the end of He-burning, whenYc ∼0.2. The
duration of the stage where the central temperatureTc>220 MK
0 20 40 60 80 100 120 140 160 Mini [M⊙]
10-4 10-3 10-2
∆
X
(
22 Ne
)
rot.
no rot.
0 20 40 60 80 100 120 140 160
Mini [M⊙] 10-8
10-7 10-6 10-5 10-4 10-3 10-2
Xr
(
22 Ne
)
[image:7.595.48.553.58.248.2]rot. no rot.
Fig. 3.Mass fraction of burnt (left panel) and remaining (right panel)22Ne at the end of core helium burning as a function of initial mass. The blue
line on the left panel shows the sum of the initial mass fraction of CNO isotopes.
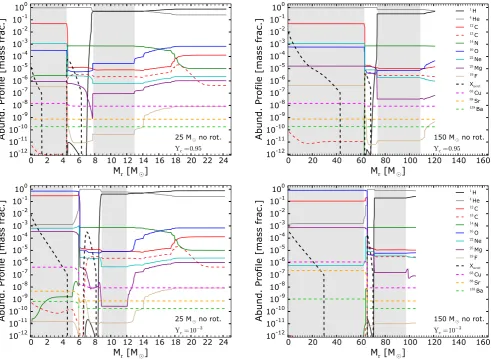
core He-b
25s0
core He-b
85s0
Fig. 4.Kippenhahn diagrams of the non-rotating 25M⊙(left panel) and 85M⊙(right panel) models. The color map shows the mass fraction of
22Ne (the initial22Ne mass fraction is log(X(22Ne))
ini=−5.6). The duration of the core helium burning phase is indicated on the top of the panels.
respectively. The amount of burnt22Ne during core He-burning
therefore increases with initial mass (dashed line in the left panel of Fig. 3). As the initial mass increases, it converges toward a plateau whose value is almost equal to the sum of the initial CNO mass fraction X(CNO)ini (horizontal blue line in the left
panel of Fig. 3). Indeed, during the Main Sequence, the CNO cycle mainly transforms12C and16O into14N. Consequently, at the end of the Main Sequence, X(CNO)ini ≃X(14N) in the core.
When the core helium burning phase starts,14N is transformed
into22Ne by successiveαcaptures. Hence, at core He depletion,
the maximum amount of burnt22Ne is about X(CNO)
ini.
Since more22Ne is burnt in more massive stars, less is left
at core He depletion (e.g. Fig.4and the dashed line in the right panel of Fig.3). For stars withMini>40M⊙, almost all the
avail-able22Ne burns during thecorehelium burning phase so that the
contribution of the C-shell burning in producing s-element isin general negligible. Additional contributions from13C(α,n)7
or 12C(12C,n)23Mg are in principle possible during carbon burning (see Bennett et al. 2012; Pignatari et al. 2013, for
7 starting from 12C(p, γ), with the protons coming from 12C(12C,p)23Na.
mode details) but these contributions generally remain much smaller than the 22Ne contribution during He-burning for
very massive stars.
A higher temperature also favors the production of s-elements because the ratio of the rate of17O(α,n)20Ne over the rate of17O(α, γ)21Ne increases with increasing temperature. It
means that for higher temperatures, the poisoning effect of16O is reduced since neutrons are more efficiently recycled8by17O.
The mean central temperature of the 25 and 150M⊙models
dur-ing He-burndur-ing are 207 and 233 MK respectively. At 233 MK, the ratio (α,n)/(α, γ) is roughly twice that at 207 MK.
Finally, s-elements are also overproduced in more massive stars because these stars have larger He-burning cores. The mass of the He-burning core corresponds roughly to the mass of the CO-core at the end of the evolution, which increases with initial 8 16O is an abundant poison that absorbs neutrons in the
He-core and limits the production of s-elements. With the chain
16O(n, γ)17O(α, γ)21Ne, the neutron captured by16O is definitely lost.
With the chain16O(n, γ)17O(α,n)20Ne, the neutron is captured by16O
[image:7.595.45.553.290.477.2]30
40
50
60
70
80
Atomic number (Z)
10
010
110
210
310
4Production factors
Fe Co
Ni Cu
Zn Ga
GeAsSeBrKr Rb
Sr Y
Zr Nb
Mo Ru
Rh PdAgCd
In Sn
Sb Te
I
XeCsBaLaCePrNd Sm
EuGdTbDyHoErTmYbLuHfTaW
ReOsIr PtAu HgTlPb
10s0
15s0
20s0
25s0
40s0
[image:8.595.72.521.76.321.2]60s0
85s0
120s0
120s0B
150s0
Fig. 5.Production factors (Eq.4) of non-rotating models. The mass cut is set according to the relation ofMaeder(1992).
30
40
50
60
70
80
Atomic number (Z)
10
010
110
210
310
4Production factors
Fe Co
Ni Cu
Zn
GaGeAsSeBrKrRb
SrY ZrNbMo Ru
Rh PdAgCd
In Sn
Sb Te
I XeCs
Ba La
CePr Nd
Sm
EuGdTbDyHoErTmYbLu HfTa
WRe Os
IrPtAu Hg
Tl Pb
10s4
15s4
20s4
25s4
25s7
25s7B
40s4
60s4
85s4
120s4
150s4
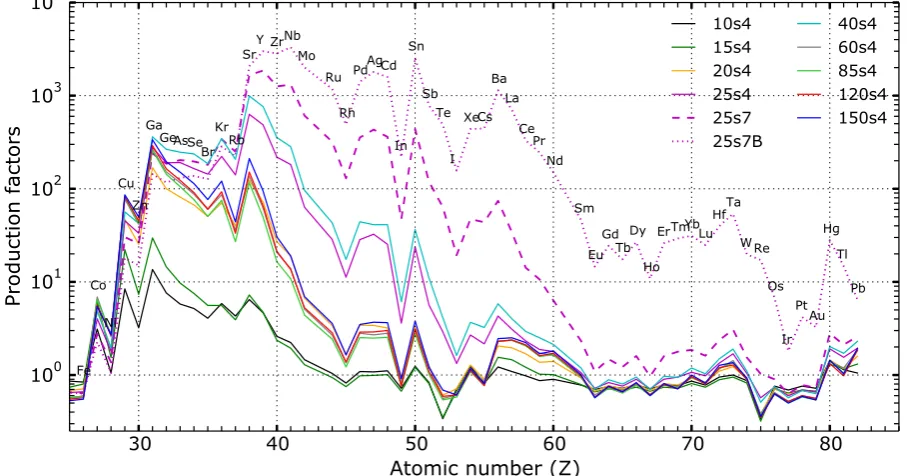
Fig. 6.Same as Fig.5but for rotating models.
mass (column 6 in Table3) and also represents a larger fraction of the final stellar mass.
The effects discussed above lead to an increasing production of s-elements with initial stellar mass (Fig. 5), as was already found before (Langer et al. 1989;Prantzos et al. 1990;Käppeler 1999;The et al. 2007). In our models, the production factors of the s-elements for the 150 M⊙model exceed the factors of the
25M⊙model by about 2 orders of magnitude at maximum (e.g.
for Sr, see Fig. 5). Whatever the mass, the production factors
of elements withZ & 50 stay very small. Considering a lower
17
O(α, γ)21Ne rate mostly affects the range 30.Z.50 (see red dashed line on Fig.5). Even if the production factors of heavy s-elements like Pb do not vary much (a factor of∼ 2) in the considered mass range, the Pb yield in M⊙ (Eq. 3) is about 3
dex higher in the 150M⊙compared to the 10M⊙, because much
[image:8.595.69.523.378.616.2]0
20
40
60
80
100
120
140
160
M
ini[M
⊙]
10
-1310
-1210
-1110
-1010
-910
-810
-710
-610
-510
-410
-310
-2S
te
lla
r
yi
el
ds
[M
⊙
]
no rot.rot.
88Sr ( ×100)
138Ba
[image:9.595.87.513.61.376.2]208Pb (/100)
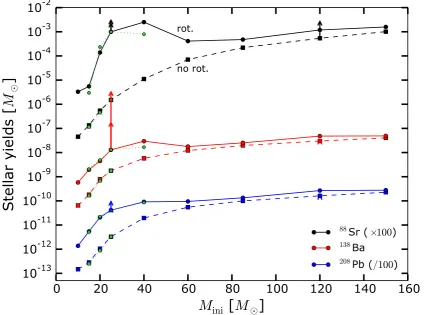
Fig. 7.Stellar yields inM⊙(Eq.3) as a function of the initial massMinifor the non-rotating (dashed lines) and rotating (solid lines) models. The
mass cut is set using the relation ofMaeder(1992).88Sr,138Ba and208Pb isotopes are shown. Green patterns between 15 and 40M
⊙are the yields
of the F16 models. The small and big red arrows atMini=25M⊙indicate the yields of138Ba for the fast rotating 25M⊙model and the fast rotating
25M⊙models with a lower17O(α, γ) rate respectively. The same arrows are plotted for88Sr and208Pb. Arrows atMini=120M⊙represent the 120 M⊙model with a lower17O(α, γ) rate. Note that some arrows are not visible because there are too small.
3.2. Rotating models
The boost on s-elements production due to rotation is the highest between 20 and 60M⊙. Fig.6shows indeed that the production
factors first increase from 10 to 40M⊙and decrease forM>40
M⊙. As shown in Fig.6, the 60, 85, 120, and 150 M⊙ models
with rotation have similar patterns. Fig.7shows that our models agree well with the 15, 20, 25 and 40M⊙of F16 (green pattern).
It means that overall, the new rates used in the present work (c.f. Table2) do not affect much the yields compared to the yields published in F16. Fig.7also shows that rotation affects signifi-cantly the yields only ifMini<60M⊙. For 10<Mini <40M⊙,
the88Sr,138Ba and208Pb yields are boosted by∼2−3,∼1 and
∼ 1 dex, respectively (see Fig.7). There are two main reasons for that:
• First, close to the convective helium burning core, theDshear
coefficient (Eq.2) is generally smaller in more massive mod-els (Fig. 8, red line between the 2 convective zones) and hence transports less efficiently the He-burning products to the H-shell. It ultimately leads to a smaller amount of ex-tra22Ne, hence less neutrons. The smallerD
shearis explained
by the fact that (1) more massive stars have higher K/Dh
ratios just above the convective core (dashed line in Fig.8, this point was already discussed in F16, Sect. 3.1) and (2) Ωand its gradient are smaller in this same region (magenta line). Also, for the 25 M⊙ (left panel of Fig. 8) the Dshear
drops just below the convective H-shell. This is because the
convective H-shell migrates upward and leaves behind an al-most flatΩprofile (atMr ∼10M⊙) which strongly reduces
the Dshear (see also F16, Sect. 3.1). However, the bottom of
the H-envelope extends down to about 9M⊙so that the
He-products reach the H-rich region anyway and extra14N can be synthesized.
• The second reason is that the most massive stars have a more active H-burning shell. The shell remains convective during the whole He-burning stage and contributes well to the to-tal stellar luminosity. This limits the growth of the He-core of the most massive stars. The growth of the convective He-burning core contributes to form extra22Ne by engulfing14N. Since the He-core of the most massive stars does not grow as much as the core of less massive stars, less primary 14N is
engulfed in the He-core, leading to a smaller production of s-elements. A word of caution is here required: the previ-ous statement may be affected by the current uncertainties in convective boundaries and the mixing across it. For exam-ple, using Ledoux criterion instead of Schwarzschild crite-rion may limit the extent and growth of both the convective H-burning shell and He-burning core. These uncertainties can be tackled with multi-dimensional hydrodynamic simu-lations and asteroseismology (e.g.Arnett et al. 2015;Arnett & Moravveji 2017;Cristini et al. 2017).
For these reasons, more extra22Ne is available and burnt in
Mini < 60 M⊙models, as shown by the bump between 20 and
Fig. 8.Ωprofile,Dshearcoefficient and other diffusion coefficients in Eq.2for the rotating 25 (left) and 150M⊙models (right) during the core
He-burning phase (Yc=0.66). Grey areas represent the convective zones and the dashed line show theK/Dhratio.
0 2 4 6 8 10 12 14 16 18 20 22 24
M
r[M
⊙]
10
-1210
-1110
10
-10 -910
-810
-710
-610
-510
-410
-310
-210
10
-1 0Abund. Profile [mass frac.]
25 M⊙ rot.
Yc=0.95
0
20 40 60 80 100 120 140 160
M
r[M
⊙]
10
-1210
-1110
10
-10 -910
-810
-710
-610
-510
-410
-310
-210
10
-1 0Abund. Profile [mass frac.]
150 M
⊙ rot.Yc=0.95 1H 4He 12C 13C 14N 16O 22Ne 25Mg 19F
Xneut 63Cu 88Sr 138Ba
0 2 4 6 8 10 12 14 16 18 20 22 24
M
r[M
⊙]
10
-1210
-1110
10
-10 -910
-810
-710
-610
-510
-410
-310
-210
10
-1 0Abund. Profile [mass frac.]
25 M⊙ rot.
Yc=10−3
0
20 40 60 80 100 120 140 160
M
r[M
⊙]
10
-1210
-1110
10
-10 -910
-810
-710
-610
-510
-410
-310
-210
10
-1 0Abund. Profile [mass frac.]
150 M
⊙ rot.Yc=10−3 1H 4He 12C 13C 14N 16O 22Ne 25Mg 19F
[image:10.595.56.547.269.631.2]Xneut 63Cu 88Sr 138Ba
Fig. 9.Abundance profile of the rotating 25M⊙(left) and 150M⊙(right) models at the beginning (top panels) and at the end (bottom panels) of
central helium burning phase. Grey areas show the convective zones. The neutron profile is scaled up by a factor of 1018.
Fig.9 show the abundance profiles at the end of the core He-burning phase for the rotating 25 M⊙(left) and 150 M⊙(right)
models. We see indeed that less primary14N is synthesized in
the 150 M⊙model (compare the14N bumps at Mr ∼ 9 and 80
M⊙for the 25 and 150M⊙models respectively).
19
F is also an important product of rotation, which is syn-thesized after the core He-burning phase, in the He-burning
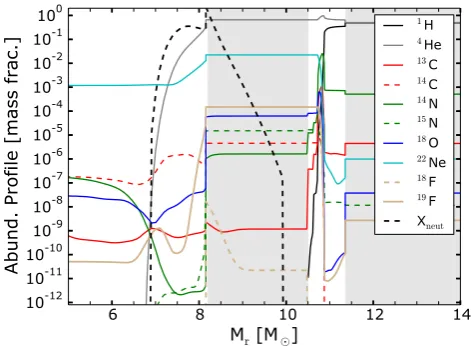
shell. Fig.10shows the convective He-burning shell (between
∼ 8 and ∼ 10.5 M⊙) of the rotating 25 M⊙ model. The
abundance of 19F is about 10−4 in the He-shell (t is only
about 10−7 in the non-rotating 25M⊙model).19F comes from
the 14N(α, γ)18F(β+)18O(p, α)15N(α, γ)19F chain (Goriely et al. 1989). The protons mainly come from the 14N(n,p)14C
by (α,n) reactions, especially13C(α,n) and 22Ne(α,n). Fig.10
shows the abundances of the species involved in the synthesis of 19F. The additional 13C,14N and22Ne synthesized in
rotat-ing models largely contributes to boost the sequence described above and consequently the19F production.
In general, rotating models lose more mass during their evo-lution. It occurs mainly because of three reasons:
• rotation increases the mass losses by line driven winds,
• rotation changes the distribution of the chemical species in the stellar interior. It can modify the tracks in the HR diagram and therefore the mass loss experienced by the star,
• rotation can also induce mechanical mass losses when the stellar surface reaches the critical velocity.
The surface of the 25, 40 and 60M⊙models reach the critical
ve-locity at the end of the Main-Sequence so that mechanical mass-loss occurs. The mass lost due to that effect remains modest (less than 0.1 M⊙). For the models of this work, the most important
effect comes from the second reason mentioned above. After the Main-Sequence, rotating models have higher luminosities than non-rotating models (Fig. 11). This is due to internal mixing, that tends to produce larger helium burning cores. The higher lu-minosity (1) increases directly the mass-loss rate and (2) makes the model more likely to enter the supra-Eddington regime. In this regime, additional mass loss occurs (c.f. Sect.2.1). The ro-tating 25M⊙model becomes supra-Eddington close to the end
of the core helium burning stage while its non-rotating coun-terpart never enters this regime. In the end, the rotating 25 M⊙
model loses 8 more solar masses compared to the non-rotating model (Table1, last column). Quickly after core He ignition, the rotating 60 M⊙ model reaches logTeff ∼ 3.8 and experiences a supra-Eddington stage that removes∼8 M⊙. The stellar
sur-face in then enriched in helium and makes the star going back to the blue (Fig.11). The non-rotating 60M⊙enters the
supra-Eddington regime only at the very end of core He-burning. Its surface is not much enriched in helium so that it stays red.
6
8
10
12
14
M
r[M
⊙]
10
-1210
-1110
10
-10 -910
-810
-710
-610
-510
-410
-310
-210
10
-10Abund. Profile [mass frac.]
[image:11.595.311.554.58.248.2]1
H
4He
13C
14C
14N
15N
18O
22Ne
18F
19F
X
neutFig. 10.Abundance profile of the rotating 25M⊙during the shell
He-burning phase. Grey areas show the convective zones (the convective He-burning shell is in between∼8 and∼10.5M⊙). The neutron profile
is scaled up by a factor of 1018.
3.6 3.8 4.0 4.2 4.4 4.6 4.8
log(Teff[K]) 3.5
4.0 4.5 5.0 5.5 6.0 6.5 7.0
log(
L/
L⊙
)
[image:11.595.46.282.519.692.2]10 15 20 25 40 60 85 120 150
Fig. 11. Tracks of the models in the Hertzsprung-Russell diagram.
Dashed and solid lines show non-rotating and rotating models respec-tively. Circles and squares denote the endpoint of the evolution for the non-rotating and rotating models, respectively.
3.3. Integrated production factors
The integrated production factor fi,intfor an isotopeiis
fi,int=
RMmax
Mmin fi(Mini)φ(Mini) dMini
RMmax
Mmin φ(Mini) dMini
(5)
whereMmin =10M⊙,Mmax=150M⊙, andφ(Mini) is the initial
mass function. Here we take the initial mass function ofChabrier
(2003) defined asφ(Mini) =AMini−αwithA =7.1 10−5andα=
2.3. The fi,int factors were computed for the non-rotating and
rotating (40 % of critical velocity) models. (black and red lines in Fig.12).
Because of the low weight associated with very massive stars (c.f. Eq.5), the contribution of such stars to the integrated pattern is small. The final pattern resembles the one of a∼20M⊙model.
The green line shows the ratio between the 2 factors. Strong differences occur between 30 < Z < 50, especially around Z = 38 (strontium). Also of interest is the fluorine, which is overproduced by more than 2 dex by the rotating population (c.f. Sect.3.2).
3.4. Faster rotation
Increasing the initial rotation rate from 40% to 70% of the crit-ical velocity for the 25 M⊙ model allows the production of
s-elements up toZ∼60 (dashed purple line in Fig.6). Compared to the 25 M⊙model with slower rotation, Sr and Ba are
10
20
30
40
50
60
70
80
Atomic number (Z)
10
010
110
210
3Integrated production factors
C NO
F
Ne Na
Mg Al
Si P
S Cl
ArKCa Sc
TiVCrMnFe Co
Ni Cu
Zn Ga
GeAsSeBrKr Rb
Sr Y
ZrNb
Mo Ru
Rh PdAgCd
In Sn
Sb TeI
Xe
CsBaLaCePrNd SmEuGdTbDyHoErTmYbLuHfTaW
Re
OsIrPtAuHgTlPb
no rot.
rot. (
υini/υcrit=40%)
[image:12.595.72.527.79.320.2]rot./no rot.
Fig. 12.Integrated production factorsfi,int(Eq.5) for the population of non-rotating and rotating models. The mass function ofChabrier(2003) is
used. The green line shows the ratio between the 2 curves. The mass cut is set using the relation ofMaeder(1992). The grey area highlights the elements that are likely affected by explosive nucleosynthesis.
3.5. Lower17O(α, γ) rate
When the 17O(α, γ) rate is reduced in the fast rotating 25 M⊙
model, the source over seed ratio is also increased since more neutrons are recycled. This allows the production of even more massive elements, up to Pb (dotted line in Fig. 6). The largest difference between the two fast rotating models with different reaction rates occurs for Z > 55. In particular, Ba and Hg are overproduced by more than 1 dex. Reducing the rate of17O(α, γ)
in the non-rotating 120M⊙model boosts the production of light
s-elements by∼0.5 dex but does not allow the significant pro-duction of elements heavier thanZ ∼ 50. A better knowledge of the17O(α, γ) rate is crucial to better constrain the production
of the s-elements, especially from the second peak, which are largely affected when changing this nuclear rate.
4. Effect of the mass cut and yield tables
4.1. Effect of the mass cut
In the previous section, we discussed the yields assuming a spe-cific mass cut (followingMaeder 1992). However, how massive stars explode is still poorly constrained, and even less if rotation is included. It is generally difficult to strongly state which part of the star is expelled and contributes to the chemical enrichment of the interstellar medium (ISM). In what follows, we discuss the effect of varying the mass cut. In the yield tables provided with this work, the mass cut is let as a free parameter.
Figures13and14show the dependence of the yields on the mass cut for the 25 and 150 M⊙ models. They show how
ele-ments are produced (positive yield, red color) or destroyed (neg-ative yield, blue color) when varying the mass cut between the fi-nal massMfinand the remnant massMremof the model. The gaps
atZ =43 and 61 in every panel correspond to the elements Tc and Pm, which have no stable isotope and are consequently
nei-ther produced nor destroyed in the final yields. Considering the fast rotating 25M⊙model with lower17O(α, γ) (Fig.13, bottom
right panel), we see that a mass cut below∼10.5M⊙is needed
to expel s-elements with 27 < Z < 60 and a mass cut below
∼7.5M⊙(corresponding to the bottom of the He-burning shell)
to expel s-elements withZ > 60. Interestingly, elements with 60<Z <70 (among them Eu) are exclusively produced in the inner regions of the two fast rotating 25M⊙models (bottom
pan-els of Fig.13). Also, out of these two models, only the one with a lower17O(α, γ) is able to produce elements with 75<Z<80.
Models including rotation generally lose more mass during their evolution (c.f. Sect. 3.2) and have larger helium cores so that s-elements are located closer to the stellar surface at the end of the evolution. A large mass cut (i.e. close to the surface) will then already eject some s-elements in the case of the rotating models. Without rotation, s-elements are located deeper inside the star so that a smaller mass cut (i.e. deeper inside the star) is required to eject these elements. As an example,Mcut =70M⊙
will eject some s-elements for the rotating 150M⊙model while
it will not for the non-rotating 150M⊙model (Fig.14). Ejecting
deeper layers likely requires a more powerful explosion. Conse-quently, rotation in massive stars not only boosts the production of s-elements but might also make it easier to expel these ele-ments. This could be viewed as a possible indirect effect of the rotation on providing more s-elements to the ISM.
4.2. Yield tables
Electronic tables of yields are available on the web9. In these tables, the mass cut Mcut is varied between the final mass of
the considered stellar model and the remnant mass Mrem from Maeder(1992). 100 values ofMcutare considered for each
mod-els, equally spaced between Mrem and Mfin. The entire table
Fig. 13. Yields of elements (characterized here by the atomic number Z) for different values of the mass cut. The color map shows the yields for the non-rotating 25M⊙(top left panel), rotating 25M⊙(top right), fast rotating 25M⊙(bottom left) and fast rotating 25M⊙with lower17O(α, γ)
(bottom right). The ticks labelledMremshow the location of the remnant mass using the relation ofMaeder(1992) (last column of Table3). ’CO’
and ’He’ denote the location of the top of the CO and He core respectively (fifth and sixth columns of Table3).
[image:13.595.43.553.535.739.2]Table 3.model label (column 1), initial mass (column 2), final mass (column 3), mass ejected through winds (column 4), mass of the H-free region (mass coordinate where the mass fraction of hydrogen X(1H)
drops below 0.01, column 5), mass of the CO core (mass coordinate where the4He mass fractionX(4He) drops below 0.01, column 6),
rem-nant massMremusing the relation ofMaeder(1992, column 7).
Model Mini Mfin Mej,wind MHe MCO Mrem
[M⊙] [M⊙] [M⊙] [M⊙] [M⊙] [M⊙]
10s0 10 9.93 0.07 2.91 1.58 1.28
10s4 10 9.78 0.22 3.35 1.86 1.36
15s0 15 14.78 0.22 4.67 2.62 1.56
15s4 15 14.34 0.66 5.74 3.36 1.75
20s0 20 19.87 0.13 6.46 4.04 1.92
20s4 20 17.36 2.64 8.21 5.31 2.24
25s0 25 24.68 0.32 8.65 5.88 2.39
25s4 25 16.68 8.32 10.85 7.53 2.80
25s7 25 16.21 8.79 10.91 7.56 2.81
25s7Ba 25 16.01 8.99 10.96 7.62 2.82
40s0 40 34.10 5.90 15.29 11.75 3.80
40s4 40 24.60 15.40 19.10 14.66 4.54
60s0 60 44.17 15.83 25.36 20.94 6.44
60s4 60 40.81 19.19 30.77 25.35 7.77
85s0 85 59.33 25.67 37.86 32.86 9.90
85s4 85 58.27 26.73 45.57 39.30 11.73
120s0 120 82.45 37.55 54.30 50.01 14.69
120s0Ba 120 83.18 36.82 54.46 49.35 14.51
120s4 120 85.81 34.19 65.28 61.78 17.95
150s0 150 100.26 49.74 70.77 65.34 18.94
150s4 150 99.59 50.41 83.83 80.04 23.04
aModels computed with the rate of17O(α, γ) divided by 10.
therefore contains 21 stellar models times 100 Mcut that means
2100 different ejecta compositions. A part of the yield table for the rotating 25 M⊙is shown in Table4. The first value of Mcut
(column 2) is equal to the final mass of the model Mfin (given
in Table3). It corresponds to the case where only the mass loss through stellar wind is taken into account (also given in Table3). In all the other cases, the yield of an isotope is the sum of the yields in the wind plus the yields in the material ejected by a supernova of the indicated mass cut. The last value ofMcut(last
column in Table4) corresponds to the case where all the mate-rial above Mcut =Mremis ejected (also the stellar wind is taken
into account). Yields below 10−15M
⊙in absolute value are set to
zero. Fig.13and14are graphic representations of such tables.
5. Summary and discussions
We computed a grid of 21 models with and without rotation, at Z =10−3
and with initial masses between 10 and 150M⊙.
Ro-tating models were computed with an initial rotation of 40 % of the critical velocity. One model was computed with 70 % of the critical velocity and 2 models with the rate of17O(α, γ) divided
by 10. With this paper, we provide tables of yields including the effect of varying the mass cut.
The main result of this work is that rotation has the strongest impact on s-element production for 20 < Mini < 60 M⊙. The
first s-process peak is the most affected by rotation. In the 25M⊙
rotating model, the yield of88Sr is increased by∼3 dex (Fig.7). Although to a smaller extent, the second and third peak are also affected:138Ba and208Pb are overproduced by∼ 1 dex. Faster rotation boosts even more the s-element production in the range 40<Z <60. Taking a reasonably lower17O(α, γ) reaction rate
in the fast rotating model overproduces the s-elements withZ> 55 (among them Pb) by about 1 dex compared to the standard fast rotating model.
5.1. Initial rotation of the models
The boost of the s-process element production in massive stars is obtained here through rotational mixing. The importance of the boost depends among other parameters on the initial angu-lar momentum content of the star, here determined by the choice of the surface rotation velocity on the ZAMS where the star is supposed to rotate as a solid body. The present results have been obtained only for one initial rotation for each initial mass and of course, to obtain a broader view of the impact of rotation, families of models with different initial rotation rates should be computed for each initial masses. Here, to limit the computa-tional time (that is significant when following the changes in the abundances of such a large number of isotopes), we focused on a particular choice (40% the critical velocity at the ZAMS). We adopted this value for the following reasons: first, at solar metal-licity, this choice is consistent with the peak of the velocity distri-bution of young main-sequence B-type stars (c.f. Sect.2.1). Sec-ond, we wanted to use the same initial rotations than those used in F12 and F16 in order to check how some changes brought to the code since these computations may have affected the results. Since there are no observational constraints about the velocity distributions at the metallicity considered here, it is difficult to know whether such a choice is representative or not. At the mo-ment, in absence of such confirmation, we can see the present computations as an exploration on how the boost of the s-process due to rotation varies as a function of the initial masses over a large range of initial masses. The reader has to keep in mind that the absolute values of the yields depends here on the choice of the initial rotation.
5.2. Model uncertainties
One has also to keep in mind that the yields of stellar models are affected by several sources of uncertainty. By changing the rate of 17O(α, γ), we provided an example on how current nuclear
rate uncertainties can affect the yields. The three other key reac-tions for s-process in massive stars (shown in Fig.1), that are still not completely constrained, add another source of uncertainty in the yields. Uncertainties on neutron-captures andβ-decay rates also affect the s-process yields by a factor of 2 at maximum, in general (Nishimura et al. 2017,2018).
Table 4.Yields inM⊙(Eq.3) of the rotating 25M⊙model. Only a part of the table is shown. The full table (including all models, mass cuts and
isotopes) is available with the online version of the paper. Each column corresponds to a given mass cut inM⊙. The first mass cut (16.68M⊙)
corresponds to the final mass of the model. In that case, the yields are only from stellar winds. The last mass cut corresponds toMrem(c.f. Table3).
In between these two extreme values, 100 equally spacedMcutare taken.
16.68 16.54 16.40 16.26 ... ... 3.22 3.08 2.94 2.80
1H −7.113(−01) −7.113(−01) −7.113(−01) −8.189(−01) ... ... −8.018(+00) −8.123(+00) −8.228(+00) −8.333(+00) 2H −1.209(−04) −1.209(−04) −1.209(−04) −1.270(−04) ... ... −3.166(−04) −3.187(−04) −3.207(−04) −3.227(−04)
3He −2.434(−04) −2.434(−04) −2.434(−04) −2.587(−04) ... ... −7.742(−04) −7.800(−04) −7.858(−04) −7.916(−04)
... ... ... ... ... ... ... ... ... ... ...
... ... ... ... ... ... ... ... ... ... ...
207Pb 0 0 0 0 ... ... +1.124(−09) +1.149(−09) +1.173(−09) +1.198(−09)
208Pb 0 0 0 0 ... ... +3.922(−09) +4.024(−09) +4.125(−09) +4.226(−09)
209Bi 0 0 0 0 ... ... +1.384(−10) +1.423(−10) +1.462(−10) +1.502(−10)
Maeder et al. 2013) that govern the transport of chemical ele-ments (seeMeynet et al. 2013, for a review). Different combi-nations of these coefficients will lead to a higher/smaller pro-duction of extra22Ne, hence a possibly different production of
s-elements. Such uncertainties might be at the origin of the dif-ferences between this work and the recent work ofPrantzos et al.
(2018). They used a chemical evolution model to discuss the abundance evolution of elements up to uranium in the Milky Way. They included yields of rotating massive stars from Chieffi & Limongi. Elements from Ba to Pb are generally overproduced compared to our models. Since these stellar models are not pub-lished yet, we do not know the detailed physics ingredients and cannot do extensive comparisons.
5.3. Fluorine and s-elements
From discussions in Sect.3.3and Fig.12, we note that the pro-duction of s-element in massive rotating stars should be corre-lated with the production of several light elements, particularly fluorine. This correlation might be found in the next generation of low mass halo field stars. Importantly, AGB stars are also believed to contribute to the production of both fluorine and s-elements (e.g. Jorissen et al. 1992; Lugaro et al. 2004, 2008;
Abia et al. 2010; Karakas 2010; Bisterzo et al. 2010; Gallino et al. 2010), leaving open the possibility for AGB and massive stars to be responsible for such abundance patterns. In addition to AGB and massive rotators, theν-process in core-collapse su-pernovae is also generally expected to contribute to fluorine pro-duction (Woosley 1977; Woosley et al. 1990; Kobayashi et al. 2011;Izutani et al. 2012). Recent studies suggest however that both theν-process in supernovae (Jönsson et al. 2017) and AGB stars (Abia et al. 2015) might be insufficient to explain the ob-served evolution of fluorine in the solar neighborhood. This po-tentially makes rotating massive stars interesting complemen-tary fluorine sources that might improve the agreement between galactic chemical evolution models and observations (Meynet & Arnould 2000;Palacios et al. 2005).
Around the metallicity considered in this work ([Fe/H] ∼ −2), the few iron-poor halo field stars whose fluorine abundance was determined are generally F-rich (Otsuka et al. 2008; Lu-catello et al. 2011;Li et al. 2013;Schuler et al. 2007). One star (HD5223) with [Fe/H]∼ −2 has both fluorine and heavy ele-ment abundances available. It is enriched in F, Sr, Ba and Pb (Goswami et al. 2006;Lucatello et al. 2011) and shows radial ve-locity variations (McClure & Woodsworth 1990).The enhance-ment in Pb may not be reproduced by the massive stellar
models of the present work.A mass transfer episode from an AGB stars companion may be the main process for ex-plaining the abundances of HD5223.Further determinations of fluorine and s-elements abundances in metal-poor stars should help testing stellar model predictions.
5.4. Rotation from solar to very low metallicity
As a final note, we would like to emphasize here that the impact of rotation on the evolution of stars (in particular on the stellar yields) allows to unify in a same theoretical framework the prop-erties of stars observed, for instance, in the solar neighbourhood to the properties of stars and their impact on nucleosynthesis at very low metallicities (see e.g. Maeder et al. 2015; Chiappini 2013).
Let us first recall that rotational mixing has been first in-cluded in stellar models to account for surface enrichments ob-served at the surface of main-sequence B-type stars in the solar neighbourhood (see e.g.Maeder & Meynet 2012, and references therein). In general, rotating models need to be calibrated in order to constrain the efficiency of rotation-induced mix-ing (c.f. Sect. 2.1). In the present work, the value of fenerg
(Eq.2) is chosen in order for solar metallicity models with initial masses around 15M⊙to fit the the averaged observed
chemical enrichments of Galactic B-type stars rotating with an average surface velocity. Although the calibration can be done using different observations (Brott et al. 2011, for in-stance, used a sample of B-type stars in the Large Magellanic Cloud), at very low metallicities, there are no observation al-lowing to check whether a different value of fenergwould be
needed. At the moment the most reasonable choice is to keep this quantity constant.Once the calibration is done, the physics describing the transport processes of both chemical elements and angular momentum due to rotation is not changed. As a conse-quence, the results of the stellar models for other initial masses and metallicities can be seen as stellar models predictions. Inter-estingly, when this physics is usedfor low metallicityrotating stars of both intermediate and high masses, the rotational mixing produces,without any artificial tuning, primary nitrogen produc-tion (Meynet & Maeder 2002a). Rotating massive star models have been invoked to explain the N/O plateau shown by metal-poor halo stars, the C/O upturn (Chiappini et al. 2006) and pro-vided predictions concerning the12C/13C ratio (Chiappini et al. 2008).