White Rose Research Online URL for this paper: http://eprints.whiterose.ac.uk/143284/
Version: Accepted Version
Article:
Jiang, L, Masullo, M, Maffei, L et al. (2 more authors) (2018) A demonstrator tool of web-based virtual reality for participatory evaluation of urban sound environment. Landscape and Urban Planning, 170. pp. 276-282. ISSN 0169-2046
https://doi.org/10.1016/j.landurbplan.2017.09.007
© 2017 Elsevier B.V. Licensed under the Creative Commons
Attribution-NonCommercial-NoDerivatives 4.0 International License (http://creativecommons.org/licenses/by-nc-nd/4.0/).
[email protected] https://eprints.whiterose.ac.uk/
Reuse
This article is distributed under the terms of the Creative Commons Attribution-NonCommercial-NoDerivs (CC BY-NC-ND) licence. This licence only allows you to download this work and share it with others as long as you credit the authors, but you can’t change the article in any way or use it commercially. More
information and the full terms of the licence here: https://creativecommons.org/licenses/
Takedown
If you consider content in White Rose Research Online to be in breach of UK law, please notify us by
Abstract
Using virtual reality (VR) for environmental evaluation is one of the innovations in planning
process to support the involvement of local population in decision making. The power of VR
in public participation is further enhanced by its application online. However, current online
VR applications for public participation is mostly restricted as visualisation tools. Evaluation
of the virtual sound environment is rarely supported. This study developed a demonstrator
tool of web-based online VR for participatory evaluation of urban sound environment. Piazza
Vittoria in Naples, Italy was used as the case site to create the virtual environment. The tool
employed affordable visualisation and auralisation for the general public to use online in
mainstream web browsers with their own devices. The tool was tested online and the results
were analysed to discuss the applicability, potential and challenges of online VR for
participatory evaluation of urban sound environment.
1. Introduction
Virtual reality (VR) has been intensively investigated and employed as a technology to
present proposed urban development in intuitive and interactive ways. It allows policy
makers and local communities, as well as urban planners themselves, to experience and to
better understand the changes in the concerned environment before the development takes
place, and thus to enable information sharing and consensus building throughout the planning
process (Axford et al., 2007; Engel & Döllner, 2012). With the rapid development in
information and communication technologies in recent years, the power of VR in public
participation is further enhanced by its application online. The online approach can make VR
participation more accessible by making information and participation sessions available at
any time and from any locations with internet access, and encourage expression of opinions
by providing a non-confrontational atmosphere (Bulmer, 2001). Examples of online VR for
public participation can be found in Knapp & Coors (2008), Smith et al. (2012), Weber et al.
(2009), Zhang & Moore (2014), etc. These studies show that online VR has opened up new
forms of communication, interaction and collaboration for participatory decision-making in
urban planning.
However, nearly all the current online VR applications for public participation are developed
as visualisation tools to involve the public in decisions solely on the visual environment, or
only provide audio stimuli as add-on effects lacking authentic references to the virtual scenes.
Action plans are required in European cities to address noise issues and to reserve quiet areas
(European Parliament and Council, 2002). Recently, strategies are being extended from noise
control to design of sound environment, with acoustic interventions to be made throughout
the planning process (Alves et al, 2015). Online VR tools that promote participatory
evaluation of urban sound environment will be highly beneficial for this initiative of urban
sound planning.
On the other hand, potential of offline VR for participatory evaluation of sound environment
has been widely studied (Stienen&Vorländer, 2015). VR has shown advantage in scenario
control for comparative presentations of ante-operam, post-operam (Ruotolo et al., 2013) and
alternative scenarios (Bastürk et al., 2011; Echevarria Sanchez et al., 2017; Maffei et al.,
2013a, 2013b), and advantage in ecological validity for multisensory evaluation of urban
sound, visual and global environments that highly congruent evaluation results in VR and
on-site can be achieved (Maffei et al., 2015).
Several factors might have discouraged attempts on online VR for participatory evaluation of
urban sound environment. Firstly, computational load of real-time rendering of spatialised
sound for complex urban environment can be prohibitively high (Maffei, 2012; Stienen &
Vorländer, 2015), and this issue can be more intractable in cases of online applications.
Secondly, databases of sound sources and boundary conditions for auralisation of outdoor
environment are not yet available in standardised formats. Thirdly, sufficient control over
online participants’ audio hardware and playback settings can be hard to achieve (Pedersen et
al. 2012). Last but not least, urban sound planning approaches do not yet have a significant
impact on the planning discipline, and interests in promoting public participation in related
processes are still relatively low (Easteal et al., 2014).
As an initiative attempt, this study developed a demonstrator tool of web-based online VR for
participatory evaluation of urban sound environment, and tested the tool online to explore the
applicability, potential and challenges of such tools.
2. Methods
2.1 Design concepts
For evaluation of large urban environment, the demonstrator tool should allow free
a fundamental requirement of the tool was that the computational load should be low enough
to run on general home computers. It was thus necessary to consider less demanding
rendering processes and simplify the content of the virtual environment as much as possible
within acceptable quality limits. Headphones, instead of dedicated or built-in speakers, were
suggested for audio playback. For one reason, with the use of headphones it would be easier
to control how the spatialised sound would be played by each individual participant; for the
other, headphones are widely available and commonly used at home or work (Lindquist,
2014). The tool was also conceived to be web-based. The web-based solution would further
constrain VR complexity due to limits in browsers’ memory space. However, it would be
easier for potential participants to use without the hassles of downloading and/or installing
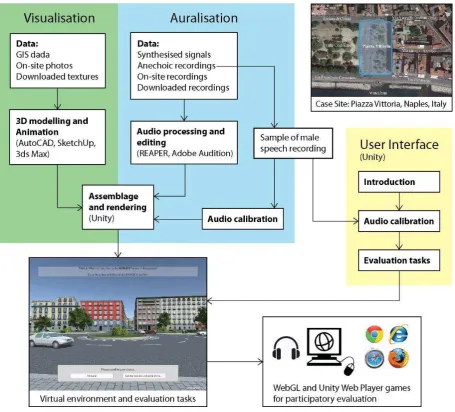
any applications, and thus to promote participation. Following these concepts, Figure 1 shows
the workflow of the tool development, which is detailed in the following sections.
2.2. Visualisation
Piazza Vittoria (40°49 56.53 N; 14°14 28.37 E), an urban square in Naples, Italy, was
chosen as the case site for the demonstrator tool. The square is about 70 m × 150 m in size
and is adjacent to the seafront. It serves as a popular gathering place for locals and tourists,
but also as an important node of the city road network.
With GIS data of the site obtained from www.archweb.it and photos taken during on-site
surveys, 3D models of objects for the virtual environment were created using AutoCAD 2012,
SketchUp 8 and 3ds Max 2012, and finally assembled and rendered in Unity 5.3. Modelled
objects included buildings, roads, pavements, street furniture, fountains (3D Warehouse,
2016a, 2016b), vegetation (partly from Unity Asset Store, 2016), vehicles and people (3D
Warehouse, 2016c). Buildings were geo-specifically textured using edited building facade
photos taken on site, while other elements were textured using images from existing texture
database. Vehicles were animated for two traffic scenarios: a scenario of an approximation of
on-site observations and a scenario that removed current traffic restrictions. Figure 2
illustrates the traffic flows and volumes in these two scenarios. Vehicle speeds varied from
20 km/h to 50 km/h depending on road segments and were reduced at turnings. Table 1 lists
the detailed parameters of the animation. Only passenger cars were used due to difficulties in
Some measures were taken to ensure smooth running of the demonstrator tool. High
resolution textures were avoided and animations were compressed to reduce the sizes of
Unity files, and thus to keep reasonably short loading time of the tool and low memory usage
inside web browsers. Diffuse shader, a relatively computationally cheap Unity built-in shader,
was used for graphical rendering, since GPU of participants’ devices would vary and some
may not be able to perform more advanced graphical renderings.
2.3. Auralisation
Sound elements added to the virtual environment included vehicle sound, bird sound,
fountain sound, sea wave sound, human voice, and background urban sound. The following
sections describe how these sounds were produced, rendered and calibrated.
2.3.1. Synthesis of car source signals
Vehicle sound in this demonstrator tool consisted of tire noise and propulsion noise. Due to
the difficulty in acquiring the sound at source by recording, synthesised sound was used.
The synthesis was a simplified version of the emission model of the auralisation model of
accelerating passenger cars presented in Pieren et al. (2016). For this demonstrator tool, only
one single car type (specific tire and engine) was synthesized and no individualisation was
made. For tire noise, the pink noise was generated in ITA-Toolbox (Berzborn et al., 2017).
Road surface correction and directivity were not taken into consideration. For the tonal
component of the propulsion noise, constant product of gear and axle ratios and constant
engine order sound pressure levels were used. The product of gear and axle ratios was 15,
assuming all cars were in the second gear for speeds ≤ 50 km/h. Values for engine order
levels were extracted from Fig. 13(b) in Pieren et al. (2016) measured at full load and 3000
rpm, which was a compromised choice concerning data availability and suitability. For a
more realistic simulation for this study, measurements at medium loads and lower rpms
would be more appropriate. Only up to order 10 was simulated due to too many
high-frequency parts for the synthesised propulsion noise found with higher orders. For the noise
component of the propulsion noise, the model for tire noise was used but with data from
Table II in Jonasson (2007), due to lack of data for this part of synthesis in Pieren et al.
(2016). However, it should be noted that the data from Jonasson (2007) were for the total
subjectively determined reduction was made to balance the level ratios of the tonal and noise
components.
Synthesisers for the tire noise signals and the propulsion noise signals were implemented in
MATLAB 2016a. These signals were pre-rendered. The obtained tire noise signals and
propulsion noise signals were then added to produce source signals of individual cars. 14
source signals were produced, corresponding to the 14 paths used in traffic animation (Table
1). Cars on the same path used the identical source signal for the path. Fade-in and fade-out
effects were applied to each signal.
2.3.2. Recordings of other sounds
Other sounds, including human voice, bird sound, fountain sound, sea wave sound and
background urban sound, were produced based on recordings.
For human voice, samples of chats in Italian involving 2 to 5 people were recorded using a
Zoom H6 recorder and a Soundfield SPS200 microphone in an anechoic chamber. For
background urban sound, samples varying in levels of traffic noise were recorded using the
same equipment at locations around Piazza Vittoria. Samples of bird sound, fountain sound
and sea wave sound were obtained online in WAV format from Freesound.org (2016a, 2016b,
2016c).
Because sound clips in Unity need to be mono for sound positioning, only a single channel of
each of the acquired multi-channel recording samples were used. The extracted samples were
clipped and edited to reduce sizes, remove interruptive noise, and allow seamless loop.
2.3.3. Spatial rendering of sounds
All the sound files were imported into Unity and attached to corresponding objects. The
attached sounds were spatially rendered in real time by Unity’s built-in sound engine.
Vehicle sound, human voice, bird sound and fountain sound were treated as point-source
sounds, and sound attenuations were applied with a logarithmic volume-distance rolloff,
corresponding to a 1/r sound pressure dependence of a point source in free field. Sea wave
sound and background urban sound should be treated as area- or quasi-area-source sounds,
linear volume-distance rolloff for their attenuations, with proper positioning of the sound
objects, to simulate the more ambient yet still directional sound emissions.
Spatialisation was applied simply by Unity’s built-in panning, which took the source and
regulated the gains of the left and right ear contributions based on the distance and angle
between the source and the receiver. This provided simple directional cues on the horizontal
plane. With the Unity Audio Spatializer SDK (5.2 feature), it was possible to implement
HRTF filtering based on publicly available data sets such as KEMAR. However, the
rendering was not smooth for a large number of fast moving objects.
Doppler effect was applied using the default setting in Unity, which changed the pitch of the
sound according to the relative speed of the source and the receiver. Sound reflection was not
considered for this open square case site, since it was not supported by the Unity sound
engine and would dramatically increase computational load even if achieved by third party
audio extensions.
2.3.4. Adjustment of sound levels
Emission levels of car sounds, i.e., the levels of car source signals, were calculated in
synthesis and were not adjusted in Unity. Emission levels of other sounds were adjusted in
Unity relative to car sounds as heard inside the virtual scenes.
To do this, the headphone reproduction system needed to be calibrated first. A standard
approach for this could be calibrating the playback level of one of the car source signals to its
synthesised level using a head and torso simulator. However, a subjective approach was used
in this study. In this subjective approach, a male speech sample was played back through
headphones, and the audio volume of the computer was adjusted by the researchers until the
playback sounded as loud as normal speech in a quiet room. The male speech sample was
recorded in the same manner as the recording of human chats, and was calibrated to 60 dB
LAeq using car source signals as references. 60 dB LAeq was chosen since this was reported to
be a typical male speech level in general conditions (Olsen, 1998). This subjective approach
was used, since generally high accuracies in level adjustment could be achieved (Pedersen et
al. 2012), and since it would also be the approach by which participants were to calibrate
After the playback setting, Researchers who were familiar with Piazza Vittoria navigated
inside the virtual scenes to adjust the emission level of each sound except car sounds. This
process of level adjustment relied largely on researchers’ experience and perception.
2.4. User interface and the online test
Along with the visual and audio contents, user interface and evaluation tasks were configured
in Unity. Upon the start, a short description of the demonstrator tool was given to the
participants, followed by questions for their demographic information. The next step was to
calibrate participants’ audio devices. This was achieved by playing the male speech recording sample used in Section 2.3.4 and asking participants to put on their headphones and adjust the
audio volume of their computers until the playback sounded as loud as normal speech in a
quiet room. When they were ready, they clicked to enter the virtual scene of Piazza Vittoria,
and were instructed to use WASD keys to move forward, left, backward and right, and use
the mouse to control direction. By performing five simple tasks, participants explored the
virtual piazza and evaluated the sound environment. A description of the five tasks can be
found in (Author info, 2016). The tasks demonstrated a variety of possible forms of
participation tasks. Finally, participants were asked to rate their ‘VR experience’ by rating
the ‘quality of the virtual visual environment’ and the ‘quality of the virtual sound environment’ on 7-point scales (from ‘poor and unrealistic’ to ‘good and realistic’), and
leave whatever comments that they had on the tool. All the participants’ inputs were logged
and maintained in an online database. Performance of their computers were captured in terms
of frame rates in frames per second (FPS) during each task.
The demonstrator tool was released in forms of a WebGL game and a Unity Web Player
game in September 2016 for an online test. The WebGL version can be opened and used
directly in most popular web browsers (e.g., Firefox, Chrome, Safari, but not Internet
Explorer). The Unity Web Player version provides higher visual and audio rendering qualities,
but requires users to install a small plug-in called Unity Web Player (size: 12 MB)
beforehand. It was left to each participant to decide which version to use. Invitations for the
online test were disseminated via online social media and emails to local communities of
Naples, as well as to researchers and practitioners in the fields of urban planning and
acoustics.
By 24 October 2016, 100 valid responses to the online test were received. Substantially more
participants were from the younger generations (18-35 yrs: 82%; 36-65 yrs: 16%). Most
participants (62%) were willing to install the small plug-in to use Unity Web Player version
for higher VR quality, and most participants (81% with Unity Web Player and 61% with
WebGL) enjoyed frame rates above 30 FPS. Tasks to evaluate the sound environment of
Piazza Vittoria were mostly properly performed. Figure 3 illustrates ratings of the VR quality
given by the participants. It shows that most participants (62%) rated the visual part as
relatively good and realistic with rating scores equal to or above 5 (Mean = 4.73; S.D. = 1.52).
More neutral ratings were given to the sound part with about half of the participants (51%)
rated it as relatively good and realistic (Mean = 4.36; S.D. = 1.61).
34 participants left comments at the end of the test. Many of the comments were on the sound
part, and the acoustic jargon appeared in some comments indicates a high involvement of
acousticians. Some mentioned that the car sounds were not realistic enough and had too much
energy in the low frequencies. This could be due to the fact that the engine orders were
synthesised from full load measurement data. Some thought that the virtual sound
environment was too simple and should have more sound sources with more variations. This
might partly be attributed to the lack of individualisation in car source signal synthesis. Some
thought that the relative levels of different sounds could be better adjusted especially that the
car sounds were too dominating. There were also reports on other sound issues such as
“clicking noise”, not enough sound attenuation, etc. Less comments addressed the visual part and general usage issues. Similar to the sound part, some participants thought that more
environmental elements (e.g., poles, bins and dynamic skybox) and variations (e.g., people’s
activities, vehicle types and movements) should be introduced. Others commented on human
model realism, movement control, evaluation tasks, etc. Apart from the above criticism and
suggestions, many participants expressed that the web-based demonstrator tool was an
innovative and encouraging step towards efficient and effective participatory
decision-making in urban sound planning.
Results of the online test show high potential of online VR to provide virtual visual and
sound environments of decently high quality for participatory evaluation of urban sound
environment, in a convenient and cheap manner for both the participants and the developers.
Both the WebGL and Unity Web Player versions could run properly, suggesting that online
users. Possible improvements in auralisation quality might be made by introducing more
sound sources with more variations and by increasing the realism of synthesised sounds.
When introducing more sound sources, it might be necessary though to prioritise the sound
sources (Hell et al., 2016) to avoid the number of active sounds exceeding possible system
limits and to reduce computational load. Individualisation in car source signal synthesis with
car- and scenario-dependent parameters can increase both sound variation and realism, which
however would require a substantial amount of data measurements. Providing binaural
technology with HRTF filtering and more accurate sound propagation with e.g. reflection and
ground absorption, would also increase sound realism and immersion. However, challenges
on computational load must be considered. For many of these improvements, standardised
database of sound sources and boundary conditions for urban environment will be highly
beneficial.
4. Conclusions
This study developed a demonstrator tool of web-based online VR for participatory
evaluation of urban sound environment. Piazza Vittoria in Naples was used as the case site to
create the virtual environment. Both synthesised and recorded sounds were used and rendered
in computationally cheap ways for auralisation. The tool was tested online and the results
show high applicability of online VR for participatory evaluation of urban sound environment.
The auralisation quality can be improved with more sound sources and variations, more
References
Author et al., 2016. Our conference paper which gives details of the five tasks. To be added after the review process.
3D Warehouse (2016a). “Courtyard Garden Fountain.skp” by BAM1968a .. of 3D
Wharehouse. Retrieved in April 2016 from:
https://3dwarehouse.sketchup.com/model/9c17f9f891bf9355e24eaa3d8c839d5b/Courtyard-Garden-Fountain
3D Warehouse (2016b). “fountain.skp” by nobama of 3D Wharehouse. Retrieved in April
2016 from:
https://3dwarehouse.sketchup.com/model/6ca658d475b3eeed4f793e10f2f2abc2/fountain
3D Warehouse (2016c). “3D People” collection by SketchUp of 3D Wharehouse. Retrieved in April 2016 from:
https://3dwarehouse.sketchup.com/collection/8ed3682b7bf980adc7583f0de950bb4e/3D-People
Alves, S., Estévez Mauriz, L., Aletta, F., Echevarria-Sanchez, G.M. & Puyana Romero, V. (2015). Towards the integration of urban sound planning in urban development processes: the study of four test sites within the SONORUS project. Noise Mapping, 2(1): 57 - 85.
Axford, S, Keltie, G, & Wallis, C. (2007). Virtual Reality in Urban Planning and Design. In: W. Cartwright, M. Peterson, & G. Gartner ed., Multimedia Cartography, Springer, Berlin. 283-294.
Bastürk, S., Maffei, L., Perea Pérez, F. & Ranea Palma, Á. (2011) Multisensory evaluation to support urban decision making. Proceedings of International Seminar on Virtual Acoustics, 24-25 November 2011, Valencia, Spain.
Berzborn, M., Bomhardt, R., Klein, J., Richter, J. & Vorländer, M. (2017). The ITA-Toolbox: An open source MATLAB toolbox for acoustic measurements and signal processing. The 43rd Annual Conference of the German Acoustical Society, 6-9 March 2017, Kiel, Germany.
Bulmer, D. (2001). How can computer simulated visualizations of the built environment facilitate better public participation in the planning process? Online Planning Journal. Retrieved April, 2016 from:
ftp://ftp.itc.nl/pub/pgis/PGIS%20Backup%202006/Curriculum/PGIS%20Articles/complannin g.pdf
Easteal, M., Bannister, S., Kang, J., Aletta, F., Lavia, L. & Witchel, H. (2014). Urban Sound Planning in Brighton and Hove. Forum Acusticum 2014, 7–12 September, Krakow, Poland.
Engel, J. & Döllner, J. (2012). Immersive Visualization of Virtual 3D City Models and its Applications in E-Planning. International Journal of E-Planning Research, 1(4): 17-34
European Parliament and Council (2002). Directive 2002/49/EC relating to the assessment and management of environmental noise, Publications Office of the EU, Brussels, Belgium.
Freesound.org (2016a). “Bird Whistling, A.wav” by InspectorJ of Freesound.org. Retrieved
in June 2016 from: https://www.freesound.org/people/InspectorJ/sounds/339326/
Freesound.org (2016b). “Fountain_1.wav” by skyko of Freesound.org. Retrieved in June
2016 from: https://www.freesound.org/people/skyko/sounds/169250/
Freesound.org (2016c). “waves_barcelona2.wav” by mmiron of Freesound.org. Retrieved in
June 2016 from: https://www.freesound.org/people/mmiron/sounds/243953/
Hell, C. P., Aspock, L. & Vorländer, M. (2016). Strategies for the efficient auralization of complex scenes containing multiple sound sources. The 42nd Annual Conference of the German Acoustical Society, 14-17 March 2016, Aachen, Germany.
Jonasson, H.G. (2007). Acoustical source modelling of road vehicles. Acta Acustica United with Acustica, 93(2):173-184.
Knapp, S. & Coors, V. (2008). The use of e Participation systems in public participation: The VEPs example. In: M. Rumor, V. Coors, E.M. Fendel & S. Zlatanova ed., Urban and Regional Data Management: UDMS 2007 Annual. London: Taylor & Francis Group, 93-104.
Lindquist, M.W. (2014). The Impact of Sound on Landscape Perception: An Empirical Evaluation of Multisensory Interaction for 3D Landscape Visualization, PhD thesis. University of Sheffield, Department of Landscape.
Maffei, L. (2012). Immersive virtual reality for acoustics applications: more than a tool. The 5th Congress of Alps-Adria Acoustics Association, 12-14 September 2012, Petrčane, Croatia.
Maffei, L., Iachini, T., Masullo, M., Aletta, F., Sorrentino, F., Senese, V.P. & Ruotolo, F. (2013a). The effects of vision-related aspects on noise perception for wind turbines in quiet areas. International Journal of Environmental Research and Public Health, 10(5): 1681-1697
Maffei, L., Masullo, M., Aletta, F. & Di Gabriele M. (2013b) The influence of visual characteristics of barriers on railway noise perception, Science of the Total Environment, 445-446: 41-47.
Olsen, W.O. (1998). Average Speech Levels and Spectra in Various Speaking/Listening Conditions: A Summary of the Pearson, Bennett, & Fidell (1977) Report. American Journal of Audiology, 7: 1059-0889.
Pedersen, T.H., Antunes, S. & Rasmussen, B. (2012). Online listening tests on sound insulation of walls. Euronoise 2012, 10-13 June 2012, Prague, Czech Republic.
Pieren, R., Bütler, T. & Heutschi, K. (2016). Auralization of accelerating passenger cars using spectral modeling synthesis. Applied Science, 6(1): 5.
Ruotolo, F., Maffei, L., Di Gabriele, M., Iachini, T., Masullo, M., Ruggiero, G., & Senese, V.P. (2013). Immersive virtual reality and environmental noise assessment: An innovative audio–visual approach. Environmental Impact Assessment Review, 41: 10–20.
Smith, E.L., Bishop, I.D., Williams, K.J.H. & Ford, R.M. (2012) Scenario Chooser: An interactive approach to eliciting public landscape preferences. Landscape and Urban Planning, 106(3): 230–243.
Stienen, J. & Vorländer, M. (2015). Auralization of Urban Environments – Concepts towards New Applications. EuroNoise 2015, 31 May - 3 June 2015, Maastricht, Netherlands.
Unity Asset Store (2016). “Mobile Tree Package” by Laxer of Unity Asset Store. Retrieved
in April 2016 from: https://www.assetstore.unity3d.com/en/#!/content/18866
Weber, B., Müller, P., Wonka, P. & Gross, M. (2009). Interactive geometric simulation of 4D cities. Computer Graphics Forum, 28(2): 481–492.
List of Tables
Table 1. Traffic animation parameters (ZTL: in the scenario with traffic restrictions)
Section 1 Section 2 Section 3 Section 4 Section 5 Section 6 Section 7 Section 8 Section 9 Section 10 Section 11 Section 12 Section 13 Second 14 No. of loops every 120 s
No. of cars assigned
Path 1 Speed (km/h) 50 50-20 20-35 35 35-25 25-50 50 - - - 1 3
7 (ZTL)
Starting time (s) 0 3.7 5.5 7.2 14.5 16.7 18.7 31 - - - -
Path 2 Speed (km/h) 50 50-25 25-35 35 35-30 30 30-40 40-25 25 25-50 50 - - - 1 3
Starting time (s) 0 3.7 5.7 7.4 10.6 13 18.8 21 23.2 24.2 28.2 45 - -
Path 3 Speed (km/h) 50 50-20 20-30 30 30-15 15-30 30 30-40 40 40-25 25 25-50 50 - 1 3
Starting time (s) 0 3.7 5.6 7.2 14.4 16.2 18 23 24.8 25.3 27.1 28.5 32.5 48
Path 4 Speed (km/h) 50 50-25 25-35 35 35-25 25-35 35 35-25 25-50 50 - - - - 1 7
0 (ZTL)
Starting time (s) 0 3.5 5.5 7.3 13.8 15.5 17.3 23 24 27 59 - - -
Path 5 Speed (km/h) 50 50-30 30-40 40 40-25 25 25-35 35-25 25-50 50 - - - - 1 3
0 (ZTL)
Starting time (s) 0 17.4 19.5 21 23.7 25.3 40.7 46.1 48 51 82 - - -
Path 6 Speed (km/h) 50 50-30 30-40 40 40-25 25 25-20 20-30 30 30-20 20 20-50 50 - 1 3
0 (ZTL) Starting time (s) 0 17.4 19.5 21 23.7 25.3 37.9 40 41.8 48 49.8 50.5 53.5 85
Path 7 Speed (km/h) 50 50-35 35 35-40 40 40-30 30 30-50 50 - - - 2 3
10 (ZTL)
Starting time (s) 0 19 20.7 21.5 22.7 25.3 27.7 35.2 39.1 51 - - - -
Path 8 Speed (km/h) 50 50-35 35-40 40 40-25 25 25-40 40 40-30 30 30-50 50 - - 2 3
Starting time (s) 0 19 21.5 22.5 24.7 27.3 31 33.7 36 37.8 38.8 41.8 58 -
Path 9 Speed (km/h) 50 - - - 2 10
0 (ZTL)
Starting time (s) 0 56 - - - -
Path 10 Speed (km/h) 50 50-25 25-35 35 35-25 25 25-50 50 - - - 2 3
4 (ZTL)
Starting time (s) 0 16.6 19.2 21 23.5 25 35.9 42.3 53 - - - - -
Path 11 Speed (km/h) 50 50-30 30-40 40 40-25 25 25-50 50 - - - 3 4
Starting time (s) 0 9.7 11.8 13.6 24.5 26 27 30 40 - - - - -
Path 12 Speed (km/h) 50 50-30 30-40 40 40-25 25 25-50 50 - - - 3 5
Starting time (s) 0 9.7 11.8 13.6 24.5 26.3 27.3 30.3 40 - - - - -
Path 13 Speed (km/h) 50 - - - - - - - - 3 2
Starting time (s) 0 33 - - - - - - -
Path 14 Speed (km/h) 50 - - - - - - - - 3 2
List of Figures
Figure 1. Workflow of the development of the demonstrator tool.
Figure 2. Traffic flows and volumes in the two scenarios. Left: without current traffic restrictions, right: with current traffic restrictions.