Original Research Paper
Assessing travel time reliability implications due to
roadworks on private vehicles and public transport
services in urban road networks
Wael Jamous
a,b, Chandra Balijepalli
a,*aInstitute for Transport Studies, University of Leeds, Leeds LS2 9JT, UK b
AECOM, Manchester M1 4HD, UK
h i g h l i g h t s
Analyses the impact of roadworks on private and public service vehicles.
Integrates conventional assignment modelling with microsimulation modelling.
Network level and O-D pair level reliability is analysed.
Private and public service vehicles suffer alike due to road closures.
Reliability measure varies with diversion scheme. Partial closure is better than total closure.
a r t i c l e i n f o
Article history: Received 14 June 2017 Received in revised form 5 September 2017
Accepted 6 September 2017 Available online 24 July 2018
Keywords: Traffic network Roadworks
Travel time reliability Assignment modelling
a b s t r a c t
Roadworks are perhaps the most controversial topic in transport professional field. On one hand, they are a necessity to assure the current and future functionality of the traffic network, while on the other, they are seen as a major disturbance by road users with concerns for excessive travel time delays. The impact of roadworks is usually analysed at a local level however the network-wide effects are crucial to ensure reliable travel times. Moreover the analysis usually focusses on private cars and the reliability impact on public transport services are too important to ignore. This paper investigates the impact of roadworks undertaken on a given road link over wider parts of the network and assesses travel time reliability for both cars and buses. This research involves setting up of a con-ventional network assignment model to arrive at the route choice of drivers as a result of the roadworks and then integrates the outcomes with a microsimulation model to generate space-time trajectories to arrive at travel times of individual vehicles. We adopted a reli-ability measure from the literature to compute travel time relireli-ability of a given type of vehicle by unique origin-destination (O-D) pair combinations and also more generally to provide a wider picture at an aggregated network level. The method was tested on a real life network in England, and travel time reliability results were analysed both at the network scale and significant O-D pair level for private cars and bus routes.
©2018 Periodical Offices of Chang'an University. Publishing services by Elsevier B.V. on behalf of Owner. This is an open access article under the CC BY-NC-ND license (http:// creativecommons.org/licenses/by-nc-nd/4.0/).
*Corresponding author. Tel.:þ44 113 343 5345.
E-mail addresses:waeljamous@hotmail.com(W. Jamous),n.c.balijepalli@leeds.ac.uk(C. Balijepalli). Peer review under responsibility of Periodical Offices of Chang'an University.
Available online at
www.sciencedirect.com
ScienceDirect
journal homepage: www .e lsev ie r.com/locate/jtte
https://doi.org/10.1016/j.jtte.2017.09.003
1.
Introduction
Traffic networks are deteriorating systems which are subject to recurrent delays due to periodic maintenance works throughout their life cycle to keep up to deliver a desired level of service. Road maintenance works typically aim at improving safety levels to pedestrians and cyclists especially in urban areas as well as maintaining the ride quality and connectivity between origins and destinations. Traffic net-works are also subject to improvement net-works to increase the supply level (capacity) to keep up with traffic growth. Thus, roadworks are events that will happen on a regular basis within traffic networks however they are unwelcomed by the road users especially when the works are on, as they are perceived to cause excessive delays and hence unreliable journey times. Evaluating proposed roadwork diversions is mainly undertaken at, and regulated on a local-scale i.e., on links where the works are taking place following the safety procedures that assure safe work zones and safe usage for public (DfT, 2013). They usually provide messages to road users wherever the impact on the link will cause a delay in travel time beyond two minutes (DfT, 2005). However, it is well known that roadworks on busy urban roads cause extensive delays not only at a local level but also on a wider network scale especially in rush hours, yet such an evaluation of reliability of travel time due to roadworks is unavailable.
Roadworks and the associated traffic diversions needed, cause changes to the traffic network degrading the supply (Emam and Al-Deek, 2006). Degradation of supply in general could be caused by other various reasons such as natural disasterseflooding, earthquakes, bushfires or even loss of capacity simply due to a broken down vehicle. The effect of degradation due to such non-recurrent events is known to be far reaching and has been the subject of vulnerability analysis of road networks which aim to identify critical network links to recover (Jenelius, 2009; Scott et al., 2006). Quite different to the vulnerability analysis of critical network links, in this paper we focus on reliability of travel time caused by recurrent events such as roadworks which cause delays to the traffic flow almost on a daily basis. Due to events such as roadworks, it is not just private vehicles which suffer from excessive delays, but the public transport services such as buses and trams sharing the right of way too will suffer due to the variability in travel time. It is well known that the public transport passengers are highly sensitive to the waiting time (than the in-vehicle travel time) and on-time arrival of bus/tram is crucial to retain the patronage. Thus we aim to address two main questions in this paper:
(i) do roadworks have a significant impact on reliability of network travel time?
(ii) does reliability of public transport service differ sub-stantially compared to private cars within the network?
In this paper we set out to review the travel time reliability measures initially and then adopt a method suitable for ana-lysing the variability of travel time for both public transport
services and private cars. We aim to set up a network assignment model of smallish but real network to find out the rerouting effects of traffic diversions and then use a micro-simulation model to analyse the travel times of individual modes involved. We also intend to analyse the impact on reliability of travel time due to alternative diversion plans.
This paper is divided into five sections. Section2reviews the travel time reliability while section 3 describes the method of computing travel time reliability and the associated modelling process, followed by a numerical case study in section 4 and finally, section 5 concludes the research.
2.
Literature review
This section introduces the idea of travel time reliability more formally by defining the term reliability in traffic networks and then reviews the methods used to quantify the reliability both in the literature and by various government authorities. The argument about traffic network reliability measures started in late 90's and the reliability was initially defined as the“probability that a trip can travel from its origin to desti-nation within acceptable travel time”(Bell and Cassir, 2000). However, the traffic network reliability is a widely used term which was divided into connectivity and performance reliability measures (Bell et al., 1999). Connectivity reliability is the probability that a pair of origin-destination remains connected ensuring that there is at least one path between them (Taylor, 2000). By definition this is more pertinent to the vulnerability analysis of degraded networks especially in sparse strategic networks which is not the main subject of this paper. On the other hand, performance reliability is very relevant as it relates to (i) travel time reliabilityeprobability that a trip can be completed within an acceptable travel time tolerance and (ii) capacity reliabilityeprobability that the reserve capacity of a degraded network is sufficient to accommodate the demand (Bell et al., 1999).Watling (2008) argued that performance reliability measures are appropriate for managing and enhancing any changes to the traffic network. As we intend to analyse the effect of roadworks on travel times in dense urban networks, travel time reliability will be more appropriate to consider than the capacity reliability as the network offers alternative routes to divert the traffic around. Popa et al. (2012) also argued that the travel time reliability measure is relevant to both planners and public users too. Thus, in this paper we focus on travel time reliability as the chosen measure.
2.1. Quantifying travel time reliability
Travel time reliability was studied by several authors (Asakura et al., 1999; Clark and Watling, 2005; Yang et al., 2000) and many more. All the previous studies adopted the probabilistic measure of travel time with differences related to an upper threshold that declares the route as disconnected (Watling, 2008).
ratio of unaffected network travel time to the affected travel time scenario as per the following equation
R¼P
Ti
T0<
C
(1)
whereRis reliability measure,Tiis total travel time on affected network under incidenti,T0is total travel time on unaffected network,Cis acceptable upper limit.
On the other hand, the government bodies adopt a different approach in quantifying the travel time reliability, where Department for Transport in the UK (DfT) recom-mends the usage of standard deviation (or the coefficient of variation) to present the travel time reliability for cars and the algebraic difference between scheduled and actual arrival time for public transport (DfT, 2009). Another approach by the Federal Highway Agency in the USA is based on indicators of 90% or 95% travel times, as well as the buffer index e “the difference between 95% and average travel times over average travel time”e, planning time index and the frequency of“days or time that travel time exceed X minutes” (FHWA, 2014). For a wider discussion on the approaches adopted by various governments the reader is referred to the review cited in Watling and Balijepalli (2012).
It is noted that the above quantification methods usually assume a similar shape of the probability distribution of travel time over time, mostly as lognormal distribution (Chang, 2010; Clark and Watling, 2005; Emam and Al-Deek, 2006; Sikka and Hanely, 2013), which averages the value of reliability over the targeted period (AM peak, PM peak etc.). Accordingly,Van Lint et al. (2008)have argued the accuracy of this assumption since travel time distribution shape is changeable during the peak-hour itself and therefore the averaged travel time distribution will lead to biased reliability values which don't need to reflect the reality. Their argument describes the changeable distribution as normally distributed function within free-flow and congested times, while it is a lognormal distribution during the build-up and dissipating phase of the congestion. Accordingly they proposed travel time unreliability measure based on the skewness of the shape.
Thus to sum up the review, travel time reliability was defined and quantified in different ways. Government bodies aim to adopt methods of quantifying travel time reliability that are useful for field professions and understandable by public road users, while, literature focused mainly on the probability measure to quantify the reliability. The debate on selecting a method to quantify the travel time reliability is still open for discussion, and assessing the adequacy of choosing a method is, mainly, related to the aims of each study (Van Lint et al., 2008). The next section defines the travel time reliability measure adopted for the present work and specifies the method to compute the same.
3.
The method
The proposed method for quantifying the travel time reli-ability will be presented in the first subsection, while the steps involved in modelling will be described in the second.
3.1. Travel time reliability measure
The travel time reliability quantification in this paper will follow the engineering reliability definition as used for travel time in traffic networks by many studies (Bell et al., 1999; Yang et al., 2000), as the probability that a trip can reach its desti-nation within an acceptable range of time. WhileYang et al. (2000)have defined the reliability based on O-D travel time, this paper defines the reliability measure by mode of travel. Thus the travel time reliability for modemis the probability that the ratio of average travel time by the mode with roadworks to the average travel time by the mode without roadworks to remain less than an upper limit. Formally this can be written as below
TTRm i ¼P
TTmi TTm 0
C
(2)
where TTRm
i is travel time reliability (TTR) for modemunder proposed road schemei, TTm
i is average travel time by modem over all vehicles of same type under proposed road schemei, TTm
0 is average travel time by modemover all vehicles of same type in the base case, i.e., without the roadworks, Cis the threshold that is set as 1.2, i.e., travel time under the proposed scheme is not exceeding over 20% above the average travel time in base scenario.
The above quantification method means it can be used for each O-D pair which may have multiple routes between them. However, we wish to develop a reliability measure for the entire network which poses a challenge as the O-D distances significantly vary across the O-D pairs. Thus we propose to introduce a distance weighted average travel time as set out below.
D¼Sn 0dn
whereDis total travelled distance,dnis distance travelled by thenth vehicle (m), and
T¼Sn 0tn
whereTis total travelled time on the network by all vehicles, tn is travel time of the nth vehicle(s), thus, assuming the following function
fðTTÞ ¼TD¼Sn
0tnSn0dn¼Sn0tndn (3) wheref(TT) is the function of travel time (s$m).
In congested networks, it is easy to see that the total travel timeTis a variable while the total travel distanceDis a con-stant for a given routing pattern, thus the distribution of the functionf(TT) is dependent on the distribution of the travel time. The distance weighted total travel time WTT for the full network is thus calculated as
WTT¼Sn0tndn
D (4)
Accordingly, the average travel time is the distance weighted total travel time WTT divided by the number of trips N
TTavr¼ WTT
N ¼
Sn
0tndn
Eq.(5)means the weight of long/short trips is eliminated and the average total travel time presents the average of travel time in time units within the whole network by a given mode of transport regardless of the route, number of trips and how far they have travelled. Finally, by substituting the average travel time based on Eq. (5)computed for the two scenarios “with” and “without” roadworks into Eq. (2) we arrive at the network travel time reliability measure.
3.2. Modelling process
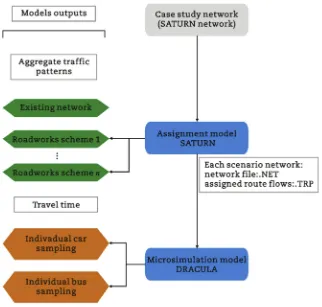
In order to compute the travel time reliability, this paper uses simulation modelling technique to generate travel times of trips modelled. For this purpose, we used a joint modelling procedure with a conventional assignment modelling soft-ware initially to generate the aggregate results, routing pat-terns etc. and thereafter, we used a microsimulation model to generate the travel time data needed based on every individ-ual vehicle space-time trajectory.
The proposed modelling process comprises of using assignment modelling software SATURN (Van Vliet, 2015) and microsimulation modelling software DRACULA (Liu, 2014), where the assignment model will be used as conventional assignment model under user-equilibrium assignment to produce route choices and hence link flows. The assigned route flow output will be extracted into*.TRP file by using the routine SATPIG designed to facilitate the transfer of data to microsimulation program DRACULA (Van Vliet, 2015). Microsimulation model is used to propagate the vehicle
flows in space and time as per the routes worked out by SATURN and to generate outputs for each unique vehicle (trip), i.e., each vehicle travel time from origin to destination. These outputs can be considered as equivalent-to-real-life samples of existing condition (base) which are compared against the forecasts of travel times from the proposed scenarios to quantify the travel time reliability.
Illustration of the modelling process is shown inFig. 1.
4.
Numerical study
In this section, firstly we introduce the network and then describe the proposed roadworks together with the diversion schemes subjected to modelling/testing. Thirdly we assess the targeted road users’ travel time, while the last subsection presents the travel time reliability results.
4.1. Existing network
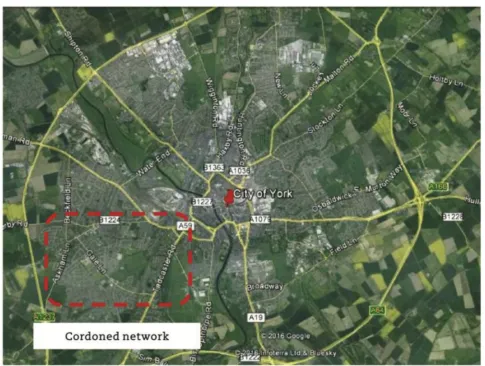
This paper uses a part of York urban network in the UK (Fig. 2). York city is in the north of England with a population estimate of 198,000 (City of York Council, 2016). Cordoned network taken as the study area for this research constitutes south-west side of the city, bounded by major roads: A59 and B1224 in the north, Askham Lane in the west, Gale Lane in the south and Tadcaster Road in the east (Fig. 2). The cordoned network was coded for SATURN software and has been taken as the initial dataset along with the trip matrix
[image:4.595.139.461.428.735.2]of the AM peak flows which has a total demand of about 6000 veh/h, distributed between 40 zones. The network model adopted has been updated, calibrated and validated for 2016 by comparing against the observed flows and travel times but not described in the paper for brevity.
4.2. Targeted travel modes
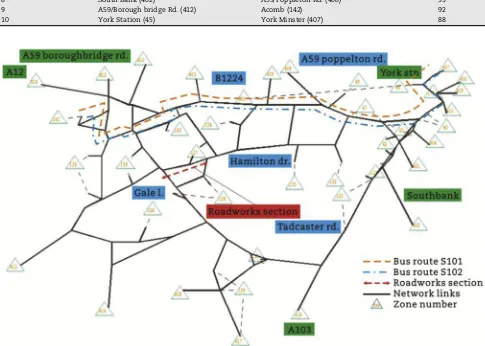
Impact of different traffic diversion schemes will be evaluated for both private cars and public buses. The impact on private cars will be measured at a full network scale, in addition, we will also look at the top ten O-D pairs in terms of the demand (Table 1). There is one bus service that cruises through the cordoned traffic network from east to west, halting at 24 bus stops, terminating at the far western end and starts again on the eastbound route until it exits from the network. In this study, this service has been coded as two separate bus routes: S101 entering the network from the east terminating at the west, and S102 cruising in the opposite direction from west to east, as shown inFig. 3.
4.3. Proposed roadwork schemes
The chosen roadworks for simulation are fairly arbitrary in nature but fullfil the criteria of implementing on a mid-level
road within a hierarchy serving both local traffic and through traffic. It is assumed that the roadworks chosen will last for sufficiently long duration allowing the road users to reach an equilibrated state of flow assignment wherein no individual driver will be able to swap routes to reduce their travel time.
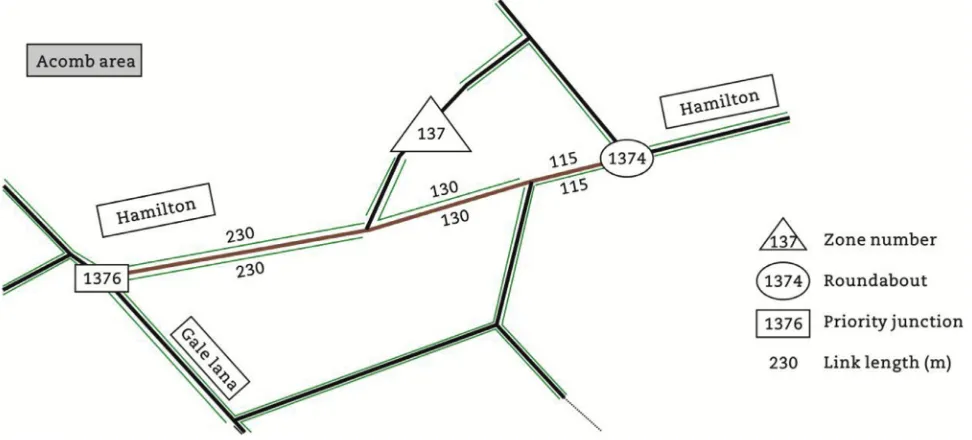
Accordingly, a section of Hamilton dr. (collector road, sin-gle carriageway operating in both directions, 6.45 m wide with 30 mph posted speed) was nominated for resurfacing main-tenance work (involving asphalt milling and inlaying) on a section of 475 m in length, located between roundabout junction (junction 1374 in the east) and priority junction (junction 1376 in the west), with an assumption that these works will last for 15 days (Fig. 4).
In the interest of evaluating different traffic diver-sion plans, schemes as set out below are proposed to be implemented:
Scheme 0eexisting situation;
Scheme 1etotal closure of the road section wherein no traffic flow is allowed; and
Scheme 2edirectional closure of the road section imple-mented in two subsequent phases for each direction. The posted speed for operated flow is reduced to 10 mph (FHWA, 2014, Table 4), while the lane width adopted will be to the absolute minimum allowed which is 2.5 m (DMRB, 2003, Section 4).
[image:5.595.54.540.57.423.2]The two phases of the scheme 2 are described as follow; Scheme 2aeclosure of the traffic direction from east-to-west while the internal junctions; 1373 and 1372 will remain under operation but with restricted turning movements.
Scheme 2beclosure of traffic direction from west-to-east while internal junctions will remain under operation but with restricted turning movements.
4.4. Travel time reliability calculation and results
4.4.1. Modelling and extracting data
Following the steps described in the methods section earlier traffic network has been coded for the following four scenarios:
i. Existing condition scheme 0; ii. Roadworks diversion scheme 1; iii. Roadworks diversion scheme 2a; iv. Roadworks diversion scheme 2b.
[image:6.595.57.542.175.521.2]Each scenario was modelled by the conventional assign-ment model software (SATURN) for AM peak hour, thereafter, the outputs in terms of assigned trips to various routes were extracted from and used in the microsimulation model (DRACULA) which generated time-space profiles of each simulated vehicle trip by cars and buses plying on routes S101 and S102. Travel times of each simulated trip were extracted for (i) the full network, (ii) top 10 O-D pairs identified earlier, and (iii) buses on routes S101 and S102. The total number of Table 1eTop 10 O-D pairs in terms of demand flow AM peak.
Serial number Origin zone (zone number) Destination zone (zone number) Demand flow (veh/h)
1 Clementhorpe (403) York Minster (407) 176
2 The Rise (411) Acomb (142) 153
3 A59/Poppleton Rd. (408) South Bank (402) 136
4 York Minster (407) A1036 Road (418) 134
5 York Station (45) Clementhorpe (403) 99
6 A1237 Road (414) Acomb (142) 96
7 A1036 Road (418) York Minster (407) 94
8 South Bank (402) A59/Poppleton Rd. (408) 93
9 A59/Borough bridge Rd. (412) Acomb (142) 92
10 York Station (45) York Minster (407) 88
reported trips includes 5727 made at the scale of full network and one of the selected O-D pairs has an absolute minimum of 80 trips. However, the simulated number of buses per an hour long simulation run was so small to compare, hence, the microsimulation modelling was repeated for a period of five-days of simulation by using the capability of DRACULA soft-ware in generating different scenarios of the same flow assignment by changing the initial seeding value (NSEED parameter). Accordingly, the sample size of buses reported a minimum of 12 buses.
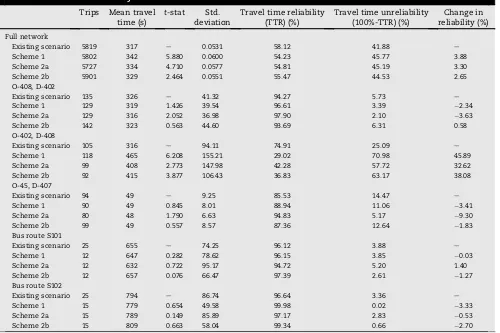
Thus, travel time reliability was calculated, as presented in Table 2.
4.4.2. Results
As an overview, the travel time reliability results for private cars showed varying response to each of the proposed diver-sion scheme of roadworks (Table 2). The aggregate result for the full network predicts a change in reliability by a maximum of 3.88% (positive value means reduced reliability, negative value means improved reliability), and on the other hand the impact for individual O-D pairs fluctuated someway between an improvement and a reduction.
O-D pair 402e408 would be the most affected one (Fig. 5), with a drop in the reliability measure by about 46% due to an increment in mean travel time of 2.5 min, however, three other O-D pairs have shown a slight improvement in their reliability (maximum of less than 10%): 407e418, 414e142 and 412e142, though they are all short trips with their average travel time within the range of 2e7 min.
The results of both the bus routes do not show any sig-nificant change in travel time, neither a sigsig-nificant impact on their reliability, where reliability measure fluctuates between 3% improvement and 1.4% reduction.
We now discuss the most significant traffic network's components in greater detail.
a. Aggregate result for the full network
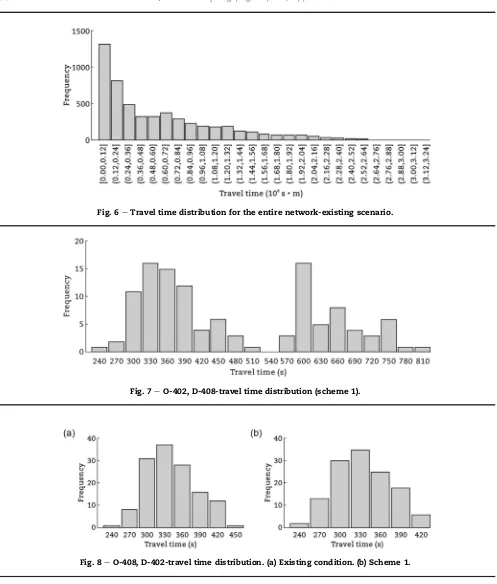
The generated result from each scenario reports a sample size of 5727 trips up to 5901, with statistically significant average travel times. On the other hand, it is noted that the variation in travel time, presented by standard deviation, has increased under the proposed roadworks. However, the above statistical measures didn't affect, significantly, the shape of the probability distribution of travel time samples, which remained lognormally distributed (left-skewed with long tail) (Fig. 6).
The travel time reliability results predict that the full network travel time reliability will be reduced by 3.88% and 2.65%e3.30% under proposed schemes 1 and 2, respectively (Table 2).
b. O-D pair 402e408
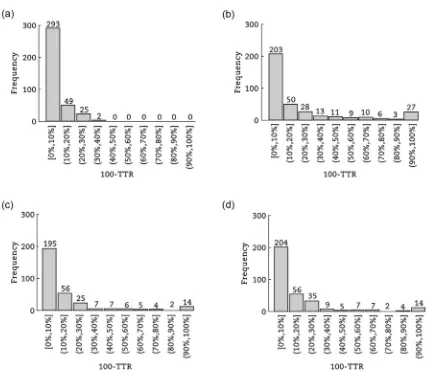
The O-D pair 402e408 is observed as the worst impacted under different schemes. The report is based on a sample size of 92 up to 118 trips, along with a significant increment in the average travel time and its variation. The shape of the travel time distribution has changed to a bimodal distribution (Fig. 7), which was lognormal earlier.
This O-D pair is the only one that is connected by two routes; the major route accommodates 71% of the demand and the balance 29% via the minor one. The introduction of the pro-posed schemes has affected the minor route and increased the demand by a maximum of 9% due to traffic diversion. However, the data analysed above is aggregated for both the routes, and accordingly, it can be interpreted that the proposed schemes have made the two routes significantly different to each other as though there are two distributions as a result.
[image:7.595.54.540.68.288.2]c. O-D pair: 408e402
In the reverse direction O-D: 408e402, shows an improve-ment in travel time reliability. The sample size reported ranges from 129 up to 142 trips, a reduction in the average travel time (not fully significant) and also a reduction in the variation (except scheme 2b). These changes have also impacted the travel time distribution shape to some extent,
[image:8.595.53.553.78.411.2]where the general shape has been less skewed resulting in a more pronounced normal distribution with a reduction in its spread by half a minute from the left side, as shown inFig. 8. The new distribution suggests more symmetrical and less skewed frequencies from 270 to 390 s in scheme 1 (Fig. 8(b)), compared to more dispersed travel time frequencies between 270 and 420 s (Fig. 8(a)). This corresponds with the reduction of variation noted as well.
Table 2eTravel time reliability results.
Trips Mean travel time (s)
t-stat Std. deviation
Travel time reliability (TTR) (%)
Travel time unreliability (100%-TTR) (%)
Change in reliability (%)
Full network
Existing scenario 5819 317 e 0.0531 58.12 41.88 e
Scheme 1 5802 342 5.880 0.0600 54.23 45.77 3.88
Scheme 2a 5727 334 4.710 0.0577 54.81 45.19 3.30
Scheme 2b 5901 329 2.464 0.0551 55.47 44.53 2.65
O-408, D-402
Existing scenario 135 326 e 41.32 94.27 5.73 e
Scheme 1 129 319 1.426 39.54 96.61 3.39 2.34
Scheme 2a 129 316 2.052 36.98 97.90 2.10 3.63
Scheme 2b 142 323 0.563 44.60 93.69 6.31 0.58
O-402, D-408
Existing scenario 105 316 e 94.11 74.91 25.09 e
Scheme 1 118 465 6.208 155.21 29.02 70.98 45.89
Scheme 2a 99 408 2.773 147.98 42.28 57.72 32.62
Scheme 2b 92 415 3.877 106.43 36.83 63.17 38.08
O-45, D-407
Existing scenario 94 49 e 9.25 85.53 14.47 e
Scheme 1 90 49 0.845 8.01 88.94 11.06 3.41
Scheme 2a 80 48 1.790 6.63 94.83 5.17 9.30
Scheme 2b 99 49 0.557 8.57 87.36 12.64 1.83
Bus route S101
Existing scenario 25 655 e 74.25 96.12 3.88 e
Scheme 1 12 647 0.282 78.62 96.15 3.85 0.03
Scheme 2a 12 632 0.722 95.17 94.72 5.20 1.40
Scheme 2b 12 657 0.076 66.47 97.39 2.61 1.27
Bus route S102
Existing scenario 25 794 e 86.74 96.64 3.36 e
Scheme 1 15 779 0.654 49.58 99.98 0.02 3.33
Scheme 2a 15 789 0.149 85.89 97.17 2.83 0.53
Scheme 2b 15 809 0.663 58.04 99.34 0.66 2.70
Note: travel time reliability results for only three of the top ten O-D pairs were shown as the other O-D pairs showed no significant change and hence not shown.
[image:8.595.116.484.587.736.2]Thus, the model predicts an improvement in travel time reliability by 2.34% and 3.63% under schemes 1 and 2a, respectively.
d. Bus route S101
The data sums to a sample size of 20 buses for the existing condition and 12 for other scenarios. The results show no significant difference in the average travel time.
However, the variation in travel time (standard deviation) reduces for scheme 1 and scheme 2a, but an increment is predicted for scheme 2b. However, the above changes are not reflected on the distribution shape where the general pattern remained lognormal, left-skewed, with similar travel time spread in all scenarios except scheme 2a, which is right skewed lognormal.
The reliability results show a low impact, with a fluctuation between 1.27% improvement in reliability with scheme 2a and Fig. 6eTravel time distribution for the entire network-existing scenario.
Fig. 7eO-402, D-408-travel time distribution (scheme 1).
[image:9.595.48.545.39.623.2] [image:9.595.101.512.60.239.2]1.4% reduction with scheme 2b, while with scheme 1 travel time reliability remains largely unaltered.
e. Bus route S102
The simulation of this route reports the same sample size of the previous route and a similar trend of insignificant change in travel time. On the other hand, the variation in travel time under the proposed schemes is reduced signifi-cantly, by more than 40%. The maximum expected reduction in variation is with scheme 1 while with scheme 2a the vari-ation remains at the same level as the existing condition. Furthermore, the trend in the distribution shape change similar to that of bus route S101 has been observed here too, nonetheless with a significant reduction of spread by a maximum of 3 min (total of both sides), which can be read as a correlation with the reduction in the travel time variation.
However, the results of travel time reliability predict an overall improvement in travel time reliability by 3.33% and 1.6% under the influence of schemes 1 and 2 (averaged) respectively.
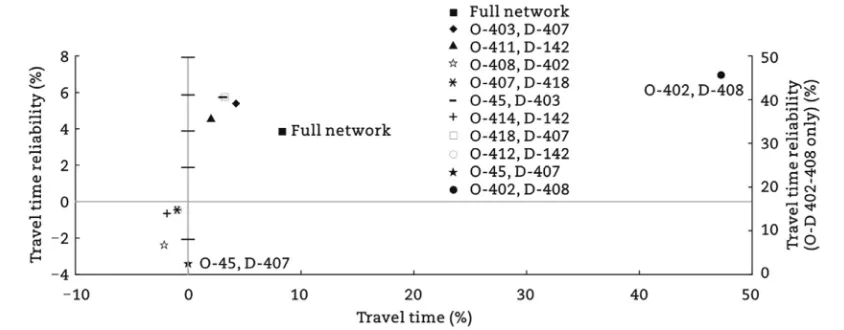
f.Active O-D pairs in the network
Although we focussed on top-10 O-D pairs so far, in order to draw some general conclusions, we need to extend the anal-ysis to for all other O-D pairs. However, we need to filter out the O-D pairs which have very few trips plying between them. Within the network under study, the trip matrix indicates that approximately 1250 O-D pairs (out of 1600 O-D pairs) are exchanging less than two trips during the peak hour, while 350 O-D pairs are exchanging trips equal to or more than two trips. These 350 O-D pairs will be named as active O-D pairs. The travel time reliability was calculated for all the active O-D pairs under existing condition and with the three schemes described earlier. The results are presented as histograms shown inFig. 9, which indicate that the travel becomes more unreliable under the proposed schemes, where many O-D pairs become totally unreliable i.e. travel time unreliability of 100%, compared to a maximum unreliability of 40% in the existing condition. Furthermore, the proposed scheme 2 shows less impact on travel time reliability compared to scheme 1, as maximum number of O-D pairs which are
[image:10.595.86.516.325.701.2]unreliable by 50% and more are 34 pairs compared to 55 pairs. This is intuitively acceptable as scheme 1 proposes a complete closure of Hamilton dr. while scheme 2 involves one-way operations.
4.4.3. Final comments on travel time reliability results In this section we offer a few more comments on travel time reliability results especially on their similarity with results published in the literature. By looking at the simulation re-sults, the main observations are as below:
a correlation between the standard deviation and reli-ability results exists (refer to results inTable 2), which was consistent with as noted previously byBell et al. (1999).
the impact of any proposed scheme on O-D pairs varies, with some expected to improve while the others reduce as shown in Table 2 and Fig. 5. This agrees with the conclusion made byPopa et al. (2012).
an increment in travel time in general results in less reli-able route (travel time). However, one O-D showed a notable result, O-D 45e407, which showed no change in travel time and yet the best improvement in the reliability (Fig. 10).
5.
Summary and concluding remarks
Roadworks are inevitable activity on any road network, and the analysis usually focuses on the local impact surrounding the location. However, this paper considers the affects at a larger scale over the entire traffic network and analyses the travel time reliability impact on private cars and buses. In the literature, roadworks fall under irregular condition-depen-dent variation that affects the travel time distribution, hence, any change in the distribution will affect the reliability value. Thus, this paper adopted a probability measure for quan-tifying the travel time reliability and proposed a joint model-ling procedure using conventional assignment and microsimulation models to evaluate the proposed roadwork diversion schemes. The conventional assignment model al-lows modifying the network for each proposed diversion
scheme, generating the route assignment for the given flow. In addition, a microsimulation model is useful for modelling vehicular flows especially private cars and public buses generating the time-space profile for each individual trip made within the network.
A joint modelling methodology was proposed and used in the numerical study to assess the impact of roadworks traffic diversions on traffic network for cars and buses. The out-comes of the case study showed that the overall travel time reliability at the network scale is expected to reduce with the roadworks. It is also noted that each proposed diversion scheme had a different impact on selected O-D pairs and bus routes indicating the need to evaluate alternative proposals for undertaking the roadworks. Although a few O-D pairs showed a slight improvement in travel time reliability, ma-jority of the others are expected to experience reduced reli-ability, and the travel time on the most affected O-D pair will be worse off by three times compared to the existing condition without roadworks despite the fact that it is located well away from the roadworks section. This observation points us to the need to undertake an analysis of the impact at a wider network scale rather than limiting the analysis to the local vicinity. Finally, the results also showed that the computed reliability measure is correlated to the change in the travel time of the O-D pair, especially as an increment in travel time reduces the reliability. In the rest of this section we discuss potential issues/limitations associated with the modelling approach used in this research.
[image:11.595.83.505.65.230.2]up the trip matrix to improve the accuracy of travel time predictions. However, with a sliced matrix approach it is likely that some of the vehicles departed from their respective ori-gins may not be able to reach their destinations within the sliced time period thus it may yield distorted results due to the randomness associated with the departure time as well as depending on the length of the sliced time period. Time dependent origin flow profiles to a high degree of resolution e.g. 10 min would help addressing the issue but such high quality dynamic O-D matrix is not easily available.
Roadworks do affect the reliability of travel time, and drivers learn from their daily experiences and adjust their route choices over a period of time. Traditional traffic assignment models usually have peak hour of a typical day as their focus while the process of learning needs to extend the paradigm to over multiple number of days. The iterative pro-cess involved in arriving at an equilibrium solution in a within day traffic assignment model is sometimes interpreted as similar to the adjustment of route choice of drivers in a day-to-day context. In our research we have incorporated the roadworks into SATURN model to arrive at an equilibrium set of route flows which are then passed on to DRACULA to analyse the impact of roadworks thus empirically incorpo-rating the effect of reliability into traffic assignment model.
Finally, a note on model validation. Although we have validated the assigned flows and travel times in SATURN and DRACULA independently, we do not have any data related to the roadworks described in the case study. Thus to validate the joint model of SATURN/DRACULA for roadworks, we will require the knowledge of routing of individual drivers and their O-D travel times during the implementation roadworks mentioned. This may be obtained through road side interview techniques or even by using web-based surveying methods although the response rate could be poor and even the results may be affected by bias, which can be taken up as further research topic in the future.
The proposed method and the results of the numerical study suggest potential applications such as evaluating different diversion schemes, assessing the impact on bus routes within the network and propose mitigation, identifying the routes subject to the highest reduced reliability and accordingly targeting them in public information campaign of “expected delay”signage.
Conflicts of interest
The authors do not have any conflict of interest with other entities or researchers.
r e f e r e n c e s
Asakura, Y., Kashiwandi, M., Hato, E., 1999. Flow model and performability of road network under degraded conditions. In: 14th International Symposium on Transportation and Traffic Theory, Oxford, 1999.
Bell, M., Cassir, C., Iida, Y., et al., 1999. A sensitive based approach to network reliability assessment. In: 14th International
Symposium on Transportation and Traffic Theory, Oxford, 1999.
Bell, M., Cassir, C., 2000. Reliability of Transport Networks. Research Studies Press Ltd, Baldock.
Chang, J., 2010. Assessing travel time reliability in transport appraisal. Journal of Transport Geography 18 (3), 419e425. City of York Council, 2016. Headline Fig.S for YorkeCensus 2011.
Available at: https://www.york.gov.uk/info/20037/statistics_ and_information/79/census. (Accessed 5 August 2016). Clark, S., Watling, D., 2005. Modelling network travel time
reliability under stochastic demand. Transportation Research Part B: Methodological 39 (2), 119e140.
DfT, 2005. Interim Advice Note 64/05eDriver Information Signs at Road Works. Available at: http://www.standardsforhighways. co.uk/ha/standards/ians/pdfs/ian64.pdf. (Accessed 15 July 2016). DfT, 2009. The Reliability Sub-objective, TAG Unit 3.5.7. Available at: http://persona.uk.com/A21Ton/Core_dox/Q/Q19.pdf. (Accessed 15 July 2016).
DfT, 2013. Safety at Street Works and Road Works. Available at: https://www.gov.uk/government/publications/safety-at-street-works-and-road-works. (Accessed 1 August 2016). DMRB, 2003. Design Manual for Roads and Bridges/Section 4.
London. Department for Transport, London.
Emam, E.B., Al-Deek, H., 2006. Using real-life dual-loop detector data to develop new methodology for estimating freeway travel time reliability. Transportation Research Record 1959, 140e150.
FHWA, 2014. Mitigation Strategies for Design Exceptions/Lane Width. Available at: http://safety.fhwa.dot.gov/geometric/ pubs/mitigationstrategies/chapter3/3_lanewidth.cfm. (Accessed 15 June 2016).
Jenelius, E., 2009. Network structure and travel patterns: explaining the geographical disparities of road network vulnerability. Journal of Transport Geography 17 (3), 234e244. Liu, R., 2014. DRACULA 3.1 User Manual. Available at:http://www.
its.leeds.ac.uk/software/dracula/. (Accessed 6 May 2016). Popa, M., Rosca, E., Rusca, F.V., 2012. On transport network
reliability. Transport Problems 7 (3), 127e134.
Scott, D.M., Novak, D.C., Aultman-Hall, L., et al., 2006. Network robustness index: a new method for identifying critical links and evaluating the performance of transportation networks. Journal of Transport Geography 14 (3), 215e227.
Sikka, N., Hanely, P., 2013. What do commuters think travel time reliability is worth? Calculating the economic value of reducing the frequency and extent of unexpected delays. Transportation 40 (5), 903e919.
Taylor, M., 2000. Using network reliability concepts for traffic calming. In: Bell, M., Cassir, C. (Eds.), Reliability of Transport Networks. Research Studies Press Ltd, Baldock.
Van Lint, J.W.C., Henk, J., Zuylen, Van, Tu, H., 2008. Travel time reliability on freeways: why measures based on variances tell only the half story. Transportation Research Part A: Policy and Practice 42 (1), 258e277.
Van Vliet, D., 2015. SATURN Manual&AppendiceseManual v11.3. Available at:www.saturnsoftware.co.uk/saturnmanual/index. html. (Accessed 8 April 2016).
Watling, D., 2008. Modelling and evaluation of reliability impact in road networks: concepts and methods for traffic assignment models. In: European Transport Conference 2008, Leiden, 2008.
Watling, D.P., Balijepalli, N.C., 2012. A method to assess demand growth vulnerability of travel times on road network links. Transportation Research Part A: Policy and Practice 46 (5), 772e789.
Mr Wael Jamous, traffic engineer at AECOM, holds BSc in civil engineering and MSc (Eng) in transport planning and engi-neering from the Institute for Transport Studies (ITS), University of Leeds, UK. He gained extensive experience in highway designing and engineering works during his stint in the Middle East for over eight years with a consultancy firm. Currently, he is working on several schemes in the UK for the traffic and local roads team, including highway and traffic engineering in Liverpool, the traffic management scheme for UEFA Champions final match event in Cardiff and junction improvement scheme in Manchester.