RESEARCH
Design and validation of a disease
network of inflammatory processes in the
NSG-UC mouse model
Henrika Jodeleit
1†, Pia Palamides
5†, Florian Beigel
3, Thomas Mueller
4, Eckhard Wolf
1, Matthias Siebeck
2and Roswitha Gropp
2*Abstract
Background: Ulcerative colitis (UC) is a highly progressive inflammatory disease that requires the interaction of epithelial, immune, endothelial and muscle cells and fibroblasts. Previous studies suggested two inflammatory condi-tions in UC-patients: ‘acute’ and ‘remodeling’ and that the design of a disease network might improve the understand-ing of the inflammatory processes. The objective of the study was to design and validate a disease network in the NOD-SCID IL2rγnull (NSG)-UC mouse model to get a better understanding of the inflammatory processes.
Methods: Leukocytes were isolated from the spleen of NSG-UC mice and subjected to flow cytometric analysis. RT-PCR and RNAseq analysis were performed from distal parts of the colon. Based on these analyses and the effects of interleukins, chemokines and growth factors described in the literature, a disease network was designed. To validate the disease network the effect of infliximab and pitrakinra was tested in the NSG-UC model. A clinical- and histologi-cal score, frequencies of human leukocytes isolated from spleen and mRNA expression levels from distal parts of the colon were determined.
Results: Analysis of leukocytes isolated from the spleen of challenged NSG-UC mice corroborated CD64, CD163 and
CD1a expressing CD14+ monocytes, CD1a expressing CD11b+ macrophages and HGF, TARC, IFNγ and TGFß1 mRNA
as inflammatory markers. The disease network suggested that a proinflammatory condition elicited by IL-17c and lipids and relayed by cytotoxic T-cells, Th17 cells and CD1a expressing macrophages and monocytes. Conversely, the remodeling condition was evoked by IL-34 and TARC and promoted by Th2 cells and M2 monocytes. Mice benefitted from treatment with infliximab as indicated by the histological- and clinical score. As predicted by the disease network infliximab reduced the proinflammatory response by suppressing M1 monocytes and CD1a expressing monocytes and macrophages and decreased levels of IFNγ, TARC and HGF mRNA. As predicted by the disease network inflamma-tion aggravated in the presence of pitrakinra as indicated by the clinical and histological score, elevated frequencies of CD1a expressing macrophages and TNFα and IFNγ mRNA levels.
Conclusions: The combination of the disease network and the NSG-UC animal model might be developed into a powerful tool to predict efficacy or in-efficacy and potential mechanistic side effects.
Keywords: Ulcerative colitis, Disease network, Autoimmunity, Inflammatory bowel disease, NSG, NSG-UC
© The Author(s) 2017. This article is distributed under the terms of the Creative Commons Attribution 4.0 International License (http://creativecommons.org/licenses/by/4.0/), which permits unrestricted use, distribution, and reproduction in any medium, provided you give appropriate credit to the original author(s) and the source, provide a link to the Creative Commons license, and indicate if changes were made. The Creative Commons Public Domain Dedication waiver (http://creativecommons.org/ publicdomain/zero/1.0/) applies to the data made available in this article, unless otherwise stated.
Open Access
Background
Inflammation in ulcerative colitis (UC) is a highly dynamic, spatial and temporal response and involves the communication of epithelial-, immune-, endothelial- and muscle cells and fibroblasts [1]. In contrast to Crohn’s dis-ease, UC is considered a Th2 characterized inflammation. However, the role of Th2 cytokines has not been conclu-sively demonstrated [2, 3]. To get a better understanding of the processes in UC, we took on a different approach and considered the Th2 arm as the driver of wound heal-ing ultimately leadheal-ing to remodelheal-ing of the colon archi-tecture [1, 4]. Based on the assumption that epithelial cells play an active role in the inflammatory process by releasing cytokines to direct immune responses we designed a panel of immune cells, cytokines and growth factors to develop immune profiles of UC patients. This profiling led to the identification of two inflammatory conditions referred to as ‘acute’ and ‘remodeling’, the lat-ter of which was favored by treatment with infliximab [4]. The acute inflammatory condition was characterized by immune cells supporting the adaptive immunity, thymus and activation regulated chemokine (TARC) and hepatic growth factor (HGF). In contrast, the remodeling condi-tion was characterized by innate immune cells such as NK T cells and TSLPR expressing CD14+ monocytes,
periostin and transforming growth factor (TGF) ß1. The observation of an acute inflammatory arm was corrobo-rated by data showing elevated frequencies of CD8+-,
Th1- and Th17-T-cells in UC patients with active disease [5]. Furthermore, immune profiling of UC patients led to the identification of CD1a expressing CD11b+
mac-rophages and CD14+ monocytes as biological markers
for UC [4]. These cells have been shown to present self-lipids to conventional αß CD4+ T cells to evoke an
auto-immune response [6–8]. Finally, analysis of autoantibody levels suggested that autoimmunity might play a crucial role in a subgroup of patients (our own results). Thus, there seems to be a strong proinflammatory response which might be driven by IL-17 secreted by Th17 cells and by Th1 cells arising from Th17 cells in the presence of IL-6 [9, 10] or Th1 cells activated via CD1a providing an explanation for the responsiveness to TNFα block-ers of a subgroup of UC patients. All these observations suggested that a map of the disease network illustrating the interaction and communication of immune-, epithe-lial cells and fibroblast may be a promising approach to understand inflammatory processes in UC and to predict efficacy and potential side effects of therapeutics. For the design and validation of the disease network, we took advantage of a mouse model of UC that is based on NOD-SCID IL2rγnull (NSG) mice reconstituted with PBMC
from human patients with UC (NSG-UC) [11]. Most of the cell types identified as crucial in UC patients could
also be detected in spleen or colon of challenged mice. As in our previous hypothesis [1], the disease network was based on the assumption that damaged epithelial cells release signals to direct immune responses. However, we expanded the view and included IL-7, IL-17c, and lipids as factors to drive inflammation in UC. IL-7 is secreted by intestinal epithelial- and goblet cells to activate and to induce proliferation of T-cells and thus acts probably as an amplifier of a given immunological direction [12]. IL-17c promotes IL-17 responses of Th17 cells and autoim-munity [13]. IL-17A that is released by Th17 cells acts on epithelial cells to induce the release of IL-8 and CXCL1 to attract neutrophils and induce mucus production [14]. Both, IL-17A and IL-17c act on fibroblasts to release IL-6 [14]. In the presence of IL-6 and other factors, Treg can adopt a Th17 phenotype thus skipping the inflammatory balance twofold: by diminishing the Treg and by increas-ing the Th17 pool [15].
IL-33 has been described as an activator of innate lym-phoid cells [16] to induce the classical Th2 cytokines IL-4, IL-5, and IL-13. In turn, IL-13 impairs barrier integ-rity and induces goblet cell hyperplasia and mucus pro-duction [3, 17].
IL-34 that has recently been described as an important interleukin in IBD is thought to promote the differen-tiation of M2 monocytes [18]. In normal wound healing processes, M2 macrophages are responsible for resolving inflammation and promoting fibrosis [19].
Thymic stromal lymphopoietin has been described as an important modulator of Th1/Th2 immune responses and to play a major role in tissue homeostasis and main-taining peripheral tolerance [20]. In the presence of IL-4, TSLP instructs dendritic cells to enforce a Th2 phenotype in naïve T-cells ultimately resulting in remodeling of the colon architecture [21–23]. In concert with IL-13 TSLP induces the differentiation of M2 monocytes [24] and fibrocytes [25] which evokes an immune modulatory and remodeling response by the secretion of TGFß1, IL-10, and periostin. TARC activates and attracts leukocytes bearing the CCR4 receptor to include Th2-, Th17-cells, and monocytes [26–28]. Recently it has been shown to signify effector-type FoxP3+ CD4+ regulatory T cells. Depletion of these cells with an anti CCR4 antibody evoked anti-tumor responses in humans [29].
macrophages activate conventional αß CD4+ T cells. Furthermore, CD1a expressing monocytes have been shown to be widely distributed in other organs includ-ing the colon and have been shown to express IL-12 and to activate Th1 cells [7, 32]. The supply of fatty acid ligands could be provided by phospholipase A2 (PLA2)— an major ingredient of inflammation and bee- and wasp venom [33].
The map of the disease network was validated by treat-ing NSG-UC mice with therapeutics interfertreat-ing with the ‘acute’ or ‘remodeling’ inflammatory condition. Results confirmed the previously suggested two inflammatory conditions and indicated that the disease map might be developed into a useful tool to predict efficacy of thera-peutics and their potential mechanistic side effects.
Methods
Isolation of PBMC and engraftment
60 ml of peripheral blood were collected from the arm vein of patients suffering from UC in trisodium citrate solution (S-Monovette, Sarstedt, Nürnberg, Germany). Hank’s balanced salt solution (HBSS, Sigma Aldrich, Deisenhofen, Germany) was used to dilute the blood in a 1:2 ratio and 30 ml of the suspension were loaded onto LeucoSep tubes (Greiner Bio One, Frickenhausen, Ger-many). Peripheral blood mononuclear cells (PBMC) were separated by centrifugation at 400g for 30 min and no deceleration. The interphase was extracted and diluted with phosphate buffered saline (PBS) to a final volume of 40 ml. Cells were counted and centrifuged at 1400g for 5 min. The cell pellet was resuspended in PBS at a con-centration of 4 × 10⁶ cells in 100 µl.
Six to eight-week old NOD.cg-PrkdcSCID Il2rgtm1Wjl/
Szj mice (abbreviated as NOD IL-2Rγnull) were engrafted
with 100 µl cell suspension into the tail vein on day 1.
Animal study protocol
NOD IL-2Rγnull mice were obtained from Charles River
Laboratories (Sulzfeld, Germany). Mice were kept under specific pathogen-free conditions in individually ven-tilated cages in a facility controlled according to the Federation of Laboratory Animal Science Association (FELASA) guidelines. Following engraftment (day 1) mice were pre-sensitized by rectal application of 150 µl of 10% ethanol on day 8 using a 1 mm cat catheter (Henry Schein, Hamburg, Germany). The catheter was lubricated with Xylocaine©Gel 2% (AstraZeneca, Wedel). The rec-tal application was performed under general anesthe-sia using 4% isoflurane. Post application mice were kept at an angle of 30° to avoid ethanol dripping. On day 15 and 18 mice were challenged by rectal application of 50% ethanol following the protocol of day 8. Mice were sacri-ficed on day 21. Pitrakinra (10 µg in 0.5% Methylcellulose,
0.05% TWEEN 80 in PBS) [34] was applied on day 7–9 and 14–21. Sterile Saline (B. Braun Melsungen AG, Ger-many) served as a control. Infliximab, [6 mg/kg (Remi-cade©, Janssen The Netherlands)] and isotype control (30 µg in 200 µl PBS, Morphosys AG, Planegg, Germany) were applied on day 7 and 14. All treatments were applied intraperitoneally.
Clinical activity score
The assessment of colitis-severity was performed daily according to the following scoring system: Loss of body weight: 0% (0), 0–5% (1), 5–10% (2), 10–15% (3), 15–20% (4). Stool consistency: formed pellet (0), loose stool or unformed pellet (2), liquid stools (4). Behavior: normal (0), reduced activity (1), apathy (4) and ruffled fur (1). Body posture: intermediately hunched posture (1), per-manently hunched posture (2). The scores were added daily into a total score with a maximum of 12 points per day. Animals who suffered from weight loss > 20%, rec-tal bleeding, recrec-tal prolapse, self-isolation or a severity score > 7 were euthanized immediately and not taken into count. All scores were added for statistical analysis.
Isolation of human leukocytes
To isolate human leukocytes from murine spleen, spleens were minced and cells filtrated through a 70 µl cell strainer (Greiner Bio-One, Frickenhausen) followed by centrifugation at 1400g for 5 min and resuspended in FACS buffer (1× PBS, 2 mM EDTA, 2% FCS). For further purification cell suspensions were filtrated using a 35 µm cell strainer (Greiner Bio-One, Frickenhausen) and then labeled for flow cytometry analysis. Cells were defined as shown in Additional file 1: Table S1.
Flow cytometry analysis
Labeling of human leukocytes was performed accord-ing to Additional file 1: Table S2. All antibodies were purchased from Biolegend (San Diego, USA) and used according to the manufacturer’s instructions. Flow cytometry was performed using a BD FACS Canto II™ and analysed with FlowJo 10.1-Software (FlowJo LLC, Oregon, USA).
Histological analysis
major infiltration of inflammatory cells into the Lamina propria (2), confluent infiltration of inflammatory cells into the Lamina propria (3), infiltration of inflammatory cells including tunica muscularis (4). Fibrosis was scored as follows: focal fibrosis (1), multifocal fibrosis and crypt atrophy (2). The presence of edema, hyperemia and crypt abscess was scored with one additional point in each case. The scores for each criterion were added into a total score ranging from 0 to 12. Images were taken with a Zeiss AxioVert 40 CFL camera. Figures show representa-tive longitudinal sections in original magnification. In Adobe Photoshop CS6 a tonal correction was applied to enhance contrasts within the pictures.
RNA analysis
RNA extraction and cDNA synthesis
Approximately 1 cm from distal parts of the colon was homogenized by using a TissueLyser LT (Qiagen, Hilden, Germany) and total RNA was extracted according to the manufacturer’s instruction using RNeasy Plus Universal Mini Kit (Qiagen, Hilden, Germany) and Chloroform (Sigma-Aldrich, St. Louis, MO, USA). No further treat-ment with DNase was needed since gDNA Eliminator Solution was included in the kit.
Five microgram of total RNA were used for cDNA synthesis. Reverse transcription was performed using a Mastercycler gradient (Eppendorf, Hamburg, Germany) using QuantiNova Reverse Transcription Kit (Qiagen, Hilden, Germany). Between 10 pg and 100 ng were used according to the TaqMan Fast Advanced Master Mix protocol (Thermo Fisher Scientific, Waltham, MA, USA).
RNA and cDNA purity determined by Nanodrop 2000 spectrophotometry (Thermo Fisher Scientific, Waltham, MA, USA).
Quantitative real‑time PCR
Quantitative real-time PCR was performed accord-ing to the TaqMan Fast Advanced Master Mix proto-col (Thermo Fisher Scientific, Waltham, MA, USA) according to the Applied Biosystems StepOnePlus real-time PCR system (Thermo Fisher Scientific, Waltham, MA, USA). included The following primers were used: The housekeeping genes GAPDH (Mm99999915_ g1) and GUSB (Mm00446953_m1) as well as TGFβ (Mm01178820_m1), HGF (Hs04329698_m1), CCL17 (Mm01244826_g1), IFNγ (Hs00989291_m1) and TNFα (HS01113624_g1) (Single Tube TaqMan Gene Expression Assays, Thermo Fisher Scientific, Waltham, MA, USA). The analysis was performed using StepOnePlus™ Soft-ware v2.3.
The mean cycle threshold (CT) value was calculated for the housekeeping genes. Relative expression values for the analyzed genes were then calculated as the difference
between the mean cycle threshold (CT) of the house-keeping genes and the analyzed gene (delta CT) and depicted as the logarithmic value.
RNAseq analysis
RNAseq and bioinformatic analyses were performed by IMGM Laboratories GmbH, Martinsried, Germany. RNA sequencing was performed on the Illumina TruSeq 500 next generations sequencing system and its high output mode with 1 × 75 bp single-end read chemistry. For all samples, the most recent mouse reference genome (mus musculus GRCm38.p3 C57BL/6, source: NCBI) as well as the most recent human reference genome hg19 (homo sapiens, GRCh 37.p5, source NCBI) were combined and used as reference sequence for mapping. Expression val-ues were processed to total exon read count/mapped reads [million] * exon length [kb] (RPKM). The compari-son of the control versus ethanol challenged group was based on the ‘total exon reads’ expression values and was analyzed statistically by the CLC Genomics Workbench tool ‘empirical analysis of DGE (EDGE)’. For comparison of the groups, the ‘Exact Test’ was used.
For analyzing differences in expression value of mouse genes a feature was classified as induced/repressed in a specific comparison if its FDR-corrected p value is ≤ 0.05 and if it has a fold change value ≥ 2/≤ 2.
For analyzing differences in expression value of human genes, a feature is classified as induced/repressed in a specific comparison if its non-corrected p value is ≤ 0.05.
Statistics
Statistical analysis was performed with R: a language and environment for statistical computing (R Foundation for Statistical Computing, Vienna, Austria. URL https:// www.R-project.org/) and BRB Array Tools (https://brb. nci.nih.gov/BRB-ArrayTools/). Variables were repre-sented with mean, standard deviation, median, and IQR values. To compare binary groups A two-sided Student’s t test and a confidence level = 0.95 was used. If more than, two groups were analyzed ANOVA followed by Tukey HSD was conducted. Spearman correlation analysis was performed.
Results
Challenge with ethanol predominantly affects monocytes and macrophages in the NSG‑UC mouse model
the other was challenged by rectal application of ethanol. The groups contained four to six animals. Upon challenge with ethanol mice stools became soft or liquid, the ani-mals lost weight, and the activity was reduced. Control animals displayed hardly any symptoms. Symptoms were
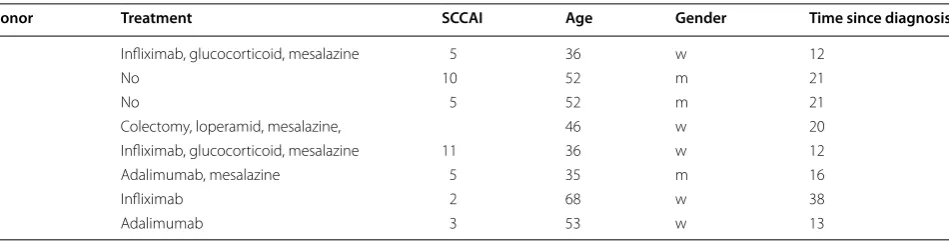
classified according to a clinical score described in “ Meth-ods”. Upon challenge, the clinical score increased sig-nificantly (Fig. 1C), (for complete data set see Additional file 1: Table S3). Macroscopic inspection of colons cor-roborated the data obtained from analyzing the clinical Table 1 Patient baseline characteristics
Donor Treatment SCCAI Age Gender Time since diagnosis
1 Infliximab, glucocorticoid, mesalazine 5 36 w 12
2 No 10 52 m 21
3 No 5 52 m 21
4 Colectomy, loperamid, mesalazine, 46 w 20
5 Infliximab, glucocorticoid, mesalazine 11 36 w 12
6 Adalimumab, mesalazine 5 35 m 16
7 Infliximab 2 68 w 38
8 Adalimumab 3 53 w 13
Fig. 1 NSG mice reconstituted with PBMC from UC donors develop UC like symptoms and phenotype upon challenge with ethanol. A Macropho-tographs of colons at autopsy of NSG-UC mice. a Unchallenged control group (control). b Group challenged with 10% ethanol at day 8, and 50% ethanol at days 15 and 18 (ethanol). B Photomicrographs of H&E-stained sections of distal parts of the colon from mice that had been challenged a
[image:5.595.62.537.100.221.2] [image:5.595.60.540.318.650.2]score. The ethanol challenged mice were characterized by soft or absent pellets and dilated colons (Fig. 1A). Histo-logical analysis revealed the influx of a mixed infiltrate of leukocytes, edema, crypt loss, and changes in the colon architecture (Fig. 1B). To further analyze the inflamma-tion human leukocytes were isolated from the spleen and subjected to flow cytometric analysis. Although we would identify donor dependent patterns on subjects of T-cells and B-cells (data not shown) the most donor independ-ent effects were observed in macrophages and monocytes and subtypes thereof (Fig. 2a). Thus, we would define CD14+ monocytes expressing CD64, CD163, CD206 or CD1a and CD11b+ macrophages expressing CD1a as the most significant cell types associated with inflammation in the NSG-UC model. We did not observe increased maturation of macrophages and monocytes as indicated by similar levels of CD86 expressing macrophages and monocytes. Effects on subsets of T-cells were donor dependent and could not be described as generally affected by challenge, however, we could observe a cor-relation of effector memory CD8+ cells with the clinical activity score (rho = 0.4, p = 0.02) and with Th17 CD4+
T-cells (rho = 0.4, p = 0.015), indicating that both cell types might be involved in the development of symptoms and phenotype (Fig. 2b). mRNA expression analysis by RT PCR from RNA isolated from distal parts of the colon revealed that TARC, TGFß1, and HGF were the markers most reliably associated with inflammation. IFNγ levels could not be detected in all samples and displayed high variability (Fig. 2c).
RNA expression analysis
To gain a better understanding of the epithelial triggers eliciting the immunological responses in the NSG-UC mouse model in response to challenge with ethanol, an RNAseq analysis was performed with tissue samples isolated from distal parts of the colon. For reconstitu-tion, a donor was selected who exhibited a simple clini-cal activity score index (SCCAI) [35] of 5. Reconstitution and challenge was performed according to the standard protocol. Following reconstitution, mice were sepa-rated into two groups: the control group (control) and
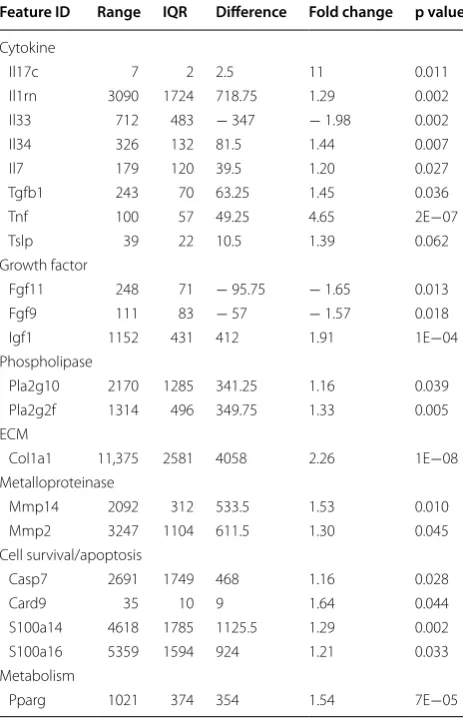
the ethanol challenged group (ethanol). Each group contained four animals. Upon challenge with ethanol the ethanol group developed a clinical activity score of 5 ± 2.9, (mean ± S.D.) and a histological score of 6.25 ± 2.2, whereas the control group developed hardly any symptoms and phenotype as indicated by a clini-cal activity score of 1.5 ± 1.3 and a histological score of 1.5 ± 0.6. Table 2 shows a selection of prominent pro-teins whose expression was significantly changed upon challenge with ethanol (complete analysis will be made accessible online). Unexpectedly, expression of IL-33 was decreased by a factor of almost 2, whereas expres-sion of IL-34 was significantly increased. Expresexpres-sion of IL-17c was also increased by a factor of 11, although the original values were much lower as compared to IL-33 and IL-34. Expression of TSLP was increased by a fac-tor 1.39. As previously shown TGFß1 was elevated by a factor of 1.45 in response to ethanol and in this experi-ment TNFa seemed to be a major proinflammatory cytokine. No expression of hIFNγ could be detected in this experiment a result which was also confirmed by RT-PCR analysis (data not shown). Unexpectedly, an antagonist of IL-1b, IL-1rn was significantly expressed and elevated in response to ethanol (fold change = 1.39). The inflammation induced by ethanol was also charac-terized by the typical inflammatory markers of variants of phospholipases A2 Pla2g10 and Pla2g2f which were elevated 1.16 and 1.33 fold, respectively and metallopro-teinases Mmp14 and 2 which were elevated by a factor of 1.53 and 1.3, respectively. Challenge with ethanol also affected cell survival and apoptosis as indicated by ele-vated expression of Casp7 (1.16 fold change), Card9 (1.64 fold change), S100a14 (1.29 fold change) and S11a16 (1.21 fold change). Furthermore, challenge with etha-nol induced the expression of Pparg, indicating a strong metabolic effect. In this experiment, the growth factors affected by ethanol were fibroblast growth factor (FGF) 11 and 9 and insulin growth factor (IGF) 1, whereas HGF was expressed, but expression was not induced (data not shown). The observed fibrosis was confirmed by induced expression of collagen (col) 1a1, which was elevated 2.26 fold. In summary, expression analysis suggests that
(See figure on next page.)
Fig. 2 Inflammation induced by ethanol in NSG mice reconstituted with PBMC from UC patients is characterized by subtypes of monocytes, mac-rophages, effector memory CD8+ cells and by Mtarc, mTGFß1 and HGF. a Flow cytometric analysis of subtypes of CD14+ monocytes and CD11b+
IL-34 is the main cytokine released by epithelial cells to induce proliferation and differentiation of monocytes and macrophages. This result is in agreement with the previ-ous observations showing that the predominant effect of ethanol challenge was observed with monocytes and macrophages.
Design of disease network
Based on the results obtained from the RNAseq analysis and the effects of interleukins, chemokines and growth factors described in the literature, a disease network was designed that might lead to a better understanding of inflammatory processes in the NSG-UC model (Fig. 3). Whereas IL-7 is a general activator of T cells (Fig. 4), IL-17c might be responsible for a proinflammatory response resulting in increased levels of IL-8, IL-6 and IL-17A ultimately leading to increased mucus production and attraction of neutrophils (Fig. 5). Lipids released by PLA2 and presented by CD1a expressing monocytes and mac-rophages might induce autoimmunity by activation Th1 (our own results) or Th22 cells (Fig. 6) [6–8]. The inflam-matory remodeling condition would be the result of the Th2 driven inflammation induced by IL-34, TSLP and TARC (Figs. 7, 8, 9). In UC patients, this inflammatory condition might be responsible for fibrosis and epithelial hyperplasia. It is noteworthy that levels of IL-33 which has been shown to play a crucial role in atopic derma-titis [16] are decreased indicating that ILC2 might not be drivers of the remodeling condition in the NSG-UC (Fig. 10).
As previously suggested, this disease network shows two arms of inflammation evoked upon damage of the mucosa: A Th1/M1 Tcyt characterized inflammation, which we would refer to as acute inflammatory, and a Th2/M2 Treg characterized inflammation, which we pre-viously referred to as the remodeling condition. A patient in relapse would most probably exhibit both arms of inflammation.
Validation of the disease network in the NSG mouse model
[image:8.595.57.289.114.476.2]To examine whether the NSG-UC model can be used to validate the disease map, two therapeutics were tested, which were expected to target crucial immunological junctions. PBMC were isolated from patients in relapse. NSG mice were reconstituted and challenged according to a standard protocol described in “Methods”. Seven days post reconstitution the mice were divided into three groups: one was left unchallenged, one was challenged by rectal application of ethanol plus the respective car-rier, one was challenged and additionally treated with the respective therapeutic. Each group contained four animals. Experiments were repeated with two differ-ent donors in relapse (SCCAI > 5) (for patidiffer-ents baseline demographics see Table 1). The response to treatment was compared to the control group and the ethanol Table 2 Challenge with ethanol resulted in increased
expression gene associated with inflammation
Sections from distal parts of the colon of NSD mice reconstituted with PBMC derived from a patient with UC were challenged with ethanol and subjected to RNAseq analysis. Unchallenged control (control, n = 4), group challenged with 10% ethanol at day 8, and 50% ethanol at days 15 and 18 (ethanol, n = 4). Expression values are depicted as mean total exon read count/mapped reads [million] * exon length [kb] (RPKM). The difference between the highest and the lowest expression value over all samples (range), inter-quantile rage of expression values (IQR), difference between the mean of expression values of the ethanol challenged group and the control group, mean expression value of ethanol challenged group divided by the mean expression value of the control group, FDR corrected p value (EDGE test) (p value)
Feature ID Range IQR Difference Fold change p value
Cytokine
Il17c 7 2 2.5 11 0.011
Il1rn 3090 1724 718.75 1.29 0.002 Il33 712 483 − 347 − 1.98 0.002
Il34 326 132 81.5 1.44 0.007
Il7 179 120 39.5 1.20 0.027
Tgfb1 243 70 63.25 1.45 0.036
Tnf 100 57 49.25 4.65 2E−07
Tslp 39 22 10.5 1.39 0.062
Growth factor
Fgf11 248 71 − 95.75 − 1.65 0.013 Fgf9 111 83 − 57 − 1.57 0.018 Igf1 1152 431 412 1.91 1E−04 Phospholipase
Pla2g10 2170 1285 341.25 1.16 0.039 Pla2g2f 1314 496 349.75 1.33 0.005 ECM
Col1a1 11,375 2581 4058 2.26 1E−08 Metalloproteinase
Mmp14 2092 312 533.5 1.53 0.010 Mmp2 3247 1104 611.5 1.30 0.045 Cell survival/apoptosis
Casp7 2691 1749 468 1.16 0.028
Card9 35 10 9 1.64 0.044
S100a14 4618 1785 1125.5 1.29 0.002 S100a16 5359 1594 924 1.21 0.033 Metabolism
challenged group (for complete data set, please see Addi-tional file 1: Tables S4, S5). As observed in previous exper-iments control animals remained unaffected, whereas in all ethanol-challenged groups mice developed the previ-ously described symptoms and phenotype [11]. At first, infliximab was tested, which is supposed to suppress the acute arm of inflammation by depletion of TNFα bear-ing M1 monocytes. However, as suggested by the analy-sis of inflammatory profiles of human UC patients and as predicted by the disease network (Fig. 11) one would expect that in mice the remodeling inflammation would be retained. As shown in Fig. 13B mice benefited from
the treatment indicated by the clinical- and histologi-cal score. Analysis of the histologihistologi-cal sections revealed, however, fibrotic alterations of the colon architecture (Fig. 13Aa). The previously identified acute inflamma-tory markers CD11b+ CD1a+, CD14+ CD1a+, CD14+
CD64+, TARC, HGF and IFNγ diminished, whereas
expression of TGFß1 was not affected, corroborating the histological results (Figs. 14, 15). Infliximab treatment also affected M2 monocytes as indicated by a decrease of CD14+ CD163+ monocytes, suggesting that the
fibrotic changes not solely rely on M2 monocytes. These results corroborated results from a previous study which
[image:9.595.63.539.87.421.2]has shown that treatment of patients with infliximab induces inflammatory remodeling condition [4]. Next, we tested a therapeutic targeting monocytes bearing the IL-4 Rα receptor, which is supposed to be predominantly expressed on M2 monocytes and Th2 cells. Pitrakinra, which has been described as an inhibitor of IL-4Rα/ IL-2Rγ and IL-4Rα/IL-13Rα1 receptor complexes is thus supposed to inhibit Th2/M2 directed inflammation with-out suppressing the Th1/M1. According to the disease
network, one would expect that NSG-UC mice would not benefit from the treatment with pitrakinra (Fig. 12). His-tological analysis of H&E stained revealed severe damage to the colon architecture and influx of inflammatory cells (Fig. 13Ab). As shown in Fig. 13B, the clinical- and the histological score increased as well as the inflammatory markers CD11b+ CD1a+ and IFNγ (Figs. 14, 15) (for
complete data set see Additional file 1). Mice also exhib-ited increased expression of TNFα, suggesting that the
[image:10.595.63.539.87.420.2]inflammatory balance is shifted towards a Th1 response. The fact that levels of TGFß1 and frequencies of CD14+
CD163+ monocytes were decreased supported the
hypothesis that the remodeling arm of the inflammation was suppressed in favor of the acute inflammation. How-ever, frequencies of CD14+ CD1a+, CD14+ CD64+,
CD14+ TSLPR+ monocytes were also affected,
suggest-ing that IL-4Rα receptor is more widely expressed fur-ther corroborating the plasticity of monocytes but also
suggested that suppressing IL4-Rα1 bearing monocytes is not sufficient to suppress symptoms and phenotype.
Discussion
By now, the NSG-UC model has been proven as a robust animal model partially reflective of the human disease. Although it has not yet been shown how the toxic effects of ethanol translate into inflammation, we hypothesized that ethanol damages the mucosal epithelial lining and
[image:11.595.57.540.87.420.2]thereby induces the release of cytokines, chemokines and growth factors to counteract the potential harm accom-panying the breach of the epithelial lining. The ultimate goal of the inflammatory process would thus be to defend the organisms against invading pathogens and the resto-ration of barrier integrity. Hence, the inflammation in the NSG-UC model would partially resemble a wound heal-ing process. Wound healheal-ing processes are characterized by an influx of neutrophils, macrophages, and mono-cytes. According to a new concept, macrophages are con-sidered accessory cell types which support their client cells—notabene mucosal epithelial cells in the gut- with various functions [36]. Clearance of apoptotic cells is one
[image:12.595.57.539.87.420.2]macrophages as cell types associated with the ethanol-induced inflammation. Frequencies of all these cells types were highly correlated with the clinical activity-and his-tological score, however, this observation does not nec-essarily mean that these cell types cause or add to the pathology and phenotype of colitis like symptoms as M2 monocytes, e.g. are instrumental in controlling inflam-mation. Challenge with ethanol did not induce further
maturation of macrophages and monocytes as indicated by even levels of CD11b+ CD86+ macrophages and
CD14+ CD86+ monocytes in the unchallenged versus
the challenged groups. In addition to macrophages and monocytes, a positive correlation was detected between effector memory CD8+ cells and the clinical score,
cor-roborating previous results where CD44+ experienced
T-cells were found to be elevated in the spleen as well as
[image:13.595.57.539.87.420.2]the colon of NSG-UC mice. This observation suggests that the onset of epithelial damage and inflammation might also be caused by cytotoxic T-cells. Furthermore, frequencies of effector memory CD8+ cells
corre-lated positively with Th17 T-cells, suggesting that these cells also play a role in this inflammation. These results are in agreement with data obtained from UC patients where aberrant expression of circulating Th17, Th1 and cytotoxic T-cells was found in patients with UC [5]. The most reliable factors associated with the inflammation were the chemokine TARC, the cytokine TGFß1 and the growth factor HGF, all of which are considered hallmarks
of wound healing processes [37]. The extent of inflam-mation was donor-dependent. Patients visiting our clinic are in most cases severely diseased and experience a chronic continuous form of the disease. A previous study has shown (our data) that the majority of these patients exhibit high level-expression of autoantibodies directed against immune cells indicating that loss or breach of tolerance may be one driver in UC. This observation was further corroborated by the detection of elevated levels of antigen experienced CD44 expressing CD8+ cells colons
of UC patients as compared to Non-UC donors [4]. This observation might explain why the NSG-UC model
[image:14.595.56.540.87.419.2]requires PBMC from UC patients [11] and the positive correlation of CD8+ effector memory T-cells with the
clinical score. NSG mice reconstituted with PBMC from healthy subjects did not experience colitis like symptoms and phenotype in response to ethanol.
As the previously analyzed factors expressed in the colon of NSG mice were selected by the wound heal-ing hypothesis and hence the selection had a bias, an RNAseq analysis was performed. This analysis identified IL-7, IL-17c, IL-34 and TSLP as elevated upon challenge with ethanol all of which are expressed by epithelial cells. Whereas IL-7 is a general activator of T-cells, IL-17c is
considered to promote inflammation [12–14]. In con-trast, IL-34 and TSLP are thought to favor a remodeling of the colon architecture [18, 23, 24]. Also, phospholipase A2 was found to be elevated, suggesting that lipids pre-sented by CD1a might also provoke inflammation. Rather unexpectedly, IL-33 levels were found to be decreased, indicating that a prominent route leading to remodeling is lacking in this model. Based on these results, the RT-PCR analysis from distal parts of the colon and mode of action of various cell types, chemokines, cytokines and factors described in the literature a disease network was designed. Highlighting various routes of inflammation
[image:15.595.57.541.87.422.2]induced by different cytokines, chemokines and lipids corroborated the previous findings that at least two inflammatory conditions prevail: a proinflammatory or acute condition and a remodeling condition. In a healthy organism, the acute inflammatory condition would ensure the protection against invading pathogens. In UC patients, the cause of the proinflammatory condition still remains to be elucidated. One possible explanation is that a breach of the epithelial lining leads to influx of bacteria into the mucosa. Alternatively, a general loss of tolerance towards the microbiota and the self-antigens might shift the intestinal immunological equilibrium.
[image:16.595.56.540.87.420.2]Our results suggest that there could be at least two driv-ers of the acute inflammatory process: IL-17c and CD1a expressing monocytes. In wound healing processes this equilibrium would be regained by restoring the integ-rity of the epithelial barrier and by mechanism to resolve inflammation. Our observations suggest that fibrosis in UC patients is the result of an ongoing restoration pro-cess to heal the destruction induced by the proinflamma-tory response. To understand the disturbed inflammaproinflamma-tory balance future research has to examine why some UC patients have the capacity to control inflammation and experience times of remission while others do not.
Both types of inflammation would be expected to be induced upon challenge with ethanol in the NSG-UC mouse model. To validate this disease network, two dif-ferent therapeutic to affect M1 or M2 macrophages were tested in the NSG-UC model. In a previous study, inflixi-mab had been shown to induce a remodeling condition in UC patients [4]. The responses to infliximab in the NSG-UC model partially reflected this condition. Mice responded to treatment with decreased clinical activity and decreased frequencies of CD14+ monocytes,
sug-gesting that not only M1 monocytes bear surface TNFα. Factors associated with inflammation such as TARC-, HGF- and INFγ mRNA decreased, whereas TGFß1
mRNA levels were not affected, suggesting an ongoing remodeling of the colon. This observation was corrobo-rated by histological analysis that displayed less influx of inflammatory cells but retained fibrosis. Pitrakinra is also supposed to act on monocytes; in this case, how-ever, monocytes bearing the IL-4Rα/IL-13Rα1 receptor complex would be targeted. Also, pitrakinra has been shown to suppress the differentiation of Th2 cells which carry the IL4-Rα/IL2Rγ chain. As observed when mice were treated with infliximab all subtypes of monocytes were affected, in this case, however, an increase of the CD1a expressing CD11b+ macrophage was observed.
[image:17.595.58.541.85.422.2]The increased clinical- and histological score increased
levels of IFNγ and TNFα suggested that inflammation was completely shifted towards a Th1 phenotype, sup-pressing the remodeling arm of the inflammation.
Obviously, the disease network presented in this study is still too simple to completely describe the inflamma-tory dynamic underlying the pathology of UC. It does not yet include important aspects promoting inflam-mation as the role of B-cells, mast cells, basophils and eosinophils and the high plasticity of T-cells. It also does not yet account for concentration levels of cytokines, chemokines and growth factors and their cognate
[image:18.595.57.541.85.421.2]receptors. Hence, it is a first approach to portray inflam-mation in UC as a mobilée, in which the entire balance can be shifted when single cell types are depleted or pro-moted. It also suggests that it is not as simple to frame a certain cell type or cytokine to cause pathology based on the mere fact that frequencies or levels are elevated. Our model might explain why anrukinzumab, an anti-IL-13 monoclonal antibody was found to not affect clinical activity score, mucosal healing, rectal bleeding or clinical remission rates [38]. Conversely, it might explain why inf-liximab is contraindicated in patients with stenosis. Thus,
Fig. 12 Design of disease network based on mRNA expression analysis and effects of cytokines, chemokines and growth factors described in the literature. Blockade of IL-4Rα1 receptor leads to inhibition of the remodeling pathway and promotes the proinflammatory pathway
(See figure on next page.)
every therapeutic can shift the balance and might have to be complemented with another therapeutic to reach full response. In the future, more comprehensive studies have to be performed to improve our knowledge of disease networks and the dynamics underlying inflammation in UC.
Obviously, the inadequacy to fully reflect the human disease also applies to the NSG-UC model. So far, it
disregards the influence of basophils, mast cells, and eosinophils. Also, one has to keep in mind that it is a chimeric model and that some of the chemokines and cytokines do not exert their activity on receptors of the other species as it has been shown for IL-4 and TSLP [39,
[image:20.595.57.540.85.526.2]40]. Thus, this model has to be improved in future studies to analyze the involvement of T-cells, B-cells basophils, eosinophils and mast cells. However, it seems to reflect
Fig. 15 Treatment infliximab or pitrakinra had different effects in NSG mice reconstituted with PBMC from UC patients. mRNA expression levels of TGFß1, HGF, TARC, IFNγ and TNFa as boxplots. Mice were treated as described in Fig. 13. For complete data set see Additional file 1: Tables S4, S5). Lg-delta CT, logarithmic delta cycle threshold. Boxes represent upper and lower quartiles, whiskers represent vari-ability and outliers are plotted as individual points. Unchallenged control (control), challenged control (ethanol + PBS/isotype), chal-lenged and treated (ethanol + infliximab/pitrakinra). For comparison of groups ANOVA followed by TukeyHSD was conducted. Labels given on x- and y-axes on the bottom and the side row apply to all charts
◂
the autoimmune aspect of the disease and can be used to validate therapeutics and hypothesis.
Conclusions
The combination of patient profiling, the design of a dis-ease network helps and the NSG-UC animal model may help to get a better understanding of the inflammatory processes in UC and may ultimately lead to individual-ized and phase dependent therapies.
Abbreviations
Card: caspase recruitment domain-containing protein; Casp: caspase; Col: collagen; CCR: chemokine receptor; FELASA: Federation of Laboratory Animal Science Association; FGF: fibroblast growth factor; HGF: hepatic growth factor; IFN: interferon; IGF: insulin growth factor; IL: interleukin; Mmp: matrix metallo protease; NSG: NOD-SCID IL2rγnull; NSG-UC: NOD-SCID IL2rγnull reconstituted with PBMC from UC patients; PBMC: peripheral blood mononuclear cells; PBS: phosphate buffered saline; PLA2: phospholipase A2; Pparg: peroxisome proliferator-activated receptor gamma; RPKM: total exon read count; SCCAI: simple clinical activity score index; TARC: thymus and activation regulated chemokine; TGFß: tumor growth factor; Th: T helper cell; TNF: tumor necrosis factor; Treg: regulatory T cell; TSLP: thymic stromal lymphopoietin; TSLPR: thymic stromal lymphopoietin receptor.
Authors’ contributions
HJ, PP, acquired data. RG, EW, MS have performed the study concept and design. TM provided pitrakinra. FB recruited patients, patient history, RG, HJ analyzed and interpreted the data. RG and MS wrote the manuscript. All authors read and approved the final manuscript.
Author details
1 Institute of Molecular Animal Breeding and Biotechnology and Labora-tory for Functional Genome Analysis (LAFUGA), Gene Center, LMU Munich, 81377 Munich, Germany. 2 Department of General- Visceral-, and Trans-plantation Surgery, Hospital of the University of Munich, Nussbaumstr. 20, 80336 Munich, Germany. 3 Department of Medicine II-Grosshadern, Additional file
Ludwig-Maximilians-University (LMU), Marchioninistr. 15, 81377 Munich, Germany. 4 Julius von Sachs Institute, University of Würzburg, 97082 Würzburg, Germany. 5 Present Address: Department of Medicinal Microbiology, Max von Pettenkofer Institute, 80336 Munich, Germany.
Acknowledgements
Our special thanks goes to the donors without their commitment this work could not have been possible. We thank Janina Caesar for excellent technical support and Simone Breiteneicher for her excellent support and assistance in recruiting patients. We thank the team in the animal facility for their excellent work and their enduring friendliness in stressful situations.
Competing interests
The authors declare that they have no competing interests.
Availability of data and materials
Total data set of RNAseq analysis will be archived at available at http://www. klinikum.uni-muenchen.de/Klinik-fuer-Allgemeine-Viszeral-Transplantations-Gefaess-und-Thorax-Chirurgie/de/0700-forschung/ILREMU/index.html.
Consent of publication
Not applicable.
Ethics approval and consent to participate
All donors gave informed written consent and the study was approved by the Institutional Review Board (IRB) of the Medical Faculty at the University of Munich (2015-22).
Animal studies were approved by the ethics committee of the govern-ment of Upper Bavaria, Germany (65-11 and 55.2-1-54-2532-76-15) and performed in compliance with German Animal Welfare Laws.
Funding
This work was funded by the Bundesministerium für Bildung und Forschung (Grant Number 03V0558).
Publisher’s Note
Springer Nature remains neutral with regard to jurisdictional claims in pub-lished maps and institutional affiliations.
Received: 7 July 2017 Accepted: 15 December 2017
References
1. Jovanovic K, Siebeck M, Gropp R. The route to pathologies in chronic inflammatory diseases characterized by T helper type 2 immune cells. Clin Exp Immunol. 2014;178:201–11.
2. Fuss IJ, Strober W. The role of IL-13 and NK T cells in experimental and human ulcerative colitis. Mucosal Immunol. 2008;1(Suppl 1):S31–3. 3. Heller F, Florian P, Bojarski C, Richter J, Christ M, Hillenbrand B, Mankertz
J, Gitter AH, Burgel N, Fromm M, et al. Interleukin-13 is the key effector Th2 cytokine in ulcerative colitis that affects epithelial tight junctions, apoptosis, and cell restitution. Gastroenterology. 2005;129:550–64. 4. Fohlinger M, Palamides P, Mansmann U, Beigel F, Siebeck M, Gropp R.
Immunological profiling of patients with ulcerative colitis leads to identi-fication of two inflammatory conditions and CD1a as a disease marker. J Transl Med. 2016;14:310.
5. Dong Z, Du L, Xu X, Yang Y, Wang H, Qu A, Qu X, Wang C. Aberrant expression of circulating Th17, Th1 and Tc1 cells in patients with active and inactive ulcerative colitis. Int J Mol Med. 2013;31:989–97. 6. Birkinshaw RW, Pellicci DG, Cheng TY, Keller AN, Sandoval-Romero M,
Gras S, de Jong A, Uldrich AP, Moody DB, Godfrey DI, Rossjohn J. alpha-beta T cell antigen receptor recognition of CD1a presenting self lipid ligands. Nat Immunol. 2015;16:258–66.
7. Cernadas M, Lu J, Watts G, Brenner MB. CD1a expression defines an interleukin-12 producing population of human dendritic cells. Clin Exp Immunol. 2009;155:523–33.
8. de Jong A, Pena-Cruz V, Cheng TY, Clark RA, Van Rhijn I, Moody DB. CD1a-autoreactive T cells are a normal component of the human alphabeta T cell repertoire. Nat Immunol. 2010;11:1102–9.
9. Harbour SN, Maynard CL, Zindl CL, Schoeb TR, Weaver CT. Th17 cells give rise to Th1 cells that are required for the pathogenesis of colitis. Proc Natl Acad Sci USA. 2015;112:7061–6.
10. Geginat J, Paroni M, Kastirr I, Larghi P, Pagani M, Abrignani S. Reverse plasticity: TGF-beta and IL-6 induce Th1-to-Th17-cell transdifferentiation in the gut. Eur J Immunol. 2016;46:2306–10.
11. Palamides P, Jodeleit H, Fohlinger M, Beigel F, Herbach N, Mueller T, Wolf E, Siebeck M, Gropp R. A mouse model for ulcerative colitis based on NOD-scid IL2R γnull mice reconstituted with peripheral blood mononu-clear cells from affected individuals. Dis Model Mech. 2016;9:985–97. 12. Mackall CL, Fry TJ, Gress RE. Harnessing the biology of IL-7 for therapeutic
application. Nat Rev Immunol. 2011;11:330–42.
13. Chang SH, Reynolds JM, Pappu BP, Chen G, Martinez GJ, Dong C. Interleukin-17C promotes Th17 cell responses and autoimmune disease via interleukin-17 receptor E. Immunity. 2011;35:611–21.
14. Kolls JK, Linden A. Interleukin-17 family members and inflammation. Immunity. 2004;21:467–76.
15. Diller ML, Kudchadkar RR, Delman KA, Lawson DH, Ford ML. Balancing inflammation: the link between Th17 and regulatory T cells. Mediat Inflamm. 2016;2016:6309219.
16. Salimi M, Barlow JL, Saunders SP, Xue L, Gutowska-Owsiak D, Wang X, Huang LC, Johnson D, Scanlon ST, McKenzie AN, et al. A role for IL-25 and IL-33-driven type-2 innate lymphoid cells in atopic dermatitis. J Exp Med. 2013;210:2939–50.
17. Park KS, Korfhagen TR, Bruno MD, Kitzmiller JA, Wan H, Wert SE, Khurana Hershey GK, Chen G, Whitsett JA. SPDEF regulates goblet cell hyperplasia in the airway epithelium. J Clin Investig. 2007;117:978–88.
18. Foucher ED, Blanchard S, Preisser L, Garo E, Ifrah N, Guardiola P, Delneste Y, Jeannin P. IL-34 induces the differentiation of human monocytes into immunosuppressive macrophages. Antagonistic effects of GM-CSF and IFNgamma. PLoS ONE. 2013;8:e56045.
19. Ferrante CJ, Leibovich SJ. Regulation of macrophage polarization and wound healing. Adv Wound Care (New Rochelle). 2012;1:10–6. 20. Park JH, Jeong DY, Peyrin-Biroulet L, Eisenhut M, Shin JI. Insight into
the role of TSLP in inflammatory bowel diseases. Autoimmun Rev. 2016;16:55–63.
21. Soumelis V, Reche PA, Kanzler H, Yuan W, Edward G, Homey B, Gilliet M, Ho S, Antonenko S, Lauerma A, et al. Human epithelial cells trigger dendritic cell-mediated allergic inflammation by producing TSLP. Nat Immunol. 2002;3:673–80.
22. Ito T, Liu YJ, Arima K. Cellular and molecular mechanisms of TSLP function in human allergic disorders—TSLP programs the “Th2 code” in dendritic cells. Allergol Int. 2012;61:35–43.
23. Ito T, Wang YH, Duramad O, Hori T, Delespesse GJ, Watanabe N, Qin FX, Yao Z, Cao W, Liu YJ. TSLP-activated dendritic cells induce an inflam-matory T helper type 2 cell response through OX40 ligand. J Exp Med. 2005;202:1213–23.
24. Han H, Headley MB, Xu W, Comeau MR, Zhou B, Ziegler SF. Thymic stro-mal lymphopoietin amplifies the differentiation of alternatively activated macrophages. J Immunol. 2013;190:904–12.
25. Oh MH, Oh SY, Yu J, Myers AC, Leonard WJ, Liu YJ, Zhu Z, Zheng T. IL-13 induces skin fibrosis in atopic dermatitis by thymic stromal lymphopoi-etin. J Immunol. 2011;186:7232–42.
26. Gear AR, Camerini D. Platelet chemokines and chemokine receptors: linking hemostasis, inflammation, and host defense. Microcirculation. 2003;10:335–50.
27. Saeki H, Tamaki K. Thymus and activation regulated chemokine (TARC)/ CCL17 and skin diseases. J Dermatol Sci. 2006;43:75–84.
28. Tamaki K, Kakinuma T, Saeki H, Horikawa T, Kataoka Y, Fujisawa T, Sato S, Takehara K, Nakahara T, Fukagawa S, Furue M. Serum levels of CCL17/ TARC in various skin diseases. J Dermatol. 2006;33:300–2.
29. Sugiyama D, Nishikawa H, Maeda Y, Nishioka M, Tanemura A, Katayama I, Ezoe S, Kanakura Y, Sato E, Fukumori Y, et al. Anti-CCR4 mAb selec-tively depletes effector-type FoxP3+ CD4+ regulatory T cells, evok-ing antitumor immune responses in humans. Proc Natl Acad Sci USA. 2013;110:17945–50.
• We accept pre-submission inquiries
• Our selector tool helps you to find the most relevant journal
• We provide round the clock customer support
• Convenient online submission
• Thorough peer review
• Inclusion in PubMed and all major indexing services
• Maximum visibility for your research
Submit your manuscript at www.biomedcentral.com/submit
Submit your next manuscript to BioMed Central
and we will help you at every step:
recognize natural skin oils that function as headless antigens. Nat Immu-nol. 2014;15:177–85.
31. Wolk K, Kunz S, Witte E, Friedrich M, Asadullah K, Sabat R. IL-22 increases the innate immunity of tissues. Immunity. 2004;21:241–54.
32. Chang CC, Wright A, Punnonen J. Monocyte-derived CD1a+ and CD1a− dendritic cell subsets differ in their cytokine production profiles, susceptibilities to transfection, and capacities to direct Th cell differentia-tion. J Immunol. 2000;165:3584–91.
33. Bourgeois EA, Subramaniam S, Cheng TY, De Jong A, Layre E, Ly D, Salimi M, Legaspi A, Modlin RL, Salio M, et al. Bee venom processes human skin lipids for presentation by CD1a. J Exp Med. 2015;212:149–63.
34. Zadeh-Khorasani M, Nolte T, Mueller TD, Pechlivanis M, Rueff F, Wollen-berg A, Fricker G, Wolf E, Siebeck M, Gropp R. NOD-scid IL2R gammanull mice engrafted with human peripheral blood mononuclear cells as a model to test therapeutics targeting human signaling pathways. J Transl Med. 2013;11:4.
35. Walmsley RS, Ayres RC, Pounder RE, Allan RN. A simple clinical colitis activity index. Gut. 1998;43:29–32.
36. Okabe Y, Medzhitov R. Tissue biology perspective on macrophages. Nat Immunol. 2015;17:9–17.
37. Werner S, Grose R. Regulation of wound healing by growth factors and cytokines. Physiol Rev. 2003;83:835–70.
38. Reinisch W, Panes J, Khurana S, Toth G, Hua F, Comer GM, Hinz M, Page K, O’Toole M, Moorehead TM, et al. Anrukinzumab, an anti-interleukin 13 monoclonal antibody, in active UC: efficacy and safety from a phase IIa randomised multicentre study. Gut. 2015;64:894–900.
39. Francis OL, Milford TA, Martinez SR, Baez I, Coats JS, Mayagoitia K, Concep-cion KR, Ginelli E, Beldiman C, Benitez A, et al. A novel xenograft model to study the role of TSLP-induced CRLF2 signals in normal and malignant human B lymphopoiesis. Haematologica. 2016;101:417–26.