RESEARCH
Association of genetic polymorphisms
in genes involved in Ara-C and dNTP
metabolism pathway with chemosensitivity
and prognosis of adult acute myeloid leukemia
(AML)
Ke‑Wei Zhu
1,2, Peng Chen
1,2, Dao‑Yu Zhang
1,2, Han Yan
1,2, Han Liu
1,2, Li‑Na Cen
1,2, Yan‑Ling Liu
1,2, Shan Cao
1,2,
Gan Zhou
1,2, Hui Zeng
4, Shu‑Ping Chen
4, Xie‑Lan Zhao
4and Xiao‑Ping Chen
1,2,3,5*Abstract
Background: Cytarabine arabinoside (Ara‑C) has been the core of chemotherapy for adult acute myeloid leukemia (AML). Ara‑C undergoes a three‑step phosphorylation into the active metabolite Ara‑C triphosphosphate (ara‑CTP). Several enzymes are involved directly or indirectly in either the formation or detoxification of ara‑CTP.
Methods: A total of 12 eQTL (expression Quantitative Trait Loci) single nucleotide polymorphisms (SNPs) or tag SNPs in 7 genes including CMPK1, NME1, NME2, RRM1, RRM2, SAMHD1 and E2F1 were genotyped in 361 Chinese non‑M3 AML patients by using the Sequenom Massarray system. Association of the SNPs with complete remission (CR) rate after Ara‑C based induction therapy, relapse‑free survival (RFS) and overall survival (OS) were analyzed.
Results: Three SNPs were observed to be associated increased risk of chemoresistance indicated by CR rate (NME2
rs3744660, E2F1 rs3213150, and RRM2 rs1130609), among which two (rs3744660 and rs1130609) were eQTL. Com‑ bined genotypes based on E2F1 rs3213150 and RRM2 rs1130609 polymorphisms further increased the risk of non‑CR. The SAMHD1 eQTL polymorphism rs6102991 showed decreased risk of non‑CR marginally (P = 0.055). Three SNPs (NME1 rs3760468 and rs2302254, and NME2 rs3744660) were associated with worse RFS, and the RRM2 rs1130609 polymorphism was marginally associated with worse RFS (P = 0.085) and OS (P = 0.080). Three SNPs (NME1 rs3760468,
NME2 rs3744660, and RRM1 rs183484) were associated with worse OS in AML patients.
Conclusion: Data from our study demonstrated that SNPs in Ara‑C and dNTP metabolic pathway predict chemosen‑ sitivity and prognosis of AML patients in China.
Keywords: Adult acute myeloid leukaemia (AML), Cytarabine arabinoside (Ara‑C), Single nucleotide polymorphisms (SNPs)
© The Author(s) 2018. This article is distributed under the terms of the Creative Commons Attribution 4.0 International License (http://creat iveco mmons .org/licen ses/by/4.0/), which permits unrestricted use, distribution, and reproduction in any medium, provided you give appropriate credit to the original author(s) and the source, provide a link to the Creative Commons license, and indicate if changes were made. The Creative Commons Public Domain Dedication waiver (http://creat iveco mmons .org/ publi cdoma in/zero/1.0/) applies to the data made available in this article, unless otherwise stated.
Open Access
*Correspondence: chenxp74@hotmail.com
5 Department of Clinical Pharmacology, Xiangya Hospital, Central South
University, Changsha 410008, Hunan, China
Background
Acute myeloid leukemia (AML) is a hematological malig-nancy characterized by malignant proliferation of the hemopoietic system. AML is a heterogeneous collec-tion of diseases characterized by distinct morphological, chromosomal and cytogenetic abnormalities. Subtype specific therapy for AML is not available despite the FAB M3 subtype. Cytarabine arabinoside (Ara-C) remains the first-line chemotherapeutic agent for the treatment of AML for decades [1–3]. Clinical studies have dem-onstrated that the complete remission (CR) rate ranges in 50–70% and 5 year survival rate ranges in 27–40% in AML patients receiving Ara-C based chemotherapy [4–6].
Ara-C is a nucleotide analog that is transmembrane transported into leukemia cells by the nucleoside trans-porters include the solute carrier family 29 member 1 (SLC29A1) [7]. Intracellular Ara-C undergoes a three-step phosphorylation into the activate metabolite Ara-C triphosphate (ara-CTP) by deoxycytidine kinase (DCK) [8], cytidine monophosphate kinase 1 (CMPK1) [9], and nucleoside diphosphate kinases (NDPKs) in turn [10]. Ara-CTP competes with deoxycytidine triphosphate (dCTP) for incorporation into DNA, and thus results in blockade of DNA synthesis and cell death [11]. More recently, Schneider C and colleagues found that ara-CTP is hydrolyzed by the deoxynucleoside triphosphate
(dNTP) triphosphohydrolase SAM domain and HD domain 1 (SAMHD1), which promotes the detoxifica-tion of intracellular ara-CTP pools [12]. Disruption of SAMHD1 increases Ara-C sensitivity in both cultured leukemia cells and mouse model of AML [13].
Intracellular level of dNTPs, which are consisted of dCTP, dATP, dTTP and dGTP, is another potential mech-anism that affect Ara-C sensitivity. High intracellular dNTPs can inhibit Ara-C phosphorylation and decrease the accumulation of ara-CTP through inhibition of DCK
activity by a feedback mechanism. Exhaustion of the intracellular CTP/dCTP pools facilitates Ara-C phospho-rylation and increases the incorporation of ara-CTP into DNA by reducing the feedback inhibition on DCK [14]. Ribonucleotide reductase (RR) is a key enzyme respon-sible for the reduction of ribonucleotides to deoxyribo-nucleotides and plays important roles in the regulation of intracellular CTP/dCTP pools [15, 16] (Fig. 1). RR is mainly composed of RRM1 and RRM2 subunits, and the expression of RRM2 is regulated by the transcrip-tion factor E2F1 [17]. An inverse correlation between
RRM1/RRM2 mRNA expression and intracellular ara-CTP in leukemia blasts after Ara-C treatment is observed in clinic. Ex vivo ara-C sensitivity study with primary AML samples has also shown correlationship between
RRM1 mRNA expression and Ara-C sensitivity [18]. In addition, higher RRM1 expression in leukemia blast
[image:2.595.58.541.435.710.2]cells predicts better relapse-free survival (RFS) in AML patients [19].
Influence of genetic factors on either Ara-C chemosen-sitivity and/or AML prognosis has raised much interest in recent years [20, 21]. Our previous studies have shown associations of single nucleotide polymorphisms (SNPs) in DCK, Wilms tumor 1 (WT1) and DNA methyltrans-ferase 3 alpha (DNMT3A) with drug response to Ara-C based induction therapy in AML [22–24]. In addition, somatic mutations in genes such as DNMT3A, FMS-like Tyrosine Kinase3 (FLT3) and nucleophosmin (NPM1) can also affect AML prognosis [24–26]. For the Ara-C metabolic pathway genes, a promoter polymorphism rs2302254 in NME1 (encoding NDPK-A) is associated increased risk of Ara-C associated neurotoxicity [27]. The RRM1 3′-UTR SNP rs1042919 and promoter SNP rs1561876 are reported to be associated with decreased intracellular ara-CTP levels during Ara-C therapy, and increased risk of relapse and/or worse event free survival (EFS) in Caucasian AML patients treated with cytarabine and cladribine [18]. More recently, association of RRM1
rs9937 variant with induction therapy related death and survival rates in AML patients is also reported [20]. In the study by Cao et al. the RRM2 nonsynonymous SNP rs1130609 (S59A) is associated with decreased Ara-C cytotoxicity in HapMap lymphoblast cell lines from the CEU population and poorer EFS for the St Jude AML97 cohort, but the clinical association was not replicated in St Jude AML02 cohort [18]. There is no studies focused on the association of CMPK1, NME2, SAMHD1 and
E2F1 polymorphisms with Ara-C response in AML patients presently.
In this study, we sought to identify genetics polymor-phisms in Ara-C and dNTP metabolic pathway includ-ing CMPK1, NME1/NME2 (encoding NDPK), SAMHD1,
RRM1, RRM2 and E2F1 with drug response to Ara-C based chemotherapy and AML prognosis in Chinese AML patients.
Methods Patients
Three hundred and sixty-one newly diagnosed AML patients were recruited from Xiangya hospital from May 2009 to Nov 2017. Peripheral venous blood or bone mar-row samples were obtained before chemotherapy. Patients with AML FAB M3 subtype, or combined critical illness and cancer, less than 16 years old, and secondary leuke-mia were excluded. M3 subtype was excluded because this subtype of patients had unique chemotherapy regimens.
All patients received an “7 + 3” induction regimen consisting of Ara-C (100–200 mg/m2 for day 1–7) and
anthracyclines (mitoxantrone 8–16 mg/m2, or
dau-norubicin 45–60 mg/m2, or aclarubicin 20 mg/m2, or
pirarubicin 30 mg/m2, or idarubicin 10–20 mg/m2,
for day 1–3). One or two courses of induction chemo-therapy were given to obtain complete remission (CR). Achievement of CR was defined according to the inter-national recommendations as we described previously [23], which include: < 5% blasts in the bone marrow; absence of extramedullary disease; absolute neutrophil count > 1.0 × 10⁹/L; platelet count > 100 × 109/L. Once CR
was achieved, the patients received sequential consolida-tion therapy consisting of Ara-C and anthracyclines or haematopoietic stem cell transplantation (HSCT). Reg-ular follow-up was carried out by outpatient review or telephone.
The clinical and pathological information of the AML patients were obtained by chart review of electronic medical record (EMR) from the hospital. Overall survival (OS) and relapse free survival (RFS) were used to indicate disease outcomes. Relapse was defined as the presence of > 5% of blast cells in the bone marrow or reappearance of blast cells in the peripheral blood or development of extramedullary disease. RFS was calculated from the date of achievement of CR until the date of relapse or death from any cause. OS was calculated from the date of AML diagnosis to the date of death from any cause. For those patients without relapse or death event by the end of the study follow-up, survival end-points were censored at the date of last follow-up. The risk stratification criteria based on cytogenetics and molecular characteristics was described elsewhere [23].
SNPs selection and genotyping
Based on literature searching on Ara-C metabolism related genes in the PubMed database, 7 genes involved in Ara-C metabolic pathway (CMPK1, NEM1, NEM2,
SAMHD1, RRM1, RRM2, E2F1) were selected. Candidate tag SNPs in these genes were initially selected based on the database from NCBI (https ://www.ncbi.nlm.nih.gov/ snp/) and the 1000 Genomes Project (https ://www.ncbi. nlm.nih.gov/varia tion/tools /1000 genomes/) using the Haploview 4.2 (Cambridge, MA, USA). Then, potential influence of the SNPs on expression the corresponding genes was analyzed by the expression quantitative trait locus (eQTL) database (https ://gtexp ortal .org/home/). A total of 12 SNPs (CMPK1 rs7543016, NME1 rs3760468 and rs2302254, NME2 rs3744660, SMAD1 rs6102991, rs28372906 and rs6029941, E2F1 rs3213150 and rs3213180, RRM1 rs2412344 and rs183484, and RRM2
rs1130609) were finally selected (Table 1, Fig. 2).
rates were higher than 96.4% except for the rs7543016 polymorphism (89.8%) by the Massarray system. Geno-typing results for the SNPs were confirmed in 10% ran-domly selected samples by PCR-based sequencing.
Statistical analysis
Statistical analyses were carried out with the IBM SPSS software (version 22.0; IBM SPSS Inc., Chicago, IL, USA).
Comparisons of continuous variables between genotype groups were performed by nonparametric test (Mann– Whitney U test). Fitness of the genotype distribution to Hardy–Weinberg Equilibrium (HWE) was analyzed by using the χ2 test. Associations of genotypes with CR or
non-CR was analyzed by unconditional logistic regres-sion and indicated by odds ratio (OR) and the 95% confi-dence interval (CI). Survival probabilities were estimated
Table 1 Candidate SNPs selected in the study and influence on gene expression according to eQTL database
NA expression data is not available in the eQTL database
SNP Gene Position MAF Alleles Region eQTL P
rs7543016 CMPK1 1:47333967 0.467 C/G Gly8Arg 0.3 rs3760468 NME1 17:51153130 0.376 A/T Promoter 2.3e−21
rs2302254 NME1 17:51153539 0.087 C/T Promoter 2.7e−13
rs3744660 NME2 17:51168540 0.162 A/G Intron 2.5e−12
rs6102991 SAMHD1 20:36956238 0.386 A/G Promoter 2.0e−6
rs28372906 SAMHD1 20:36951753 0.063 C/T 5′‑UTR NA rs6029941 SAMHD1 20:36891027 0.447 A/G 3′‑UTR 2.1e−8
rs3213150 E2F1 20:33687284 0.357 C/T Intron NA rs3213180 E2F1 20:33675818 0.286 C/G 3′‑UTR NA rs2412344 RRM1 11:4086354 0.430 C/T Promoter 1.1e−6
rs183484 RRM1 11:4119902 0.381 G/T Arg284Arg 9.4e−6
rs1130609 RRM2 2:10122793 0.343 G/T 5′‑UTR/Ser59Ala 1.2e−7
Fig. 2 eQTL analysis of 8 candidate SNPs selected in the study. aNME1 rs3760468; bNME1 rs2302254; cNME1–NME2 rs3744660; dSAMHD1
[image:4.595.55.539.100.272.2] [image:4.595.56.541.302.575.2]by the Kaplan–Meier method, and differences between genotypes were evaluated using the log-rank test. Cox proportional hazard models were constructed for RFS and OS, adjusting for potential confounding covariates including gender, age at diagnosis, risk stratification, allo-SCT, WBC count, serum lactate dehydrogenase (LDH) level and bone marrow blast counts at diagnosis as neces-sary. A stepwise selection method was used to determine the potential confounding covariates. Hazard ratio (HR) was used to estimate association of risk factors with RFS and OS. Three genetic models (dominant, recessive and additive model) were tested for the genotype association analysis. P < 0.05 was considered to be significant.
Results
Baseline characteristics and the overall CR status of the AML patients
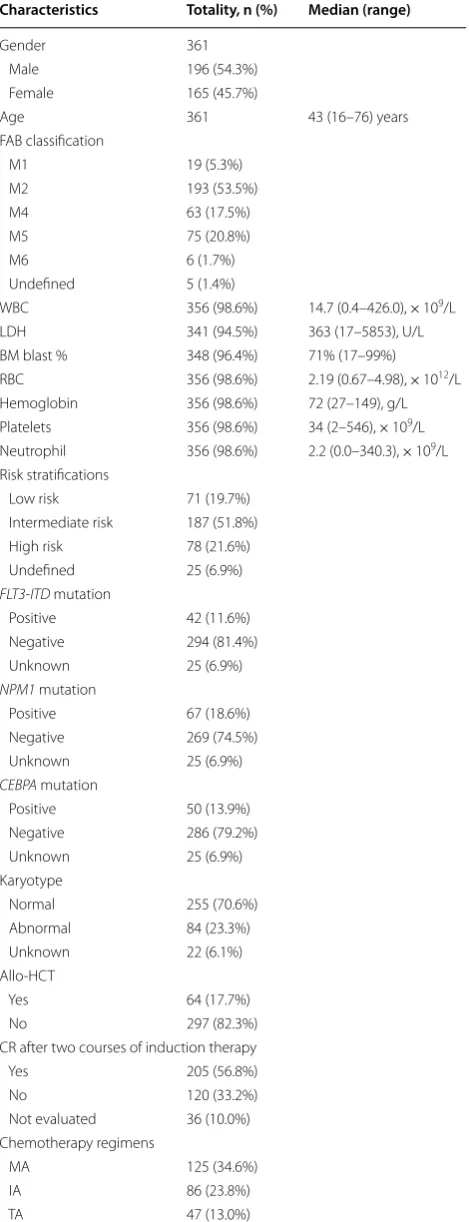
The baseline clinical characteristics of the 361 AML patients were summarized in Table 2. The median age of the patients was 43 [range 16–76] years old. Among the AML patients, 196 were male and 165 were female. According to FAB classification, the patients were clas-sified into 7 subtypes. M2 was the most common sub-type (53.5%), followed by M5 (20.8%), and no patient with the M7 or M0 subtype was recruited. The median number of WBC was 14.7 × 10⁹/L, the mean serum level
of LDH was 363 U/L. Other clinical information was also shown in Table 2. When stratified by cytogenetics and molecular abnormalities, 71, 187, and 78 patients were classified as low risk, intermediate risk, and high risk, respectively. Information of karyotype and somatic mutations was not available for 25 patients. For the 361 patients received Ara-C based induction therapy, 211 patients (58.4%) received Ara-C + mitoxantrone (MA) or Ara-C + idarubicin (IA) regimens, 47 patients (13.0%) received Ara-C + THP (TA), 52 patients (14.4%) received Ara-C + aclarubicin + G-CSF (CAG) and 31 patients (8.6%) received Ara-C + daunorubicin (DA). A total of 205 patients (56.8%) achieved CR after one or two courses of chemotherapy, and CR could not be evaluated accurately for 36 (10.0%) patients due to insufficiencies in clinical evidence. Sixty-four (17.7%) patients received hematopoietic stem cell transplantation, 178 patients died during the follow-up time, and 7 (1.9%) patients were out of touch after several follow-up. The median and mean follow-up period for OS analysis were 926 and 1235 days, respectively.
Comparison of CR rate among genotypes after Ara‑C based induction therapy and results of unconditional logistic regression analysis
Significant differences in CR rates among genotypes for the NME2 rs3744660 (P = 0.047), E2F1 rs3213150
Table 2 The baseline characteristics of 316 AML patients Characteristics Totality, n (%) Median (range)
Gender 361
Male 196 (54.3%)
Female 165 (45.7%)
Age 361 43 (16–76) years
FAB classification
M1 19 (5.3%)
M2 193 (53.5%)
M4 63 (17.5%)
M5 75 (20.8%)
M6 6 (1.7%)
Undefined 5 (1.4%)
WBC 356 (98.6%) 14.7 (0.4–426.0), × 109/L
LDH 341 (94.5%) 363 (17–5853), U/L
BM blast % 348 (96.4%) 71% (17–99%)
RBC 356 (98.6%) 2.19 (0.67–4.98), × 1012/L
Hemoglobin 356 (98.6%) 72 (27–149), g/L
Platelets 356 (98.6%) 34 (2–546), × 109/L
Neutrophil 356 (98.6%) 2.2 (0.0–340.3), × 109/L
Risk stratifications
Low risk 71 (19.7%)
Intermediate risk 187 (51.8%)
High risk 78 (21.6%)
Undefined 25 (6.9%)
FLT3‑ITD mutation
Positive 42 (11.6%)
Negative 294 (81.4%)
Unknown 25 (6.9%)
NPM1 mutation
Positive 67 (18.6%)
Negative 269 (74.5%)
Unknown 25 (6.9%)
CEBPA mutation
Positive 50 (13.9%)
Negative 286 (79.2%)
Unknown 25 (6.9%)
Karyotype
Normal 255 (70.6%)
Abnormal 84 (23.3%)
Unknown 22 (6.1%)
Allo‑HCT
Yes 64 (17.7%)
No 297 (82.3%)
CR after two courses of induction therapy
Yes 205 (56.8%)
No 120 (33.2%)
Not evaluated 36 (10.0%)
Chemotherapy regimens
MA 125 (34.6%)
IA 86 (23.8%)
[image:5.595.305.540.104.716.2](P = 0.043), and RRM2 rs1130609 (P = 0.042) polymor-phisms were observed (p values from Chi square test by three genotype groups). For the NME2 rs3744660 polymorphism, the CR rate was 68.5, 53.9, and 57.1%, respectively, for the GG, GA and AA genotypes, and carriers of the rs3744660 A allele (dominant model) showed significantly increased non-CR (indicative of chemoresistance) rate (GA+AA vs GG, 45.6% vs 31.5%, crude OR = 1.829, 95% CI 1.127–2.967, P = 0.014) (Table 3). For the E2F1 rs3213150 polymorphism, the CR rate was 60.4, 69.2, and 50.0%, respectively, for the CC, CT, and TT genotypes, and rs3213150 TT homozygous showed significantly increased non-CR rate as compared with carriers of the rs3213150 C allele (recessive model) (50.0% vs 34.4%, crude OR = 1.903, 95% CI 1.014–3.574, P =0.043). For the RRM2
rs1130609 polymorphism, the CR rate was 64.1, 67.1, and 44.1%, respectively, for the TT, TG and GG geno-types, and patients with the rare GG genotype showed significantly increased non-CR rate as compared with carriers of the T allele (GG vs TT+TG, 55.9% vs 34.3%, crude OR = 2.428, 95% CI 1.181–4.990, P = 0.014). Car-riers of the SAMHD1 rs6102991 G allele (GA+GG) also showed marginally decreased non-CR rate as compared with the wild-type AA homozygotes (crude OR = 0.611, 95% CI 0.369–1.013, P = 0.055). No differences in CR rates among genotypes for other SNPs were observed (Table 3).
Logistic regression analysis showed significant asso-ciations of risk stratification, age, pretreatment WBC counts and LDH levels with non-CR risk (Additional file 1: Table S1). When adjusted by these risk fac-tors, NME2 rs3744660, E2F1 rs3213150 and RRM2
rs1130609 were still significantly associated with risk of non-CR (Table 3). NME2 rs3744660 AG genotype or carriers of the rs3744660 A allele showed increased risk for non-CR (AG vs GG: adjusted OR = 1.953, 95% CI 1.092–3.484, P = 0.024; AG+AA vs GG: adjusted OR = 1.852, 95% CI 1.062–3.236, P = 0.030). For the
E2F1 rs3213150 polymorphism, as compared with patients carrying the E2F1 rs3213150 C allele, those
with the TT genotype showed increased risk of non-CR (adjusted OR = 2.208, 95% CI 1.065–4.567, P = 0.033). While for the RRM2 rs1130609 polymorphism, the rare GG homozygotes showed significantly increased risk of non-CR in comparison with carriers of the T allele (adjusted OR = 2.398, 95% CI 1.025–5.618, P = 0.044). Marginally decreased risk of non-CR was also observed for the SAMHD1 rs6102991 polymorphism in a domi-nant model (GA+GG vs AA, adjusted OR = 0.611, 95% CI 0.349–1.071, P = 0.086).
Combined influence of E2F1 and RRM2 polymorphisms on chemosensitivity to Ara‑C based induction therapy in AML patients
As E2F1 is a transcription factor involved in the regula-tion of RRM2 expression, a combined genotype analy-sis of the E2F1 and RRM2 polymorphisms on CR rate was carried out. As both E2F1 rs3213150 and RRM2
rs1130609 polymorphisms were associated with increased risk for non-CR in negative models, patients were grouped based on genotypes of the two SNPs (Table 5): rs1130609 TT+GT/rs3213150 CC+CT (both favorable for CR, n = 237), rs1130609 TT+GT/rs3213150 TT, n = 37), rs1130609 GG/rs3213150 CC+CT (n = 27), and rs1130609 GG/rs3213150 TT (both unfavorable for CR, n = 6). Significant difference in CR rate was observed among the four groups (χ2= 10.637, P = 0.014), which
was 66.7, 54.1, 48.1, and 16.7%, respectively (Table 5). As compared with the favorable genotypes combination group (rs1130609 TT+GT/rs3213150 CC+CT), carriers of two unfavorable genotypes (rs1130609 GG/rs3213150 TT) and those carrying at least one unfavorable geno-type showed significantly increased risk of non-CR (OR = 10.00, 95% CI 1.149–87.06, P = 0.004; OR = 2.118, 95 CI 1.233–3.637, P = 0.006, respectively, Table 4). After adjustment for age, risk stratification, and WBC counts, results of logistic regression analysis indicated that patients carrying both or at least one unfavorable genotype showed significantly increased risk of non-CR (OR = 9.780, 95% CI 1.099–87.069, P = 0.041; OR = 2.257, 95 CI 1.273–4.002, P = 0.005, respectively, Table 4).
Influence of candidate SNPs on RFS and OS for AML patients
Univariate analysis showed significant differences in RFS among genotypes of NME1 rs3760468, NME1 rs2302254, and NME2 rs3744660 (Table 5, Fig. 3). All the three SNPs were associated with worse RFS in a recessive model (rs3760468 TT vs AA+AT: HR = 1.752, 95% CI 1.142– 2.686, P = 0.009; rs2302254 TT vs CC+CT: HR = 1.912, 95% CI 1.117–3.272, P =0.016; rs3744660 AA vs GG+AG: HR = 2.087, 95% CI 1.051–4.145, P = 0.036).
Table 2 (continued)
Characteristics Totality, n (%) Median (range)
DA 31 (8.6%)
CAG 52 (14.4%)
Other regimens 20 (5.5%)
Table 3 Comparison of CR rate among genotypes after 2 courses of Ara-C based chemotherapy
Genotype Total (n) CR, n (%) Non‑CR, n (%) P OR (95% CI) Pa OR (95% CI)a
CMPK1 rs7543016
CC 93 57 (61.3%) 36 (38.7%) 1.00 (reference) 1.00 (reference)
GC 167 106 (63.5%) 61 (36.5%) 0.727 0.911 (0.540–1.537) 0.921 0.970 (0.531–1.772)
GG 30 23 (76.7%) 7 (23.3%) 0.125 0.482 (0.188–1.238) 0.076 0.365 (0.120–1.111)
NME1 rs3760468
AA 115 77 (67.0%) 38 (33.0%) 1.00 (reference) 1.00 (reference)
AT 154 96 (62.3%) 58 (37.7%) 0.434 1.224 (0.737–2.033) 0.256 1.420 (0.775–2.597)
TT 44 26 (59.1%) 18 (40.9%) 0.353 1.403 (0.686–2.869) 0.465 1.359 (0.597–3.096)
NME1 rs2302254
CC 186 123 (66.1%) 63 (33.9%) 1.00 (reference) 1.00 (reference)
CT 114 65 (57.0%) 49 (43.0%) 0.114 1.473 (0.912–2.375) 0.288 1.355 (0.775–2.370)
TT 19 13 (68.4%) 6 (31.6%) 0.840 0.901 (0.327–2.481) 0.534 0.688 (0.212–2.232)
NME2 rs3744660
GG 213 146 (68.5%) 67 (31.5%) 1.00 (reference) 1.00 (reference)
AG 89 48 (53.9%) 41 (46.1%) 0.016 1.861 (1.121–3.091) 0.024 1.953 (1.092–3.484)
AA 14 8 (57.1%) 6 (42.9%) 0.376 1.634 (0.545–4.897) 0.770 1.299 (0.361–4.673)
AA+AG 103 56 (54.4%) 47 (45.6%) 0.014 1.829 (1.127–2.967) 0.030 1.852 (1.062–3.236)
SAMHD1 rs6102991
AA 88 49 (55.7%) 39 (44.3%) 1.00 (reference) 1.00 (reference)
GA 161 107 (66.5%) 54 (33.5%) 0.093 0.634 (0.372–1.080) 0.183 0.669 (0.370–1.209)
GG 62 43 (69.4%) 19 (30.6%) 0.090 0.555 (0.280–1.101) 0.063 0.483 (0.224–1.038)
AG+GG 223 150 (67.3%) 73 (32.7%) 0.055 0.611 (0.369–1.013) 0.086 0.611 (0.349–1.071)
SAMHD1 rs28372906
TT 284 180 (63.4%) 104 (36.6%) 1.00 (reference) 1.00 (reference)
CT 32 21 (65.6%) 11 (34.4%) 0.802 0.907 (0.420–1.955) 0.878 0.935 (0.394–2.217)
CC 4 3 (75.0%) 1 (25.0%) 0.632 0.577 (0.059–5.618) 0.953 0.933 (0.091–9.524)
SAMHD1 rs6029941
GG 88 50 (56.8%) 38 (43.2%) 1.00 (reference) 1.00 (reference)
GA 161 107 (66.5%) 54 (33.5%) 0.132 0.664 (0.389–1.132) 0.339 0.739 (0.398–1.374)
AA 65 42 (64.6%) 23 (35.4%) 0.330 0.721 (0.372–1.395) 0.370 0.706 (0.330–1.512)
E2F1 rs3213180
GG 149 95 (63.8%) 54 (36.2%) 1.00 (reference) 1.00 (reference)
GC 141 90 (63.8%) 51 (36.2%) 0.990 0.997 (0.617–1.610) 0.915 0.970 (0.552–1.704)
CC 29 16 (55.2%) 13 (44.8%) 0.383 1.429 (0.639–3.195) 0.429 1.449 (0.578–3.636)
E2F1 rs3213150
CC 111 67 (60.4%) 44 (39.6%) 1.00 (reference) 1.00 (reference)
CT 159 110 (69.2%) 49 (30.8%) 0.133 0.678 (0.408–1.127) 0.105 0.616 (0.343–1.106)
TT 46 23 (50.0%) 23 (50.0%) 0.232 1.523 (0.762–3.042) 0.128 1.835 (0.839–4.016)
CC+CT 270 177 (65.6%) 93 (34.4%) 1.00 (reference) 1.00 (reference)
TT 46 23 (50.0%) 23 (50.0%) 0.043 1.903 (1.014–3.574) 0.033 2.208 (1.065–4.567)
RRM1 rs183484
GG 100 62 (62.0%) 38 (38.0%) 1.00 (reference) 1.00 (reference)
GT 177 118 (66.7%) 59 (33.3%) 0.434 0.816 (0.490–1.359) 0.112 0.617 (0.340–1.119)
TT 42 22 (52.4%) 20 (47.6%) 0.287 1.483 (0.716–3.071) 0.263 1.616 (0.697–3.731)
RRM1 rs2412344
TT 89 56 (62.9%) 33 (37.1%) 1.00 (reference) 1.00 (reference)
CT 183 119 (65.0%) 64 (35.0%) 0.734 0.913 (0.539–1.545) 0.510 0.817 (0.449–1.488)
CC 48 28 (58.3%) 20 (41.7%) 0.599 1.212 (0.592–2.483) 0.967 1.018 (0.429–2.415)
RRM2 rs1130609
TT 131 84 (64.1%) 47 (35.9%) 1.00 (reference) 1.00 (reference)
[image:7.595.58.535.106.723.2]The RRM2 rs1130609 GG genotype also showed mar-ginally worse RFS (GG vs TT+GT: HR = 1.577, 95% CI
0.935–2.660, P = 0.085).
Multivariate analysis indicated that risk stratifica-tion, age, allo-SCT, WBC counts and serum LDH levels were associated with RFS of AML patients (Additional
Table 5 Univariate and multivariate Cox regression analysis of SNPs associated with AML relapse-free survival (RFS)
a Adjusted for risk stratification, WBC count, and allo-SCT
Genotype n Mean ± SE (day) Median (range, day) HR (95% CI) P HR (95% CI)a Pa
NME1 rs3760468
AA 113 1058 ± 202 751 (294–1208) 1.00 (reference) 1.00 (reference)
AT 121 1163 ± 212 894 (378–1410) 0.946 (0.657–1.362) 0.764 1.027 (0.709–1.488) 0.887 TT 39 655 ± 207 357 (285–429) 1.703 (1.070–2.709) 0.025 1.744 (1.085–2.801) 0.022 AA+AT 234 1110 ± 149 761 (379–1143) 1.00 (reference) 1.00 (reference)
TT 39 655 ± 207 357 (285–429) 1.752 (1.142–2.686) 0.009 1.854 (1.197–2.871) 0.006
NME1 rs2302254
CC 169 941 ± 129 724 (4484–964) 1.00 (reference) 1.00 (reference)
CT 87 1324 ± 266 1282 (516–2048) 0.770 (0.526–1.126) 0.177 0.728 (0.494–1.071) 0.107 TT 22 581 ± 253 373 (286–460) 1.756 (1.014–3.042) 0.044 1.688 (0.973–2.928) 0.062 CC+CT 256 1111 ± 156 760 (398–1122) 1.00 (reference) 1.00 (reference)
TT 22 581 ± 253 373 (286–460) 1.912 (1.117–3.272) 0.016 1.878 (1.096–3.217) 0.022
NME2 rs3744660
GG 191 987 ± 124 751 (397–1105) 1.00 (reference) 1.00 (reference)
AG 71 1239 ± 283 976 (186–1766) 0.929 (0.627–1.377) 0.714 0.958 (0.644–1.425) 0.832 AA 12 382 ± 116 373 (95–651) 2.087 (1.051–4.145) 0.036 2.224 (1.114–4.444) 0.024 GG+AG 262 1136 ± 157 760 (399–1121) 1.00 (reference) 1.00 (reference)
AA 12 382 ± 116 373 (95–651) 2.127 (1.078–4.194) 0.026 2.250 (1.135–4.460) 0.020
RRM2 rs1130609
TT 123 1126 ± 208 751 (368–1134) 1.00 (reference) 1.00 (reference)
GT 125 1129 ± 216 724 (209–1239) 1.561 (0.692–1.386) 0.907 0.926 (0.651–1.317) 0.668 GG 29 679 ± 272 371 (200–542) 1.561 (0.900–2.707) 0.113 1.437 (0.825–2.501) 0.200 TT+GT 248 1127 ± 159 729 (381–1077) 1.00 (reference) 1.00 (reference)
GG 29 679 ± 272 371 (200–542) 1.577 (0.935–2.660) 0.085 1.493 (0.882–2.528) 0.136
Table 3 (continued)
a Adjusted by age, risk stratification, WBC count, and serum LDH level
Genotype Total (n) CR, n (%) Non‑CR, n (%) P OR (95% CI) Pa OR (95% CI)a
GG 34 15 (44.1%) 19 (55.9%) 0.034 2.264 (1.053–4.867) 0.069 2.347 (0.935–5.882)
TT+GT 280 184 (65.7%) 96 (34.3%) 1.00 (reference) 1.00 (reference)
GG 34 15 (44.1%) 19 (55.9%) 0.014 2.428 (1.181–4.990) 0.044 2.398 (1.025–5.618)
Table 4 Combined genotypes of RRM2 and E2F1 polymorphisms and chemotherapy sensitivity in AML patients
a Unfavorable combination genotypes included rs1130609 GG genotype or rs3213150 TT genotype
b Adjusted by age, risk stratification, WBC count, and serum LDH level
rs1130609 rs3213150 CR, n (%) Non‑CR, n (%) P OR (95% CI) Pb OR (95% CI)b
[image:8.595.54.541.104.160.2] [image:8.595.54.542.207.290.2] [image:8.595.59.540.337.658.2]file 2: Table S2). When adjusted by these risk factors,
NME1 rs3760468 TT, NME1 rs2302254 TT, and NME2
rs3744660 GG genotypes were still associated with worse RFS (rs3760468 TT vs AA+AT: adjusted HR = 1.854, 95% CI 1.197–2.871, P = 0.006; rs2302254 TT vs CC+CT: adjusted HR = 1.878, 95% CI 1.096–3.217, P = 0.022; rs3744660 AA vs GG+AG: adjusted HR = 2.250, 95% CI 1.135–4.460, P = 0.020).
Results of univariate analysis showed that the NME1
rs3760468, NME2 rs3744660, and RRM1 rs183484 polymorphisms were associated with OS of AML patients significantly (Table 6, Fig 4). As compared with rs3760468 AA homozygotes, rs3760468 TT homozygotes showed significantly worse OS (TT vs AA, HR = 1.652, 95% CI 1.067–2.557, P = 0.024) and carriers of the rs3760468 T allele showed a trend of worse OS (TT+AT vs AA: HR = 1.328, 95% CI 0.973–1.812, P = 0.073). For the rs3744660 polymorphisms, the rare AA homozy-gotes showed significantly worse OS (HR = 2.214, 95% CI 1.154–4.247, P = 0.017). For the RRM1 rs183484 polymorphism, the GT heterozygotes showed signifi-cantly better OS than the wild-type GG homozygotes (HR = 0.692, 95% CI 0.496–0.964, P = 0.030). Margin-ally significant difference in OS between the RRM2
rs1130609 GG and GT+TT genotypes was also observed (HR = 1.516, 95% CI 0.948–2.422, P = 0.080, Table 6).
Results from multivariate analysis indicated that risk stratification, age, allo-SCT, WBC counts and serum LDH levels were associated with OS of AML patients (Additional file 2: Table S2). When adjusted by these OS risk factors, rs3760468, rs3744660, and rs183484 polymorphisms were still associated with OS risk. As compared with rs3760468 AA homozygotes, rs3760468 TT homozygotes or carriers of the rs3760468 T allele showed significantly worse OS (TT+AT vs AA: adjusted HR = 1.518, 95% CI 1.082–2.129, P = 0.016). For the rs3744660 polymorphisms, the rare AA homozygotes showed significantly worse OS (adjusted HR = 2.284, 95% CI 1.145–4.559, P = 0.019). For the RRM1 rs183484 polymorphism, the GT heterozygotes showed signifi-cantly longer OS than the wild-type GG homozygotes (HR = 0.599, 95% CI 0.413–0.868, P = 0.007).
Discussion
In this study, we observed the associations of 12 SNPs in 7 genes involved in Ara-C and dNTP metabolic path-way with chemosensitivity to Ara-C based therapy as well as disease prognosis in Chinese AML patients. We observed that 3 SNPs including NME2 rs3744660 (dominant model), E2F1 rs3213150 (recessive model) and RRM2 rs1130609 (recessive model) were associ-ated with increased risk for non-CR after Ara-C based
Table 6 Univariate and multivariate Cox regression analysis of SNPs associated with AML overall survival (OS)
a Adjusted for risk stratification, WBC count, allo-SCT, age, and serum LDH level
Genotype n Mean ± SE (day) Median (range) (day) HR (95% CI) P HR (95% CI)a Pa
NME1 rs3760468
AA 135 1326 ± 209 1534 (947–2121) 1.00 (reference) 1.00 (reference)
AT 160 1232 ± 218 768 (388–1148) 1.238 (0.890–1.724) 0.205 1.455 (1.015–2.087) 0.041 TT 47 801 ± 231 513 (398–638) 1.652 (1.067–2.557) 0.024 1.702 (1.072–2.704) 0.024 AT+TT 207 1159 ± 185 663 (442–884) 1.328 (0.973–1.812) 0.073 1.518 (1.082–2.129) 0.016
NME2 rs3744660
GG 230 1283 ± 168 1159 (615–1703) 1.00 (reference) 1.00 (reference)
AG 98 1175 ± 252 817 (410–1224) 1.283 (0.924–1.780) 0.137 1.181 (0.831–1.679) 0.353 AA 15 442 ± 149 359 (167–551) 2.214 (1.154–4.247) 0.017 2.284 (1.145–4.559) 0.019 GG+AG 328 1261 ± 143 988 (682–1294) 1.00 (reference) 1.00 (reference)
AA 15 442 ± 149 359 (167–511) 2.054 (1.080–3.905) 0.025 2.172 (1.098–4.294) 0.026
RRM1 rs183484
GG 109 940 ± 167 672 (454–890) 1.00 (reference) 1.00 (reference)
GT 194 1506 ± 202 1749 (799–2699) 0.692 (0.496–0.964) 0.030 0.599 (0.413–0.868) 0.007 TT 46 993 ± 305 414 (162–666) 1.112 (0.717–1.726) 0.635 1.063 (0.665–1.698) 0.799
RRM2 rs1130609
TT 148 1243 \± 201 1025 (426–1624) 1.00 (reference) 1.00 (reference)
GT 161 1380 ± 209 843 (520–1166) 0.988 (0.719–1.357) 0.941 1.025 (0.746–1.408) 0.881 GG 36 753 ± 248 473 (137–809) 1.506 (0.917–2.475) 0.106 1.489 (0.906–2.448) 0.116 TT+GT 309 1297 ± 153 935 (645–1225) 1.00 (reference) 1.00 (reference)
[image:9.595.59.537.101.378.2]therapy, while the SAMHD1 rs6102991 polymorphism showed a tendency with decreased risk of non-CR. We also observed a combined effect of E2F1 and RRM2 poly-morphisms on CR rate. In addition, we observed that the
NME1 rs3760468 and rs2302254, and NME2 rs3744660 polymorphisms predicted worse RFS, while NME1
rs3760468, NME2 rs3744660, and RRM1 rs183484 pre-dicted worse OS in the AML patients.
For the 7 genes involved in our study, 3 genes (CMPK1,
NME1 and NME2) were involved in the metabolic activa-tion of Ara-C, while 4 genes (SAMHD1, E2F1, RRM1 and
RRM2) were involved in the Ara-C inactivation or DCK feedback inhibition (dNTP/dCTP synthesis) pathways. Four genes (CMPK1, NME2, SAMHD1 and E2F1) were studied for the first time in our study. The majority of the SNPs included in our study were eQTL variants. For the 4 SNPs associated with CR rate observed in our study, dif-ference in mRNA expression among genotypes of NME2
rs3744660 (P = 2.5e−12), RRM2 rs1130609 (P = 1.2e−7),
and SAMHD1 rs6102991 (P = 2.0e−6) were indicated by
eQTL analysis, and 2 of these SNPs (NME2 rs3744660,
SAMHD1 rs6102991) were reported for the first time in our study.
NME1 (alias DNPK-A) and NME2 (alias DNPK-B) are two most important members of the NDPK family of proteins and mediate phosphorylation of ara-CDP into ara-CTP. The coding genes NME1 and NME2 are closely neighbored on chromosome 17. We observed that car-riers of the NME2 intronic variant rs3744660 was asso-ciated with decreased NME2 mRNA expression shown by eQTL analysis, which indicated decreased DNPK activity and ara-CTP formation, this is in agreement with the observation of decreased CR rate in patients carrying the rs3744660 A allele or worse prognosis in AA genotyped patients. Few studies have focused on
NME1–NME2 locus presently. NME1 is initially identi-fied for its metastatic suppressive potential for cancer cells [28]. Qu et al. reported that the NME1 promoter SNPs rs2302254 and rs3760468 can alter nuclear proteins binding capacity and reduce NME1 promoter activity by about 20%, which may account for increased breast can-cer mortality for these SNPs in Chinese [29]. In a study by Braunagel et al. the rs2302254 TT genotype (mutant homozygotes) was an independent risk factor for Ara-C associated neurotoxicity but not for OS or RFS in AML patients [26]. However, neither rs2302254 nor rs3760468
Fig. 3 Comparison of relapse‑free survival (RFS) in AML patients among/between genotypes of NME1 rs3760468 (a); NME1 rs2302254 (b); NME2
[image:10.595.58.538.87.387.2]was associated with CR rate in our study, though both polymorphisms can results in decreased NME1 mRNA expression and predicted worse prognosis indicated by RFS and/or OS in our study. We assume that the posi-tive findings in AML prognosis could also be explained, at least partially, by the direct functions of NME1/NME2, both can stimulate the growth and survival of AML cells through activation of the MAPK and transducers and activators of transcription signaling pathways [30, 31]. Of note, the rs3744660 is located in intron 4 of NME2
(NM_001018137.2) and intron 7 of the NME1–NME2
transcript (NM_001018136.2), the exact function of this SNP remains to be explored.
The RRM2 rs1130609 polymorphism is a non-synony-mous SNP that leads to amino acid change from Ser59 to Ala59. We found that the rare GG genotype showed increased RRM2 mRNA expression as indicated by eQTL analysis, which may suggest increased dNTP synthesis and increased feedback inhibition on DCK activity in these patients. This is in accordance with the findings of increased non-CR risk and marginally worse prognosis in AML patients with the GG genotype in our study. In consistent with our study, higher RRM1/RRM2 mRNA expression was observed to be associated with decreased Ara-C sensitivity in the HapMap YRI samples (30 trios).
Our findings are also in agreement with a previous study by Cao et al. who reported that the rs1130609 polymor-phism was associated with decreased Ara-C cytotoxicity in the HapMap CEU samples and worse EFS in Cauca-sian AML patient cohorts [18]. The exact function of the SNP remains unknown despite its influence on RRM2
mRNA expression. Search of the dbSNP database shows that the rs1130609 polymorphism is also a 5′-UTR SNP for the RRM2 transcript NM_001034.3. Further func-tional study of this SNP is required. Cao et al. reported significant associations of several RRM1 SNPs in the reg-ulatory regions (e.g. rs2412344, rs11030907, rs7929397, rs2898950, rs1042919, and rs2412344) with ex vivo Ara-C cytotoxicity and/or in vivo Ara-C response [18]. A recent study in Chinese AML patients also observed association of the 3′-UTR potential miRNA binding site SNP rs1042919 with decreased CR rate but not disease prognosis in AML patients [32]. However, we failed to observed associations between the two RRM1 SNPs rs2412344 (in promoter) and rs183484 (Arg284Arg) and risk of non-CR, though significant differences in mRNA expression among the genotypes of both SNPs were indi-cated by eQTL analysis. We observed that the rs183484 GT genotype showed better OS (HR = 0.599, 95% CI
[image:11.595.58.540.87.377.2]0.413–0.868, P = 0.007). The discrepancies among the studies should be further validated in future studies.
E2F1 is a newly identified risk gene for Ara-C response in our study. We selected this gene based on a recent report of ERK/E2F1 signaling in regulating RRM2
expression, dCTP pool and gemcitabine sensitivity [17]. The E2F1 rs3213150 polymorphism is an intronic and tag SNP selected in our study. Interesting, we observed sig-nificant association of this SNP with CR rate after Ara-C based induction therapy. In addition, a combined effect of the E2F1 rs3213150 and RRM2 rs1130609 polymor-phisms on CR rate is observed. The CR rate decreased with the number of unfavorable genotypes carried at both loci (66.7% in carriers of both favorable genotypes, 51.6% in carriers of one unfavorable genotype, and 16.6% in carriers of unfavorable genotypes for both SNPs), and unfavorable genotypes at both loci results in about nine-fold increase in non-CR risk after Ara-C based chemo-therapy (OR = 9.780, 95% CI 1.099–87.069, P = 0.041). Our study suggest the importance of concomitant con-sideration of genetic variants of both E2F1 and RRM2 in evaluation of Ara-C response in AML patients.
SAMHD1 is a recently identified ara-CTPase that can hydrolyze and detoxify intracellular ara-CTP [12]. Inhi-bition of the enzyme or CRISPR–Cas9-mediated disrup-tion of SAMHD1 can sensitize AML cells to Ara-C [13]. In our study, we analyzed associations of three SAMHD1
SNPs (rs6102991 in the promoter, rs28372906 in 5′-UTR, and rs6029941 in 3′-UTR) with drug response and AML prognosis. We observed that carriers of the rs6102991 G allele showed a tendency with decreased risk of non-CR after Ara-C based therapy in a dominant model (OR =0.611, 95% CI 0.369–1.013, P = 0.055). The rs6102991 polymorphism is located at − 4395 upstream transcription start site (T-4395C). eQTL analysis indi-cates that the rs6102991 polymorphism results in decreased SAMHD1 mRNA expression, which supports our clinic findings. As the SNPs is far from the transcrip-tion start site, our findings indicate potential influence of rs6102991 or other variants in high LD with it on Ara-C response through affecting SAMHD1 mRNA expression. Few studies have focused on functions of rare SAMHD1
coding variations on HIV infection and replication [33,
34], however, there is still a gap between SAMHD1 vari-ations and the clinical relevance. Because SNPs infor-mation for the SAMHD1 promoter is very limited in the SNP database available, further study is required to explore the potentially causative variant(s).
There were some limitations in our study. For instance, the outcomes of our study failed to undergo multiple test adjusting, some P values lost statistical significance when Bonferroni correction was performed possibly due to limited sample size included in our study. In addition,
Ara-C response is affected by various genetic factors, the contribution of any unique gene in the drug response might be limited. And due to the limitations of the Mas-sarray genotyping system, we failed to genotype some of the important SNPs such as RRM1rs1561876 [18]. For the AML patients involved in our study, genotype distribution for 4 SNPs (CMPK1 rs7543016, SAMHD1
rs28372906, RRM1 rs183484, and RRM2 rs1130609) were not in Hardy–Weinberg equilibrium, these may partially be explained by the internal function of the genes in eti-ology of AML rather than in Ara-c response. We suppose that these polymorphisms may also act as susceptibility genes for AML, which may account for the abnormal distribution of the genotype for these SNPs in the AML patients. Of course, this should be confirmed in further study.
Conclusions
Our current study demonstrated that SNPs in genes involved in Ara-C metabolic pathway are associated with drug response to Ara-C based induction therapy and prognosis of AML in Chinese patients, though fur-ther confirmatory studies and functional evaluations of the newly identified SNPs are needed to further support our findings. In addition, we suggest consideration of combined genotypes in the Ara-C metabolic pathway in evaluation of the associations between genetic variations and drug response in AML. Our findings provide insight-ful information for the understanding of individual dif-ference in drug response and potential biomarkers for identification of patients with increased risk of chemore-sistance or poor prognosis.
Abbreviations
Ara‑C: cytarabine arabinoside; dNTP: deoxy‑ribonucleoside triphosphate; AML: acute myeloid leukemia; ara‑CTP: cytarabine arabinoside triphos‑ phate; CR: complete remission; RFS: relapse‑free survival; OS: overall survival; eQTL: expression Quantitative Trait Loci; SNPs: single nucleotide polymor‑ phisms; SLC29A1: solute carrier family 29 member 1; DCK: deoxycytidine kinase; NDPKs: nucleoside diphosphate kinases; dCTP: deoxycytidine triphosphate; SAMHD1: SAM domain and HD domain 1; dATP: deoxyadenosine triphosphate; dTTP: deoxythymidine triphosphate; dGTP: deoxyguanosine triphosphate; RR: ribonucleotide reductase; CTP: cytidine triphosphate; RRM1: ribonucleotide reductase catalytic subunit M1; RRM2: ribonucleotide reductase catalytic subu‑ nit M2; WT1: Wilms tumor 1; DNMT3A: DNA methyltransferase 3 alpha; E2F1: transcription factor 1; FLT3: FMS‑like Tyrosine Kinase3; NMP1: nucleophosmin; NME1: nucleoside diphosphate kinase 1; NME2: nucleoside diphosphate kinase 2; EFS: event free survival; CMPK1: cytidine/uridine monophosphate kinase 1; EMR: electronic medical record; HSCT: haematopoietic stem cell transplan‑ tation; HWE: Hardy–Weinberg Equilibrium; FAB: French–Britain–American;
Additional files
Additional file 1: Table S1. Unconditional logistic regression analysis of clinical variables associated with non‑CR risk in AML patients.
WBC: white blood cell; LDH: lactate dehydrogenase; BM: bone marrow; RBC: red blood cell; Allo‑SCT: allogeneic hematopoietic stem cell transplanta‑ tion; CR: complete remission; THP: pirarubicin; MA: Ara‑C + mitoxantrone; IA: Ara‑C + idarubicin; TA: Ara‑C + pirarubicin; DA: Ara‑C + daunorubicin; CAG : Ara‑C + aclarubicin + G‑CSF; G‑CSF: granulocyte colony‑stimulating factor; OR: odds ratio; HR: hazard ratio; CI: confidence interval; LD: linkage disequilibrium; HIV: human immunodeficiency virus.
Authors’ contributions
ZKW made main contributions to read document and design research, speci‑ men collection, sorting date, date analysis and drafting manuscript; CP, ZDY, YH and LYL were assisting in specimen collection and acquisition of clinical date; LH and CLN were mainly responsible for follow‑up; and CXP provided substantial guidance and revised manuscript; CS and ZG given some useful advice; ZH, CSP, ZXL helped to collect specimen smoothly. All authors read and approved the final manuscript.
Author details
1 Department of Clinical Pharmacology, Xiangya Hospital, Central South
University, Changsha 410078, People’s Republic of China. 2 Institute of Clinical
Pharmacology, Central South University, Hunan Key Laboratory of Pharma‑ cogenetics, Changsha 410078, People’s Republic of China. 3 National Clinical
Research Center for Geriatric Disorders, Xiangya Hospital, Central South Uni‑ versity, Changsha 410008, Hunan, People’s Republic of China. 4 Department
of Hematology, Xiangya Hospital, Central South University, Changsha 410078, People’s Republic of China. 5 Department of Clinical Pharmacology, Xiangya
Hospital, Central South University, Changsha 410008, Hunan, China.
Acknowledgements
The authors would like to thank Prof. Hui Zeng, Shu‑ping Chen, Xie‑lan Zhao for unselfish assistance with colleting specimen and acquiring clinical date.
Competing interests
The authors declare that they have no competing interests.
Availability of date and materials
The datasets supporting the conclusions of this article are included within the article (and its additional files).
Consent for publication Not applicable.
Ethics approval and consent to participate
This study was approved by the Ethics Committee of Institute of Clinical Pharmacology, Central South University (Registration Number: CTXY‑120025‑ 2). Clinical study admission (Registration Number: ChiCTR‑PPC‑14005297) was approved by the Chinese Clinical Trial Register and informed consent was obtained from each patient or their family members.
Funding
This project was supported by Chinese National Science Foundation (Nos. 81673518, 81422052), the National key R&D program (No. 2017YFC0909302).
Publisher’s Note
Springer Nature remains neutral with regard to jurisdictional claims in pub‑ lished maps and institutional affiliations.
Received: 16 January 2018 Accepted: 27 March 2018
References
1. Estey E, Dohner H. Acute myeloid leukaemia. Lancet. 2006;368:1894–907. 2. Dohner H, Estey EH, Amadori S, Appelbaum FR, Buchner T, Burnett AK,
et al. Diagnosis and management of acute myeloid leukemia in adults: recommendations from an international expert panel, on behalf of the European LeukemiaNet. Blood. 2010;115:453–74.
3. Wang JJ, Selawry OS, Vietti TJ, Bodey GP Sr. Prolonged infusion of arabino‑ syl cytosine in childhood leukemia. Cancer. 1970;25:1–6.
4. Kumar CC. Genetic abnormalities and challenges in the treatment of acute myeloid leukemia. Genes Cancer. 2011;2:95–107.
5. Boffo S, Damato A, Alfano L, Giordano A. CDK9 inhibitors in acute myeloid leukemia. J Exp Clin Canc Res. 2018;37:36.
6. Miyawaki S, Ohtake S, Fujisawa S, Kiyoi H, Shinagawa K, Usui N, et al. A randomized comparison of 4 courses of standard‑dose multiagent chemotherapy versus 3 courses of high‑dose cytarabine alone in postremission therapy for acute myeloid leukemia in adults: the JALSG AML201 Study. Blood. 2011;117:2366–72.
7. Wiley JS, Jones SP, Sawyer WH, Paterson AR. Cytosine arabinoside influx and nucleoside transport sites in acute leukemia. J Clin Investig. 1982;69:479–89.
8. Yamauchi T, Negoro E, Kishi S, Takagi K, Yoshida A, Urasaki Y, et al. Intracel‑ lular cytarabine triphosphate production correlates to deoxycytidine kinase/cytosolic 5′‑nucleotidase II expression ratio in primary acute myeloid leukemia cells. Biochem Pharmacol. 2009;77:1780–6. 9. Van Rompay AR, Johansson M, Karlsson A. Phosphorylation of nucleo‑
sides and nucleoside analogs by mammalian nucleoside monophos‑ phate kinases. Pharmacol Ther. 2000;87:189–98.
10. Attwood PV, Muimo R. The actions of NME1/NDPK‑A and NME2/NDPK‑B as protein kinases. Lab Invest. 2018;98:283–90.
11. Crisp LB, Smith SM, Mathers MA, Young GA, Lyons SD, Christopherson RI. Effects of cytosine arabinoside on human leukemia cells. Int J Biochem Cell Biol. 1996;28:1061–9.
12. Schneider C, Oellerich T, Baldauf H, Schwarz SM, Thomas D, Flick R, et al. SAMHD1 is a biomarker for cytarabine response and a therapeutic target in acute myeloid leukemia. Nat Med. 2017;23:250–5.
13. Herold N, Rudd SG, Ljungblad L, Sanjiv K, Myrberg IH, Paulin CB, et al. Targeting SAMHD1 with the Vpx protein to improve cytarabine therapy for hematological malignancies. Nat Med. 2017;23:256–63.
14. Whelan J, Smith T, Phear G, Rohatiner A, Lister A, Meuth M. Resistance to cytosine arabinoside in acute leukemia: the significance of mutations in CTP synthetase. Leukemia. 1994;8:264–5.
15. Chimploy K, Tassotto ML, Mathews CK. Ribonucleotide reductase, a possi‑ ble agent in deoxyribonucleotide pool asymmetries induced by hypoxia. J Biol Chem. 2000;275:39267–71.
16. Lamba JK. Genetic factors influencing cytarabine therapy. Pharmacog‑ enomics. 2009;10:1657–74.
17. Xia G, Wang H, Song Z, Meng Q, Huang X, Huang X. Gambogic acid sensitizes gemcitabine efficacy in pancreatic cancer by reducing the expression of ribonucleotide reductase subunit‑M2 (RRM2). J Exp Clin Cancer Res. 2017;36:107.
18. Cao X, Mitra AK, Pounds S, Crews KR, Gandhi V, Plunkett W, et al. RRM1 and RRM2 pharmacogenetics: association with phenotypes in HapMap cell lines and acute myeloid leukemia patients. Pharmacogenomics. 2013;14:1449–66.
19. Minkovsky A, Sahakyan A, Bonora G, Damoiseaux R, Dimitrova E, Rubbi L, et al. A high‑throughput screen of inactive X chromosome reactivation identifies the enhancement of DNA demethylation by 5‑aza‑2′‑dC upon inhibition of ribonucleotide reductase. Epigenetics Chromatin. 2015;8:42. 20. Megías‑Vericat JE, Montesinos P, Herrero MJ, Moscardó F, Bosó V,
Martínez‑Cuadrón D, et al. Influence of cytarabine metabolic pathway polymorphisms in acute myeloid leukemia induction treatment. Leuk Lymphoma. 2017;58:2880–94.
21. Yan H, Zhang DY, Li X, Yuan XQ, Yang YL, Zhu KW, et al. Long non‑coding RNA GAS5 polymorphism predicts a poor prognosis of acute myeloid leukemia in Chinese patients via affecting hematopoietic reconstitution. Leuk Lymphoma. 2017;58:1948–57.
22. Zhang DY, Yan H, Cao S, Zhang W, Li XL, Zeng H, et al. Wilms tumor 1 rs16754 predicts favorable clinical outcomes for acute myeloid leukemia patients in South Chinese population. Leuk Res. 2015;39:568–74. 23. Zhang DY, Yuan XQ, Yan H, Cao S, Zhang W, Li XL, et al. Association
between DCK 35708 T>C variation and clinical outcomes of acute myeloid leukemia in South Chinese patients. Pharmacogenomics. 2016;17:1519–31.
24. Yuan XQ, Zhang DY, Yan H, Yang YL, Zhu KW, Chen YH, et al. Evaluation of DNMT3A genetic polymorphisms as outcome predictors in AML patients. Oncotarget. 2016;7:60555–74.
• We accept pre-submission inquiries
• Our selector tool helps you to find the most relevant journal • We provide round the clock customer support
• Convenient online submission • Thorough peer review
• Inclusion in PubMed and all major indexing services • Maximum visibility for your research
Submit your manuscript at www.biomedcentral.com/submit
Submit your next manuscript to BioMed Central
and we will help you at every step:
26. Yuan XQ, Peng L, Zeng WJ, Jiang BY, Li GC, Chen XP. DNMT3A R882 mutations predict a poor prognosis in AML: a meta‑analysis from 4474 patients. Medicine (Baltimore). 2016;95:e3519.
27. Braunagel D, Schaich M, Kramer M, Dransfeld C, Ehninger G, Mahlknecht U. The T_T genotype within the NME1 promoter single nucleotide poly‑ morphism − 835 C/T is associated with an increased risk of cytarabine induced neurotoxicity in patients with acute myeloid leukemia. Leuk Lymphoma. 2012;53:952–7.
28. Horak CE, Lee JH, Elkahloun AG, Boissan M, Dumont S, Maga TK, et al. Nm23‑H1 suppresses tumor cell motility by down‑regulating the lysophosphatidic acid receptor EDG2. Cancer Res. 2007;67:7238–46. 29. Qu S, Long J, Cai Q, Shu XO, Cai H, Gao YT, et al. Genetic polymorphisms
of metastasis suppressor gene NME1 and breast cancer survival. Clin Cancer Res. 2008;14:4787–93.
30. Yokoyama A, Okabe‑Kado J, Sakashita A, Maseki N, Kaneko Y, Hino K, et al. Differentiation inhibitory factor nm23 as a new prognostic factor in acute monocytic leukemia. Blood. 1996;88:3555–61.
31. Okabe‑Kado J, Kasukabe T, Honma Y, Kobayashi H, Maseki N, Kaneko Y. Extracellular NM23 protein promotes the growth and survival of primary cultured human acute myelogenous leukemia cells. Cancer Sci. 2009;100:1885–94.
32. Cao HX, Miao CF, Yan L, Tang P, Zhang LR, Sun L. Polymorphisms at micro‑ RNA binding sites of Ara‑C and anthracyclines‑metabolic pathway genes are associated with outcome of acute myeloid leukemia patients. J Transl Med. 2017;15:235.
33. Rentoft M, Lindell K, Tran P, Chabes AL, Buckland RJ, Watt DL, et al. Hete‑ rozygous colon cancer‑associated mutations of SAMHD1 have functional significance. Proc Natl Acad Sci USA. 2016;113:4723–8.