R E S E A R C H A R T I C L E
Open Access
Using meta-regression analyses in addition
to conventional systematic review methods
to examine the variation in
cost-effectiveness results
–
a case study
Laura T. Burgers
1,2*, Fleur T. van de Wetering
3, Johan L. Severens
1,2and W. Ken Redekop
1,2Abstract
Background:Systematic reviews of cost-effectiveness analyses summarize results and describe study characteristics. Variability in the study results is often explained qualitatively or based on sensitivity analyses of individual studies. However, variability due to input parameters and study characteristics (e.g., funding or study quality) is often not statistically explained. As a case study, a systematic review on the cost-effectiveness of drug-eluting stents (DES) versus bare-metal stents (BMS) using meta-regression analyses is performed to explore the usefulness of such methods compared with conventional review methods.
Methods:We attempted to identify and review all modelling studies published until January 2012 that compared costs and consequences of DES versus BMS. We extracted general study information (e.g., funding), modelling methods, values of input parameters, and quality of the model using the Philips et al. checklist. Associations between study characteristics and the incremental costs and effectiveness of individual analyses were explored using regression analyses corrected for study ID.
Results:Sixteen eligible studies were identified, with a combined total of 508 analyses. The overall quality of the models was moderate (59 % ± 15 %). This study showed associations (e.g., type of lesion) that were expected (based on individual studies), however the meta-regression analyses revealed also unpredicted associations: e.g., model quality was negatively associated with repeat revascularizations avoided.
Conclusions:Meta-regressions can be of added value, identifying significant associations that could not be
identified using conventional review methods or by sensitivity analyses of individual studies. Furthermore, this study underlines the need to examine input parameters and perform a quality check of studies when interpreting the results.
Keywords:Systematic review, Cost-effectiveness, Stents, Modelling, Meta-regression
Background
Economic evaluations are increasingly used to assist in decision making of interventions. Often for a specific decision problem different economic evaluations are conducted. The results of these studies may differ sub-stantially between studies: from interventions being
dominated to being dominant. Therefore, it is necessary that systematic reviews are performed to summarize the results of the individual economic evaluations. Besides summarizing the study characteristics and results it would be interesting to explain statistically the variability in the incremental costs and incremental effects and thus the conclusions. Differences can exist due to differ-ences in values used for input parameters, perspective, time horizon and other factors. Some differences could easily be explained by the values that were used for the input parameters, since for some input parameters a * Correspondence:[email protected]
1
Institute for Medical Technology Assessment, Erasmus University Rotterdam, Rotterdam, The Netherlands
2Institute of Health Policy & Management, Erasmus University Rotterdam, Rotterdam, The Netherlands
Full list of author information is available at the end of the article
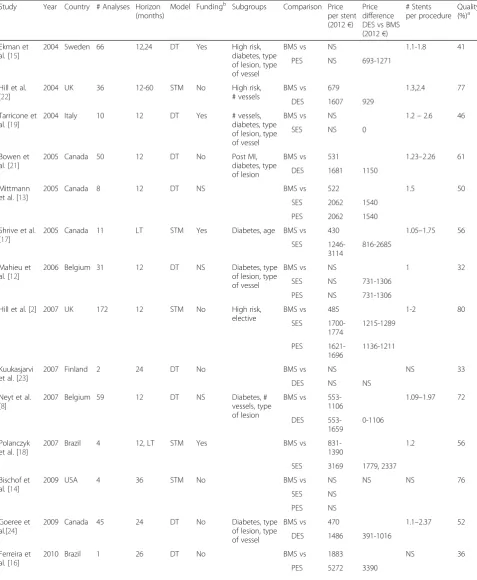
Table 1Description economic evaluations
Study Year Country # Analyses Horizon (months)
Model Fundingb Subgroups Comparison Price per stent (2012€)
Price difference DES vs BMS (2012€)
# Stents per procedure
Quality (%)a
Ekman et al. [15]
2004 Sweden 66 12,24 DT Yes High risk,
diabetes, type of lesion, type of vessel
BMS vs NS 1.1-1.8 41
PES NS 693-1271
Hill et al. [22]
2004 UK 36 12-60 STM No High risk,
# vessels
BMS vs 679 1.3,2.4 77
DES 1607 929
Tarricone et al. [19]
2004 Italy 10 12 DT Yes # vessels,
diabetes, type of lesion, type of vessel
BMS vs NS 1.2–2.6 46
SES NS 0
Bowen et al. [21]
2005 Canada 50 12 DT No Post MI,
diabetes, type of lesion
BMS vs 531 1.23–2.26 61
DES 1681 1150
Mittmann et al. [13]
2005 Canada 8 12 DT NS BMS vs 522 1.5 50
SES 2062 1540
PES 2062 1540
Shrive et al. [17]
2005 Canada 11 LT STM Yes Diabetes, age BMS vs 430 1.05–1.75 56
SES
1246-3114
816-2685
Mahieu et al. [12]
2006 Belgium 31 12 DT NS Diabetes, type
of lesion, type of vessel
BMS vs NS 1 32
SES NS 731-1306
PES NS 731-1306
Hill et al. [2] 2007 UK 172 12 STM No High risk,
elective
BMS vs 485 1-2 80
SES 1700-1774 1215-1289 PES 1621-1696 1136-1211 Kuukasjarvi et al. [23]
2007 Finland 2 24 DT No BMS vs NS NS 33
DES NS NS
Neyt et al. [8]
2007 Belgium 59 12 DT NS Diabetes, #
vessels, type of lesion
BMS vs
553-1106
1.09–1.97 72
DES
553-1659
0-1106
Polanczyk et al. [18]
2007 Brazil 4 12, LT STM Yes BMS vs
831-1390
1.2 56
SES 3169 1779, 2337
Bischof et al. [14]
2009 USA 4 36 STM No BMS vs NS NS NS 76
SES NS
PES NS
Goeree et al.[24]
2009 Canada 45 24 DT No Diabetes, type
of lesion, type of vessel
BMS vs 470 1.1–2.37 52
DES 1486 391-1016
Ferreira et al. [16]
2010 Brazil 1 26 DT No BMS vs 1883 NS 36
linear relationship with the outcomes exists. For ex-ample, an increase in initial intervention costs will lead to an increase in the incremental costs, ceteris paribus. Often these variations are explained by sensitivity ana-lyses of individual studies. Other associations with input parameters that do not have a linear association with the outcome (e.g., probabilities leading to changes in costs and effects) or study characteristics (e.g., funding) could be identified using meta-regression analyses in addition to conventional systematic review methods. Meta-regression analyses are currently used to combine the re-sults of clinical trials and to investigate the effect of methodological diversity of the studies on the results [1]. To explain the variability in the incremental costs and incremental effects of cost-effectiveness analysis (CEA) it could be useful to apply these meta-regression analyses in systematic reviews of economic evaluations.
The aim of this study is to explore the usefulness of meta-regression analyses in systematically explaining the variability in the results compared with conventional re-view methods and sensitivity analyses of individual stud-ies. Meta-regression analyses may be useful if they provide more information, in terms of associations with the outcomes, than conventional systematic reviews and sensitivity analyses. Many economic evaluations have es-timated the cost-effectiveness of drug-eluting stents (DES) versus bare-metal stents (BMS) for the treatment of patients with coronary artery disease. The results be-tween the studies vary considerably, which makes this decision problem a good case study to explore if meta-regression analyses are of added value. Systematic re-views [2–4] on the cost-effectiveness of DES versus BMS have been performed but did not explore statistically the causes of the variability in incremental costs and incre-mental effects between the studies. Associations with the incremental outcomes (costs, quality-adjusted life years and repeat revascularizations avoided) will be identified in this study. Besides the ‘known’factors (e.g., age, type of lesion, price of stents, relative risk repeat revasculari-sations avoided) explaining the cost-effectiveness of DES versus BMS we will identify associations that could only be identified at a meta-level such as the quality of the studies and funding.
Methods
Inclusion and exclusion criteria
A systematic literature search was performed to identify all English-language (online or print) publications (at any time before January 2012) of CEAs using decision analytic models to compare the costs and consequences of DES (sirolimus-eluting stent (SES), paclitaxel-eluting stent (PES), everolimus or zotarolimus-eluting stent (ZES)) versus BMS for patients who require a stent im-plantation due to an atherosclerotic lesion of the coron-ary artery. The effectiveness of the studies had to be expressed in quality adjusted life years (QALY) or in dis-ease specific measures such as repeat revascularizations avoided, TLR (target lesion revascularization) and TVR (target vessel revascularization). Furthermore, studies were only included if they reported results in enough de-tail to enable separation of incremental costs from incre-mental effects. There was no restriction on the perspective used in the economic evaluation. Reviews, editorials and abstracts were not included in the review.
Studies were identified using electronic databases (PubMed, EMbase, NHS EED, Cochrane Library and INAHTA) and by scanning reference lists of eligible arti-cles. The full search strategies for EMbase and PubMed are presented in Additional file 1. To ensure that all relevant publications were identified in the CRD (NHS EED and HTA) and Cochrane Library databases we lim-ited the search terms to “stent” and “stents”. These terms were searched in“any field”for CRD and in“title, abstract, keywords” for Cochrane Library. We also in-cluded the relevant publications found in the reviews by Ligthart et al. [4], Hill et al. [2], and Neyt et al. [3].
Data extraction
[image:3.595.57.539.102.160.2]One reviewer (LB) screened the titles and abstracts iden-tified through the searches. The full text evaluation was performed by two reviewers (LB & FW) and discrepan-cies were discussed and resolved by consensus or by consulting a third reviewer (WR). Various parameters (Tables 1 and 3) were extracted from the relevant publi-cations by one reviewer (LB). The parameters chosen in the regression analyses were the most likely general study characteristics (e.g., population, time horizon, funding) that are reported in conventional systematic Table 1Description economic evaluations(Continued)
Jahn et al. [10,11]
2010 Austria 6 84 DES No Diabetes, type
of lesion
BMS vs NS 1.24 47
DES NS NS
Remak et al. [20]
2010 UK 3 48 STM Yes BMS vs 433 1.11 62
ZES 1175 742 1.12-1.4
a
Philips checklist 2006: scale 0-100 % b
Yes: manufacturer; No: funded by government or not funded
reviews. In addition, we added the most important input parameters (e.g., cost of procedure, relative risk of repeat revascularization, probability of repeat revascularization, utilities) that are used in the model to estimate the cost-effectiveness. These key parameters are often varied in
deterministic sensitivity analyses. Costs were converted to Euros [5] and corrected for inflation if necessary [6] to present the costs as 2012 Euros. Furthermore, we wanted to see if modelling assumptions (e.g., oculo-stenotic effect) were of influence on the incremental
[image:4.595.64.538.155.703.2]outcomes. All assumptions reported in the studies were monitored. Lastly, two reviewers (LB & FW) independ-ently assessed the quality of the models using the Philips et al. checklist [7] for the assessment of model-based economic analyses. The Philips checklist is a framework based on existing guidelines on the use of decision ana-lytic modelling in health technology assessments. The checklist is structured in three themes: a) structure, which focusses on the scope and mathematical structure; b) data, which examines data identification and uncer-tainty methods; and c) consistency, which assesses the overall quality of the model based on the publication. Both overall study quality and the quality per theme were given a score from 0-100 %, which was calculated by dividing the sum of the questions answered positively by the total number of relevant questions. Since some questions were not relevant for all studies (e.g., ques-tions concerning quality-of-life values) the denominator could differ between studies.
Analysis
The influence of modelling methods, the choice of pa-rameters and the quality of the models on the main out-comes (incremental costs, incremental QALYs and absolute risk reduction repeat revascularizations) were
analysed both quantitatively and qualitatively.
Associations between parameters and the outcomes were assessed by identifying outliers found on cost-effectiveness planes. Furthermore, several bivariate linear regressions were estimated to confirm the associations and also to measure the influence of other parameters on the outcomes. Including associations that could be predicted beforehand (e.g., type of lesion, price stent) are included in the regression analyses since it could be seen as a validation check if the analyses also show these as-sociations. Multivariate analyses with all of the parame-ters that were significant in the bivariate analyses could not be performed due to a high frequency of missing values caused by incomplete reporting.
We included every subgroup or sensitivity analysis found in a study as long as incremental costs or incre-mental effectiveness were provided or could be calcu-lated. As a result, our meta-regression analyses were based on many more observations than the number of studies that were included. Since Hill et al. [2] provided more than 30 % of the observations used in our study; we incorporated study ID as a random effect in the re-gression models. Some studies reported both incremen-tal effects and incremenincremen-tal QALYs for a specific analysis. Since the incremental costs associated with both out-comes is the same we only included one of the two ana-lyses for the regression anaana-lyses on the incremental
[image:5.595.57.539.415.710.2]costs to avoid double counting. Data management and all statistical analyses were performed with SPSS 19.0 (SPSS Inc., Chicago, IL, USA). The level of measurement was ordinal or ratio, depending on the covariate. The model assumptions and study characteristics (e.g., fund-ing) were measured at an ordinal scale. Input parameters such as the probability of repeat revascularization were measured at a ratio scale. Conclusions about statistical significant were based on an alpha level of 5 %.
[image:6.595.56.538.371.700.2]Results
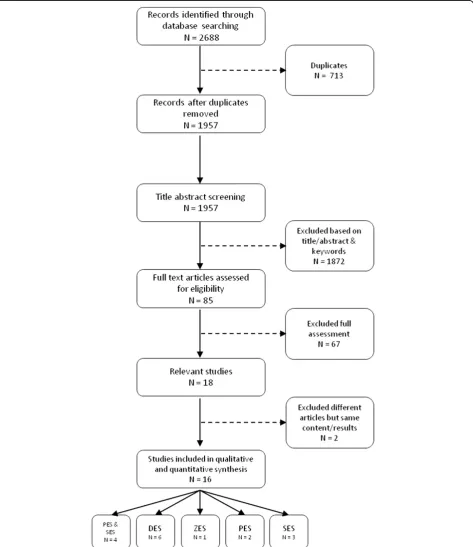
Figure 1 presents the process of identifying relevant publi-cations in line with PRISMA guidelines (Additional file 2). Of the 1957 potentially relevant publications, 1872 were excluded based on title, abstract and keywords. Full-text evaluation was performed for 85 articles leading to 18 relevant studies. Reasons to exclude studies after a full text assessment were: lack of a model (n= 24), no original CEA (n= 22), language other than English (n= 8), no rele-vant outcome (n= 6), comparator not BMS (n= 4), and re-sults were not presented at a disaggregated level (n= 3). In one case, we found that a full report [8] and a paper [9]
reported results from the same analyses; data was there-fore extracted from the full report. In another case, we found two papers with the same content and results and considered them as one paper [10, 11].
The 16 eligible studies were divided into five groups based on the type of DES that was evaluated and accounted for 498 separate analyses (Table 1). Four stud-ies calculated the incremental cost-effectiveness ratio (ICER) for both PES and SES [2, 12–14], two studies [15, 16] focused on PES, three studies focused only on SES [17–19], and one study used ZES as the intervention [20]. The remaining six publications [8, 10, 11, 21–24] did not specifically identify the type of eluting drug under evaluation and calculated an ICER for a DES in general,
Descriptive characteristics
In most analyses, DES was more expensive (88 % of ana-lyses) and more effective in both QALYs and repeat re-vascularizations avoided (99 % of analyses) than BMS. Most of the 16 studies [2, 8, 10, 11, 14, 16, 21, 23] con-cluded that DES is not cost-effective for all subgroups since the incremental QALYs did not offset the
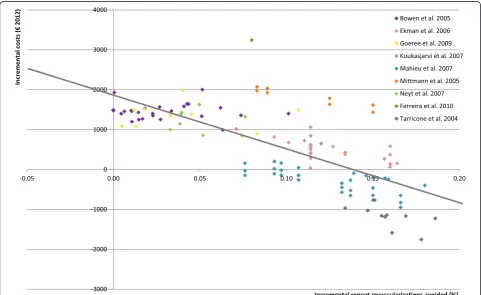
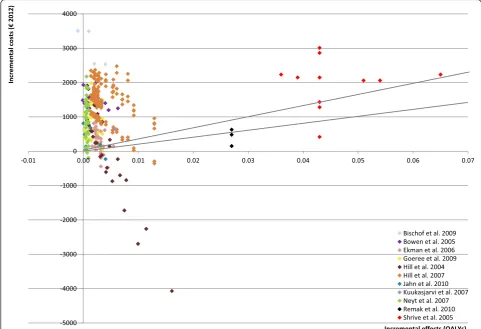
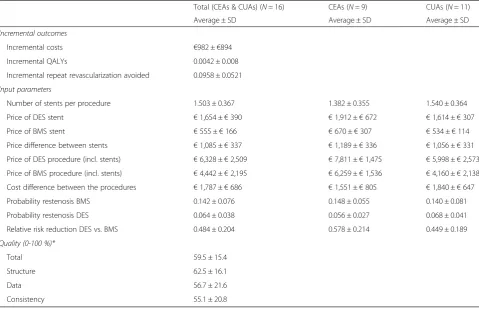
incremental costs. However, many concluded that DES was more cost-effective in high-risk patients. The ICER varied considerably between and within studies: from DES being dominated by BMS [14, 21] to DES being dominant in specific analyses [2, 8, 10, 11, 15, 19, 22]. Figs. 2 and 3 present the variability of the incremental costs and effects of the studies using repeat revasculari-zations avoided or QALYs as an outcome measure, re-spectively. The mean values of input parameters stratified by the type of study outcome are presented in Table 2.
We also assessed the quality of the models of all stud-ies using the Philips et al. [7] checklist. Studstud-ies appeared to score higher on the theme structure (63 % ± 16 %) than on the other two themes, data (57 % ± 22 %) and consistency (55 % ± 21 %). The average overall quality of the models was moderate (59 % ± 15 % of a maximum possible score of 100 %).
Outcome repeat revascularizations avoided
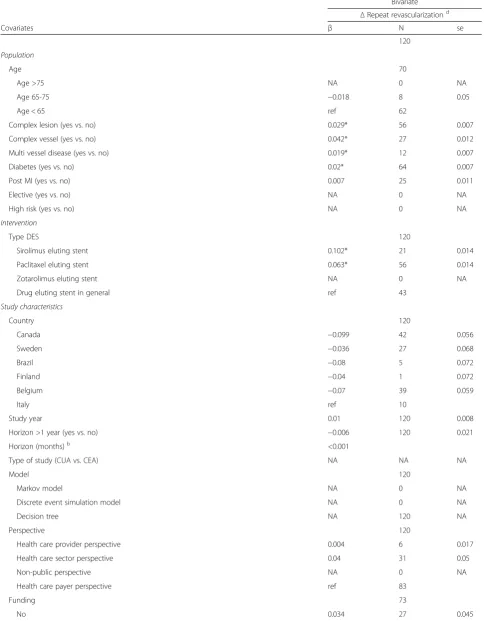
Based on 124 separate analyses (9 studies), the num-ber of repeat revascularizations avoided (the absolute risk reduction in repeat revascularizations) with DES also varied considerably (Fig. 2) between and within studies (range: −0.0001, 0.19), which resulted in
variation in the ICERs. The overall conclusions of most of the studies corresponded with the 124 separ-ate analyses (Table 3). The regression analyses showed that the relative risk reduction of repeat revasculariza-tions and the initial probabilities of restenosis were positively associated with repeat revascularizations avoided. Furthermore, a more complex vessel or le-sion was associated with higher relative risk reduction and initial risk of restenosis after a percutaneous cor-onary intervention with BMS. Consequently, this leads to an increase in repeat revascularizations avoided and DES becomes more effective. Furthermore, the number of stents was also positively and significantly associated with repeat revascularizations avoided, probably because it is a proxy for subgroups who have a higher risk of developing restenosis due to dia-betes, lesions and vessels characteristics. These factors could have been predicted beforehand since subgroup analyses and sensitivity analyses of the individual studies show the same conclusions.
Besides these factors that could be predicted before-hand, with the meta-regression analyses we were able to find a negative association between overall quality of a model and repeat revascularizations avoided.
Fur-thermore, the theme data was also negatively
Table 2Averages economic evaluations (univariate analyses)
Total (CEAs & CUAs) (N= 16) CEAs (N= 9) CUAs (N= 11)
Average ± SD Average ± SD Average ± SD
Incremental outcomes
Incremental costs €982 ±€894
Incremental QALYs 0.0042 ± 0.008
Incremental repeat revascularization avoided 0.0958 ± 0.0521
Input parameters
Number of stents per procedure 1.503 ± 0.367 1.382 ± 0.355 1.540 ± 0.364
Price of DES stent €1,654 ±€390 €1,912 ±€672 €1,614 ±€307
Price of BMS stent €555 ±€166 €670 ±€307 €534 ±€114
Price difference between stents €1,085 ±€337 €1,189 ±€336 €1,056 ±€331
Price of DES procedure (incl. stents) €6,328 ±€2,509 €7,811 ±€1,475 €5,998 ±€2,573
Price of BMS procedure (incl. stents) €4,442 ±€2,195 €6,259 ±€1,536 €4,160 ±€2,138
Cost difference between the procedures €1,787 ±€686 €1,551 ±€805 €1,840 ±€647
Probability restenosis BMS 0.142 ± 0.076 0.148 ± 0.055 0.140 ± 0.081
Probability restenosis DES 0.064 ± 0.038 0.056 ± 0.027 0.068 ± 0.041
Relative risk reduction DES vs. BMS 0.484 ± 0.204 0.578 ± 0.214 0.449 ± 0.189
Quality (0-100 %)*
Total 59.5 ± 15.4
Structure 62.5 ± 16.1
Data 56.7 ± 21.6
Consistency 55.1 ± 20.8
*N= 16 studies
Table 3Associations between incremental revascularizations and covariates–DES vs BMSa
Bivariate ΔRepeat revascularizationd
Covariates β N se
120
Population
Age 70
Age >75 NA 0 NA
Age 65-75 −0.018 8 0.05
Age < 65 ref 62
Complex lesion (yes vs. no) 0.029* 56 0.007
Complex vessel (yes vs. no) 0.042* 27 0.012
Multi vessel disease (yes vs. no) 0.019* 12 0.007
Diabetes (yes vs. no) 0.02* 64 0.007
Post MI (yes vs. no) 0.007 25 0.011
Elective (yes vs. no) NA 0 NA
High risk (yes vs. no) NA 0 NA
Intervention
Type DES 120
Sirolimus eluting stent 0.102* 21 0.014
Paclitaxel eluting stent 0.063* 56 0.014
Zotarolimus eluting stent NA 0 NA
Drug eluting stent in general ref 43
Study characteristics
Country 120
Canada −0.099 42 0.056
Sweden −0.036 27 0.068
Brazil −0.08 5 0.072
Finland −0.04 1 0.072
Belgium −0.07 39 0.059
Italy ref 10
Study year 0.01 120 0.008
Horizon >1 year (yes vs. no) −0.006 120 0.021
Horizon (months)b <0.001
Type of study (CUA vs. CEA) NA NA NA
Model 120
Markov model NA 0 NA
Discrete event simulation model NA 0 NA
Decision tree NA 120 NA
Perspective 120
Health care provider perspective 0.004 6 0.017
Health care sector perspective 0.04 31 0.05
Non-public perspective NA 0 NA
Health care payer perspective ref 83
Funding 73
associated with this incremental outcome. Conse-quently, models with a higher quality led to less favourable results for DES.
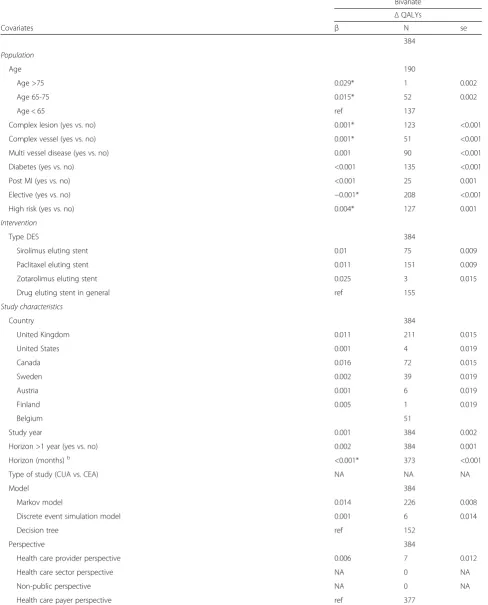
Outcome of incremental QALYs
[image:9.595.57.538.95.643.2]Figure 3 presents the incremental QALYs and incremen-tal costs for 384 separate cost-effectiveness analyses (11 Table 3Associations between incremental revascularizations and covariates–DES vs BMSa(Continued)
Yes 46
Both Industry and No industry NA 0 NA
Industry 0.102* 37 0.046
No industry ref 9
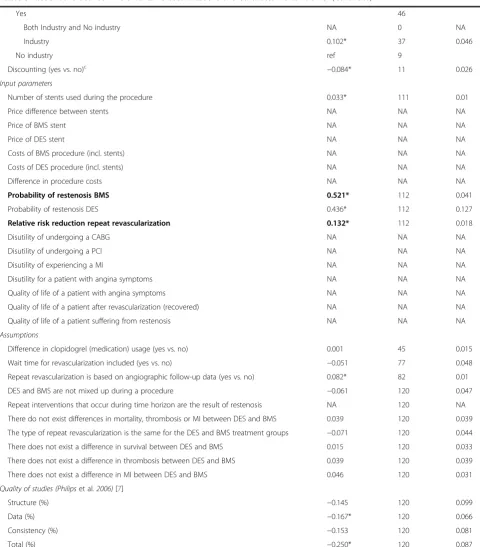
Discounting (yes vs. no)c −0.084* 11 0.026
Input parameters
Number of stents used during the procedure 0.033* 111 0.01
Price difference between stents NA NA NA
Price of BMS stent NA NA NA
Price of DES stent NA NA NA
Costs of BMS procedure (incl. stents) NA NA NA
Costs of DES procedure (incl. stents) NA NA NA
Difference in procedure costs NA NA NA
Probability of restenosis BMS 0.521* 112 0.041
Probability of restenosis DES 0.436* 112 0.127
Relative risk reduction repeat revascularization 0.132* 112 0.018
Disutility of undergoing a CABG NA NA NA
Disutility of undergoing a PCI NA NA NA
Disutility of experiencing a MI NA NA NA
Disutility for a patient with angina symptoms NA NA NA
Quality of life of a patient with angina symptoms NA NA NA
Quality of life of a patient after revascularization (recovered) NA NA NA
Quality of life of a patient suffering from restenosis NA NA NA
Assumptions
Difference in clopidogrel (medication) usage (yes vs. no) 0.001 45 0.015
Wait time for revascularization included (yes vs. no) −0.051 77 0.048
Repeat revascularization is based on angiographic follow-up data (yes vs. no) 0.082* 82 0.01
DES and BMS are not mixed up during a procedure −0.061 120 0.047
Repeat interventions that occur during time horizon are the result of restenosis NA 120 NA
There do not exist differences in mortality, thrombosis or MI between DES and BMS 0.039 120 0.039 The type of repeat revascularization is the same for the DES and BMS treatment groups −0.071 120 0.044
There does not exist a difference in survival between DES and BMS 0.015 120 0.033
There does not exist a difference in thrombosis between DES and BMS 0.039 120 0.039
There does not exist a difference in MI between DES and BMS 0.046 120 0.031
Quality of studies (Philipset al.2006)[7]
Structure (%) −0.145 120 0.099
Data (%) −0.167* 120 0.066
Consistency (%) −0.153 120 0.081
Total (%) −0.250* 120 0.087
a
Corrected for study;b
Shrive et al. & Remak et al. [17,20] not included (lifetime horizon);c
only studies with a time horizon longer than 1 year included; d
incremental repeat revascularization avoided; *pvalue < 0.05
studies). This Figure shows that Shrive et al. [17] and Remak et al. [20] clearly found a larger incremental QALY gain than the other studies.
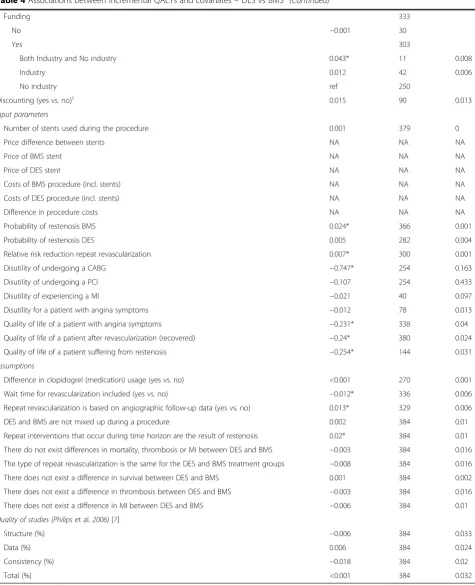
Again, the meta-regression analyses found associations with incremental QALYs that were expected (Table 4). Relative risk reduction of repeat revascularizations and the initial probability of restenosis after BMS were asso-ciated with a greater QALY gain, as seen in individual sensitivity analyses [2, 14, 15, 21, 22, 24]. Furthermore, analyses showed that non-elective patients, patients with a high risk of a repeat revascularization, patients with complex vessels or lesions or older patients will benefit more from DES, something that was also recognised in the individual studies [2, 12, 17, 21, 24]. In addition, we found a significant positive association between time horizon (continuous) and incremental QALYs. This was also found by Hill et al. [22] and Ekman et al. [15] who varied the time horizon in the sensitivity analyses.
Studies [2, 17] that have explicitly mentioned that they have assumed that the occurrence of repeat revasculari-zations within the time horizon is the result of restenosis and studies assuming that repeat revascularization rates are based on angiographic follow-up have estimated sig-nificantly higher incremental QALYs. Angiographic follow-up leads to inflated estimates of clinical effective-ness compared with clinical follow-up since not clinically significant restenosis results in “unnecessary” repeat re-vascularizations when angiographic follow-up is
per-formed. Consequently, the difference in repeat
revascularizations will be overestimated (oculo-stenotic effect) [25]. Some studies use“real-world”[8, 10, 11, 21] follow-up data and consequently report lower estimates (visible in Figs. 2 and 3) than other studies such as, Remak et al. [20] that used angiographic follow-up [12, 15, 17, 23]. This phenomenon is described earlier by Eisenberg et al. [26], who concluded that cost-effectiveness studies using angiographic follow-up overestimate the cost-effectiveness of DES.
The meta-regression analyses showed that studies using real-world evidence compared with angiographic follow-up leads to a reduction in incremental QALY gain. The added value of meta-regression analyses is lim-ited in explaining the variation in incremental QALYs, although it identified modelling assumptions that were significantly associated with incremental QALYs.
Outcome incremental costs
Figures 2 and 3 show that there was large variation in incremental costs (range: €-4070 to €3506). Regression analyses (Table 5) confirmed associations (cost parame-ters and population characteristics) that were seen in the individual studies [2, 8, 12, 17, 20, 21, 24]. The analyses showed that probability of restenosis after BMS, the re-duction in restenosis risk by DES, the difference in stent
price, and the number of stents used were important pa-rameters influencing the incremental costs. Both input parameters varied considerably between the analyses: the difference in stent costs ranged from€0 [8, 19] to€2685 [17] and the number of stents varied between 1 [22] and 2.6 [19] stents per procedure depending on the type of patient.
On a meta-level we were able to conclude that funding and the type of cost-effectiveness analysis was associated with incremental costs. Funding was provided by the stent manufacturer in five [15, 17–20] of the 16 studies and three of them [15, 17, 20] concluded that DES was cost-effective compared with BMS. Of the studies that were notfunded by a manufacturer(N= 8) only one [10, 11] of them concluded that DES could be cost-effective. Studies that were not funded estimated on average higher incremental costs than studies that were (p< 0.05). Furthermore, some associations with incremental costs are recognised from scenario analyses performed by studies. The directions of the following associations are confirmed by the regression analysis but not signifi-cant. According to Jahn et al. [10, 11] it is important to incorporate wait time into the model since it leads to a decrease (−734, 95 % CI:-1690;223) in incremental costs. A time horizon shorter than 12 months was associated with higher incremental costs (479, 95 % CI: −1024;65); Hill et al. [22] estimated costs and effects for different time horizons and showed that a longer time horizon led to lower incremental costs. This is likely because of the continuing treatment effect of DES in the subse-quent years which would increase in the number of re-peat revascularizations avoided compared with BMS. This increase in reduction of repeat revascularization would further offset the cost of the initially more expen-sive DES.
Meta-regression analyses showed also that the number of repeated revascularizations avoided explained a large proportion of variation (R2= 0.53). As shown in Fig. 2, there appeared to be a linear association between incre-mental costs and repeat revascularizations avoided. In-cremental QALYs (Fig. 3), on the other hand, was not associated with incremental costs (R2= 0.001), probably since incremental QALYs are determined by several fac-tors including repeat revascularizations avoided, life-years gained and quality of life values.
Discussion
Table 4Associations between incremental QALYs and covariates–DES vs BMSa
Bivariate ΔQALYs
Covariates β N se
384
Population
Age 190
Age >75 0.029* 1 0.002
Age 65-75 0.015* 52 0.002
Age < 65 ref 137
Complex lesion (yes vs. no) 0.001* 123 <0.001
Complex vessel (yes vs. no) 0.001* 51 <0.001
Multi vessel disease (yes vs. no) 0.001 90 <0.001
Diabetes (yes vs. no) <0.001 135 <0.001
Post MI (yes vs. no) <0.001 25 0.001
Elective (yes vs. no) −0.001* 208 <0.001
High risk (yes vs. no) 0.004* 127 0.001
Intervention
Type DES 384
Sirolimus eluting stent 0.01 75 0.009
Paclitaxel eluting stent 0.011 151 0.009
Zotarolimus eluting stent 0.025 3 0.015
Drug eluting stent in general ref 155
Study characteristics
Country 384
United Kingdom 0.011 211 0.015
United States 0.001 4 0.019
Canada 0.016 72 0.015
Sweden 0.002 39 0.019
Austria 0.001 6 0.019
Finland 0.005 1 0.019
Belgium 51
Study year 0.001 384 0.002
Horizon >1 year (yes vs. no) 0.002 384 0.001
Horizon (months)b <0.001* 373 <0.001
Type of study (CUA vs. CEA) NA NA NA
Model 384
Markov model 0.014 226 0.008
Discrete event simulation model 0.001 6 0.014
Decision tree ref 152
Perspective 384
Health care provider perspective 0.006 7 0.012
Health care sector perspective NA 0 NA
Non-public perspective NA 0 NA
Table 4Associations between incremental QALYs and covariates–DES vs BMSa(Continued)
Funding 333
No −0.001 30
Yes 303
Both Industry and No industry 0.043* 11 0.008
Industry 0.012 42 0.006
No industry ref 250
Discounting (yes vs. no)c 0.015 90 0.013
Input parameters
Number of stents used during the procedure 0.001 379 0
Price difference between stents NA NA NA
Price of BMS stent NA NA NA
Price of DES stent NA NA NA
Costs of BMS procedure (incl. stents) NA NA NA
Costs of DES procedure (incl. stents) NA NA NA
Difference in procedure costs NA NA NA
Probability of restenosis BMS 0.024* 366 0.001
Probability of restenosis DES 0.005 282 0.004
Relative risk reduction repeat revascularization 0.007* 300 0.001
Disutility of undergoing a CABG −0.747* 254 0.163
Disutility of undergoing a PCI −0.107 254 0.433
Disutility of experiencing a MI −0.021 40 0.097
Disutility for a patient with angina symptoms −0.012 78 0.013
Quality of life of a patient with angina symptoms −0.231* 338 0.04
Quality of life of a patient after revascularization (recovered) −0.24* 380 0.024
Quality of life of a patient suffering from restenosis −0.254* 144 0.031
Assumptions
Difference in clopidogrel (medication) usage (yes vs. no) <0.001 270 0.001
Wait time for revascularization included (yes vs. no) −0.012* 336 0.006
Repeat revascularization is based on angiographic follow-up data (yes vs. no) 0.013* 329 0.006
DES and BMS are not mixed up during a procedure 0.002 384 0.01
Repeat interventions that occur during time horizon are the result of restenosis 0.02* 384 0.01 There do not exist differences in mortality, thrombosis or MI between DES and BMS −0.003 384 0.016 The type of repeat revascularization is the same for the DES and BMS treatment groups −0.008 384 0.016
There does not exist a difference in survival between DES and BMS 0.001 384 0.002
There does not exist a difference in thrombosis between DES and BMS −0.003 384 0.016
There does not exist a difference in MI between DES and BMS −0.006 384 0.01
Quality of studies (Philipset al.2006)[7]
Structure (%) −0.006 384 0.033
Data (%) 0.006 384 0.024
Consistency (%) −0.018 384 0.02
Total (%) <0.001 384 0.032
a
Corrected for study;b
Shrive et al. & Remak et al. [17,20] not included (lifetime horizon);c
only studies with a time horizon longer than 1 year included; *pvalue < 0.05
Table 5Associations between incremental costs and covariates–DES vs BMSa
Bivariate ΔCosts (2012€)
Covariates β N se
437
Population
Age 190
Age >75 315 1 901
Age 65-75 −31 52 695
Age < 65 ref 137
Complex lesion (yes vs. no) 172* 134 85
Complex vessel (yes vs. no) −5 62 116
Multi vessel disease (yes vs. no) 122 98 200
Diabetes (yes vs. no) −217* 150 78
Post MI (yes vs. no) −88 25 88
Elective (yes vs. no) 346* 208 109
High risk (yes vs. no) −291 127 193
Intervention
Type DES 437
Sirolimus eluting stent 551 100 636
Paclitaxel eluting stent 379 180 636
Zotarolimus eluting stent −324 3 1321
Drug eluting stent in general ref 154
Study characteristics
Country 437
United Kingdom 2147* 211 836
United States 4425* 4 1050
Canada 2922* 79 808
Sweden 1745 39 1016
Brazil 3444* 5 932
Austria 1752 6 1035
Finland 2051 1 1174
Belgium 1698 82 879
Italy ref 10
Study year −190 437 137
Horizon >1 year (yes vs. no) −479 437 277
Horizon (months)b −32* 414 6
Type of study (CUA vs. CEA) −194* 507 86
Model 437
Markov model 613 230 611
Discrete event simulation model −435 6 1219
Decision tree ref 201
Perspective 437
Health care provider perspective 266 14 363
Health care sector perspective −1332 31 1151
Non-public perspective −1057 2 670
Table 5Associations between incremental costs and covariates–DES vs BMSa(Continued)
Funding 347
No 1480* 31 634
Yes 316
Both Industry and No industry 1246 11 1041
Industry −621 56 663
No industry ref 249
Discounting (yes vs. no)c 1071 91 713
Input parameters
Number of stents used during the procedure 708* 424 83
Price difference between stents 1.264* 418 0.13
Price of BMS stent 0.503* 320 0.354
Price of DES stent 1.001* 312 0.152
Costs of BMS procedure (incl. stents) 0.339* 278 0.092
Costs of DES procedure (incl. stents) 0.412* 278 0.053
Difference in procedure costs 0.799* 278 0.075
Probability of restenosis BMS −3072* 407 322
Probability of restenosis DES −1907* 323 899
Relative risk reduction repeat revascularization −1676* 341 250
Disutility of undergoing a CABG NA NA NA
Disutility of undergoing a PCI NA NA NA
Disutility of experiencing a MI NA NA NA
Disutility for a patient with angina symptoms NA NA NA
Quality of life of a patient with angina symptoms NA NA NA
Quality of life of a patient after revascularization (recovered) NA NA NA
Quality of life of a patient suffering from restenosis NA NA NA
Assumptions
Difference in clopidogrel (medication) usage (yes vs. no) 181 279 216
Wait time for revascularization included (yes vs. no) −733 347 486
Repeat revascularization is based on angiographic follow-up data (yes vs. no) −593 372 492
DES and BMS are not mixed up during a procedure −542 437 741
Repeat interventions that occur during time horizon are the result of restenosis 855 437 841
There do not exist differences in mortality, thrombosis or MI between DES and BMS −980 437 878 The type of repeat revascularization is the same for the DES and BMS treatment groups 501 437 1187
There does not exist a difference in survival between DES and BMS −238 437 426
There does not exist a difference in thrombosis between DES and BMS −589 437 754
There does not exist a difference in MI between DES and BMS −595 437 665
Quality of studies (Philipset al.2006)[7]
Structure (%) 2154 437 1819
Data (%) 1670 437 1318
Consistency (%) 718 437 1463
Total (%) 2761 437 1804
a
Corrected for study;b
Shrive et al. & Remak et al. [17,20] not included (lifetime horizon);c
only studies with a time horizon longer than 1 year included; *
pvalue < 0.05
study characteristics, input parameters and outcomes. However, it is not possible to statistically determine if the association actually exists, which covariates explains the variation best, to correct for interactions or to pre-dict the incremental outcomes. This case study was inspired by meta-analyses of treatment effectiveness studies that are frequently performed to obtain a single summary estimate. More interesting than meta-analyses are meta-regression analyses that try to relate the size of treatment effect to one or more characteristics of the in-cluded studies [1]. Using meta-regression analyses to ex-plore the associations between incremental outcomes and input parameters is unique for a systematic review of economic evaluations and could help to explain vari-ation in cost-effectiveness outcomes between studies. We used meta-regression analyses to explain the vari-ability in the outcomes of cost-effectiveness studies (i.e., incremental costs and effects) of DES versus BMS and found that, besides confirming associations that could be predicted from individual studies, associations at a meta-level also exist, such as an association between outcomes and the quality of the models.
The most important factors that were associated with the results were patient characteristics (age, vessel, le-sion), procedure (type of stent and elective versus non-elective), specific input parameters (number of stents per procedure, cost per stent/procedure, restenosis risk with BMS and the efficacy of DES) and the quality of the models. Many of these associations had already been re-ported in the studies themselves, which can be seen as evidence that the meta-regression produced valid results. However, besides these previously reported associations, we also found associations between study outcomes and the quality of the model, time horizon, efficacy assump-tions, and funding which could only be identified at a
‘meta level’. Moreover, this review identified an associ-ation between the incremental costs and absolute risk reduction in repeat revascularizations on ‘meta-level’ (Fig. 2) showing the added value of meta-regression analyses.
Some of the associations we found are desirable since they involve parameters that influence the results and that can be controlled by clinicians and policymakers. For example, factors like the costs of a stent are ex-pected to be associated with the results. Other factors such as patient characteristics can be changed by means of patient selection. However, the presence of other as-sociations such as the quality of the models,
assump-tions, time horizon or funding raises concerns.
Moreover, other parameters were not significantly asso-ciated with outcomes (e.g., wait time and incremental costs, or funding and incremental QALYs). These pa-rameters could have influenced the outcomes but are undesirable since e.g., funding should not play a role in
the outcomes of the study. It is important for authors to follow the recommendations of the ISPOR-SMDM task force for modelling good research practices [27] and the recommendations based on the Philips et al. checklist [7] for modelling studies to increase the quality of the study and generalizability of the results.
Limitations
Despite the fact that the quality of the models was assessed by two independent reviewers it was difficult to judge the quality due to subjectivity of the questions; this problem was been recognized in the past [28]. Fur-thermore, to provide studies with a score between 0 and 100 % we needed to assume that all questions of the checklist were equally important. Thus studies could ob-tain a reasonably high score if less informative/important questions were fulfilled. In addition, the quality of the models was based on the documentation of the model and therefore it is possible that studies that scored low did not transparently present model details, however the actual model could be of high quality. Regardless of these limitations, we found a statistically significant as-sociation between quality and the outcome repeat revascularization.
Furthermore, title abstract screening was performed by one reviewer which could be seen as a limitation of the study. However, checks of whether the studies in-cluded in previously published reviews were also identi-fied with the search, increased the sensitivity of the search and thereby reduced the chance of missing rele-vant publications. Full assessment and assessing the quality of the model using the Philips checklist was per-formed by two reviewers independently.
Another limitation of our study is that all 508 analyses were analysed as independent observations even though in reality these 508 analyses were based on 16 studies. We have used study identification number as a random effect in the regression models to address this problem.
In this case study, linear regression models were used to estimate the associations of study characteristics on the outcomes (incremental costs, incremental QALYs and repeat revascularizations avoided) since the number of observations was large. However, regression models could be improved by first considering if the dependent variable (e.g., incremental costs) can best be modelled using a different function (e.g., gamma).
future meta-regression analyses since it leads to false positive outcomes.
In addition, transparency in documentation is a major issue leading to a high frequency of missing values that made it impossible to perform multivariate analyses with all of the parameters that were significant in the bivariate analyses. Consequently, we were unable to: 1) take into ac-count interaction effects, 2) determine the most influential covariates, and 3) create a prediction model. A solution could be to include a smaller number of input parameters with only common input parameters (e.g., cost of proced-ure, time horizon etc.). However, this will lead to fewer as-sociations between outcomes and covariates.
Transparent reporting is crucial in this field and would solve the problem of missing values for systematic re-views such as this. A recently published review on the challenges of modelling the cost-effectiveness of cardio-vascular disease interventions has recognized the same problem [29].
Lastly, we did not include the studies published after January 2012. However, we expect that including newer studies that met inclusion criteria (i.e., estimating the cost-effectiveness of DES versus BMS using modelling methods) do not have an impact on the results of our case study showing that using meta-regression analyses could be useful method in addition to conventional sys-tematic reviews.
To improve this case study lessons can be learned from meta-regression analyses and meta-analyses that are performed for the clinical effectiveness of interven-tions. More specifically, it could provide guidance in how to handle missing data [30], how to treat study het-erogeneity, how to include covariate interaction [31]. In addition, it shows limitations of the methods [1].
Conclusions
This study has showed that meta-regression analyses can be used to explore relationships between study charac-teristics and cost-effectiveness outcomes and can draw from the methodology used in other fields even though it is not yet fully developed. Compared with conven-tional review methods or sensitivity analyses of individ-ual studies meta-regression analyses can be of added value since it identifies significant associations that could not be identified before. The quality of the models was associated with the outcomes of the studies and there-fore it is important that a quality check is performed be-fore interpreting the results of the study.
Additional files
Additional file 1:Search string.(DOCX 15 kb)
Additional file 2:PRISMA guidelines.(PDF 514 kb)
Abbreviations
BMS:Bare-metal stents; CEA: Cost-effectiveness analysis; DES: Drug-eluting stents; ICER: Incremental cost-effectiveness ratio; PES: Paclitaxel-eluting stent; QALY: Quality-adjusted life years; SES: Sirolimus-eluting stent; TLR: Target lesion revascularization; TVR: Target vessel revascularization; ZES: Zotarolimus-eluting stent.
Competing interests
The authors declare that they have no competing interests.
Authors’contributions
LB has developed the search strategies, performed title/abstract selection, full text assessment and data-analysis, interpreted the results, and has drafted the manuscript. FW has performed full text assessment, helped in the pretation of the results and drafted the manuscript. JS helped in the inter-pretation of the results and drafted the manuscript. WR helped in the interpretation of the results and drafted the manuscript. All authors read and approved the final manuscript.
Acknowledgement
This work was supported by grants from the Center for Translational Molecular Medicine (CTMM), Circulating Cells project (grant 01C-102) and the Dutch Heart Foundation.
Author details
1Institute for Medical Technology Assessment, Erasmus University Rotterdam, Rotterdam, The Netherlands.2Institute of Health Policy & Management, Erasmus University Rotterdam, Rotterdam, The Netherlands.3Cochrane Netherlands, Julius Center for Health Sciences and Primary Care, University Medical Center Utrecht, Utrecht, The Netherlands.
Received: 25 February 2015 Accepted: 11 December 2015
References
1. Thompson SG, Higgins JP. How should meta-regression analyses be undertaken and interpreted? Stat Med. 2002;21(11):1559–73.
2. Hill RA, Boland A, Dickson R, Dundar Y, Haycox A, McLeod C, et al. Drug-eluting stents: a systematic review and economic evaluation. Health Technol Assess. 2007;11(46):1–242.
3. Neyt M, Van Brabandt H, Devriese S, De Laet C. Cost-effectiveness analyses of drug eluting stents versus bare metal stents: A systematic review of the literature. Health Policy. 2009;91(2):107–20.
4. Ligthart S, Vlemmix F, Dendukuri N, Brophy JM. The cost-effectiveness of drug-eluting stents: A systematic review. Can Med Assoc J.
2007;176(2):199–205.
5. Purchasing Power Parities and exchange rate for OECD countries. 2011; Available at: http://stats.oecd.org/Index.aspx?DataSetCode=SNA_TABLE4. Accessed January 15, 2011.
6. Statistics Netherlands. Consumer price index. 2012; Available at: http:// statline.cbs.nl/StatWeb/publication/?VW=T&DM=SLNL&PA=71311ned& D1=a&D2=0&D3=12,25,38,51,64,77,90,103,116,129,142,155,168,181-220&HD=120217-1502&HDR=G1,T&STB=G2, 2012.
7. Philips Z, Bojke L, Sculpher M, Claxton K, Golder S. Good practice guidelines for decision-analytic modelling in health technology assessment: a review and consolidation of quality assessment. Pharmacoeconomics. 2006;24(4):355–71.
8. Neyt M, Van Brabandt H, Devriese S, Mahieu J, De Ridder A, De Graeve D, et al. Drug Eluting Stents in Belgium: Health Technology Assessment. Health Technology Assessment (HTA). Bruxelles: Belgian Health Care Knowledge Centre (KCE); 2007. KCE reports 66C (D/2007/10.273/49). https://kce.fgov.be/ sites/default/files/page_documents/d20071027349.pdf.
9. Neyt M, De Laet C, De Ridder A, Van Brabandt H. Cost Effectiveness of Drug-Eluting Stents In Belgian Practice Healthcare Payer Perspective. Pharmacoeconomics. 2009;27(4):313–27.
10. Jahn B, Pfeiffer KP, Theurl E, Tarride JE, Goeree R. Capacity Constraints and Cost-Effectiveness: A Discrete Event Simulation for Drug-Eluting Stents. Med Decis Mak. 2010;30(1):16–28.
12. Mahieu J, de Ridder A, de Graeve D, Vrints C, Bosmans J. Economic analysis of the use of drug-eluting stents from the perspective of Belgian health care. Acta Cardiol. 2007;62(4):355–65.
13. Mittmann N, Brown A, Seung SJ, Coyle D, Cohen E, Brophy J, et al. Economic evaluation of drug eluting stents [Technology report no 53]. Ottawa: Canadian Coordinating Office for Health Technology Assessment; 2005. https://www.cadth.ca/media/pdf/272_drug_eluting_stents_tr_e.pdf. 14. Bischof M, Briel M, Bucher HC, Nordmann A. Cost-Effectiveness of
Drug-Eluting Stents in a US Medicare Setting: A Cost-Utility Analysis with 3-Year Clinical Follow-Up Data. Value Health. 2009;12(5):649–56.
15. Ekman M, Sjogren I, James S. Cost-effectiveness of the Taxus paclitaxel-eluting stent in the Swedish healthcare system. Scand Cardiovasc J. 2006;40(1):17–24.
16. Ferreira E, Araujo DV, Azevedo VM, Rodrigues CV, Ferreira Jr A, Junqueira Cde L, et al. Analysis of the cost-effectiveness of drug-eluting and bare-metal stents in coronary disease. Arq Bras Cardiol. 2010;94(3):286–92. 306–12.
17. Shrive FM, Manns BJ, Galbraith PD, Knudtson ML, Ghali WA. Economic evaluation of sirolimus-eluting stents. CMAJ. 2005;172(3):345–51. 18. Polanczyk CA, Wainstein MV, Ribeiro JP. Cost-effectiveness of
sirolimus-eluting stents in percutaneous coronary interventions in Brazil. Arq Bras Cardiol. 2007;88(4):464–74.
19. Tarricone RR. What reimbursement for coronary revascularization with drug-eluting stents? Eur J Health Econ. 2004;5(4):309–16.
20. Remak E, Manson S, Hutton J, Brasseur P, Olivier E, Gershlick A. Cost-effectiveness of the Endeavor stent in de novo native coronary artery lesions updated with contemporary data. Euro Intervention. 2010;5(7):826–32. 21. Bowen J, Hopkins R, He Y, Blackhouse G, Lazzam C, Tu J, et al. Systematic
review and cost-effectiveness analysis of drug eluting stents compared to bare metal stents for percutaneous coronary interventions in Ontario. Interim Report for the Ontario Ministry of Health and Long-term Care. Hamilton, ON: Program for Assessment of Technology in Health, McMaster University; 2005. http://www.path-hta.ca/Libraries/Reports/DESreport.sflb.ashx
22. Hill R, Bagust A, Bakhai A, Dickson R, Dundar Y, Haycox A. Coronary artery stents: a rapid systematic review and economic evaluation. Health Technol Assess. 2004;8(35):1–256.
23. Kuukasjarvi P, Rasanen P, Malmivaara A, Aronen P, Sintonen H. Economic evaluation of drug-eluting stents: A systematic literature review and model-based cost-utility analysis. Int J Technol Assess Health Care.
2007;23(4):473–9.
24. Goeree R, Bowen JM, Blackhouse G, Lazzam C, Cohen E, Chiu M, et al. Economic evaluation of drug-eluting stents compared to bare metal stents using a large prospective study in Ontario. Int J Technol Assess Health Care. 2009;25(2):196–207.
25. Ruygrok PN, Melkert R, Morel MAM, Ormiston JA, Bar FW, Fernandez-Aviles F, et al. Does angiography six months after coronary intervention influence management and outcome? J Am Coll Cardiol. 1999;34(5):1507–11. 26. Eisenberg MJ. Drug-eluting stents - The price is not right. Circulation. 2006;
114(16):1745–54.
27. Caro JJ, Briggs AH, Siebert U, Kuntz KM. ISPOR-SMDM Modeling Good Research Practices Task Force. Modeling good research practices–overview: a report of the ISPOR-SMDM Modeling Good Research Practices Task Force– 1. Value Health. 2012;15(6):796–803.
28. Handels RL, Wolfs CA, Aalten P, Joore MA, Verhey FR, Severens JL. Diagnosing Alzheimer’s disease: A systematic review of economic evaluations. Alzheimers Dement. 2014;10(2):225-37.
29. Burgers LT, Redekop WK, Severens JL. Challenges in Modelling the Cost Effectiveness of Various Interventions for Cardiovascular Disease. Pharmacoeconomics. 2014;32(7):627-37.
30. Higgins JPT, White IR, Wood AM. Imputation methods for missing outcome data in meta-analysis of clinical trials. Clin Trials. 2008;5(3):225–39. doi:10. 1177/1740774508091600.
31. Donegan S, Williams L, Dias S, Tudur-Smith C, Welton N. Exploring treatment by covariate interactions using subgroup analysis and meta-regression in cochrane reviews: a review of recent practice. PLoS One. 2015;10(6):e0128804.
32. Council for Public Health and Health Care (RVZ). Fair and sustainable care. 2006. http://www.raadrvs.nl/uploads/docs/Advies_-_Zinnige_en_duurzame_ zorg.pdf.
• We accept pre-submission inquiries
• Our selector tool helps you to find the most relevant journal
• We provide round the clock customer support
• Convenient online submission
• Thorough peer review
• Inclusion in PubMed and all major indexing services • Maximum visibility for your research
Submit your manuscript at www.biomedcentral.com/submit