Int. J. Electrochem. Sci., 8 (2013) 9125 - 9132
International Journal of
ELECTROCHEMICAL
SCIENCE
www.electrochemsci.orgInfluence of the Carbon/Anode Interaction on Direct Carbon
Conversion in a SOFC
P. Desclaux1, H.C. Schirmer1, M. Woiton2, E. Stern2, M. Rzepka1,*
1
ZAE Bayern, Division 1, Walther-Meißner-Str. 6, 85748 Garching, Germany
2
ZAE Bayern, Division 3, Haberstr. 2a, 91058 Erlangen, Germany
*
E-mail: [email protected]
Received: 19 April 2013 / Accepted: 31 May 2013 / Published: 1 July 2013
The influence of the physical and chemical fuel properties on the performance of a direct carbon fuel cell, based on a SOFC (solid oxide fuel cell) system, is tested at 850 °C. Using six different carbon samples, the experimental results show a clear dependence of both open circuit voltage (OCV) and maximum power density. This second parameter is dependent on the internal structure of the carbon material, such as particle size, specific surface area and degree of crystallinity. Moreover a variation of the force, pressing the carbon film against the anode layer, results in a reproducible variation of the OCV showing that the density of contact points with the active carbon atoms governs the electrochemical performance of a solid fuel / solid anode DCFC.
Keywords: DCFC, SOFC, carbon conversion, carbon/anode interaction, carbon activity.
1. INTRODUCTION
Utilization of carbon in high temperature fuel cells offers at medium term the possibility to directly convert the chemical energy of carbon materials into electricity. This fuel can be particularly suitable due to its abundant amount and because solid carbon-based materials are easy to store as well as to transport. Carbon fuel is present in different forms, such as hard coal, charcoal or carbonized biomass. In addition, as the main product at the anode is carbon dioxide it makes sequestration easy. Therefore, a negative carbon dioxide balance is even possible if the fuel materials are derived from biomass [1].
In the last decades, different DCFC concepts have been developed by several research groups. They are classified according to the employed electrolyte type as follows [2,3]: two possible liquid salt electrolytes (molten carbonate [4] or molten hydroxide [5]) and a solid oxide electrolyte (ceramic layer) [6,7]. Recently, also combined technologies have been developed and investigated [8-13].
In this work, direct carbon conversion is studied in a solid oxide fuel cell. In principle, four different reactions can be involved in the overall anode process. Three of them are electrochemical oxidation reactions (four and two electron process, respectively), whereas the reverse Boudouard reaction is a purely chemical reaction (Eq. 4) [5, 8, 12]:
C + O2 → CO2 (1)
C + ½O2 → CO (2)
CO + ½O2 → CO2 (3)
C + CO2 ↔ 2CO (4)
In this paper we study the influence of the fuel properties on the cell performance. Button cells without any additional anode layers are used in the experimental setup to investigate the direct conversion of carbon. Under these conditions, Eq. (3) should be negligible due to the non-porous surface of the YSZ electrolyte, in accordance to the experimental results of Nürnberger et al. [6].
2. EXPERIMENTAL
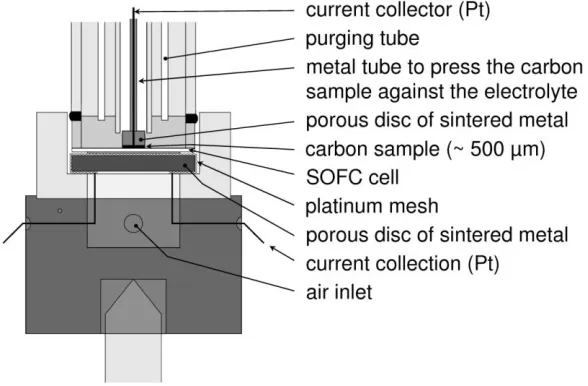
The DCFC experimental setup, based on a SOFC system, is shown in figure 1. The system is maintained at 850 °C using a tubular furnace. The oxide ceramic cells are electrolyte-supported and have a planar design. The cell is placed in a ceramic holder on a porous disc of sintered metal (Hastelloy X®) at the cathode side. The anode chamber is sealed by pressing the smooth-polished surface of a glass ceramic tube (Macor®) against the electrolyte layer with a contact pressure of about 0.17 Nmm-². In addition, a nitrogen flow rate of 300 mLmin-1 is applied to remove minimal concentrations of the residual gas in the anode chamber. The carbon sample is introduced from the top through the internal alumina tube up to the surface of the cell. For that, a thin layer of carbon powder (approx. 500 µm) is pressed against a porous disc of Hastelloy X® (diameter of 9 mm). 15 to 30 mg are used for each sample, depending of the carbon material with a porosity of about 70 %. The cell is contacted at both sides with a platinum mesh. At the bottom side, the mesh is located on the porous disc of sintered metal and is directly in contact with the cathode layer. In the anode chamber, the current is collected through the carbon sample, using the electronic conductivity of the fuel. The contact pressure applied between the carbon fuel and the cell can be controlled by an external spring system. Typically, 0.27 Nmm-2 are applied.
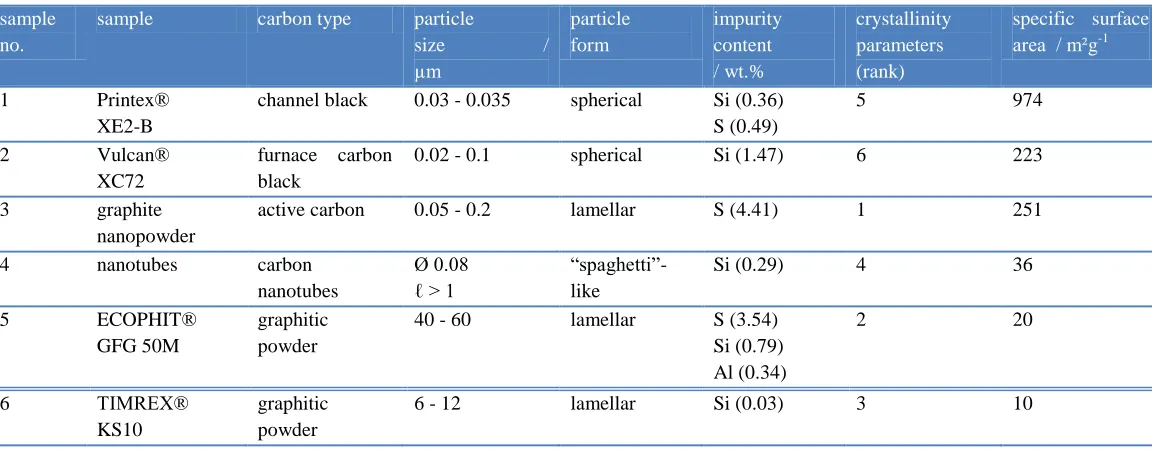
Six different carbon fuels are used in this work, which differ in morphology, particle size and degree of crystallinity. In advance, they have been analyzed using TEM, EDX, XRD and the BET method. Their properties are presented in Table 1. All the samples show a very high carbon content from 96 to more than 99 %. Traces of sulfur, silicate and aluminum have been detected, which are usual impurities in high carbon-based materials, partly because of their fabrication processes. Samples no. 1 and 2 are both carbon blacks: Printex® XE2-B (Evonik Degussa GmbH) and Vulcan® XC72 (Cabot Corporation). An active carbon powder of graphite containing nanoparticles (SGL Carbon), as well as carbon nanotubes (MER Corporation) have also been tested (samples no. 3 and 4, respectively). In addition, two graphitic powders were measured (samples no. 5 and 6). ECOPHIT® GFG 50M and TIMREX® KS10 have been provided by SGL Carbon and Timcal Group, respectively. Samples 1 to 4 show nanometric particles, whereas the particle size of both graphitic samples are in the range of some micrometers. Moreover, high specific surface areas were measured for the active carbon black “Printex® XE2-B” (up to 1000 m2
g-1) as well as both materials “Vulcan® XC72” and “graphite nanopowder” (220–250 m2g-1). On the contrary, the specific surface area of the other samples is very poor (not exceeding 40 m2g-1). By the XRD analysis, it has been found that the graphitic samples (no. 3, 5 and 6) show a very high degree of crystallinity. This is in contrast to both carbon blacks and the nanotube powder (samples 1, 2 and 4, respectively) which show the structure of amorphous carbon.
[image:3.596.152.446.507.700.2]A potentiostat “Autolab PGSTAT 302N” by Deutsche METROHM GmbH & Co. KG was used to measure both current and voltage of the cell, as well as to perform electrochemical impedance spectroscopy (EIS). The current-voltage characteristics were obtained potentiostatically by applying a constant voltage value in the system and taking the current value after stabilization of the system (about 10 s) for each potential step. Applying different external pressures, the measured values of open circuit voltage (OCV) were stable within ± 0.01 V. The EIS measurements were performed over the frequency range of 0.1 MHz to 1 mHz at a potential corresponding of the OCV value.
Table 1. Physical and chemical properties of the different used carbon materials.
sample no.
sample carbon type particle size / µm particle form impurity content / wt.% crystallinity parameters (rank)
specific surface area / m²g-1
1 Printex®
XE2-B
channel black 0.03 - 0.035 spherical Si (0.36) S (0.49)
5 974
2 Vulcan®
XC72
furnace carbon black
0.02 - 0.1 spherical Si (1.47) 6 223
3 graphite
nanopowder
active carbon 0.05 - 0.2 lamellar S (4.41) 1 251
4 nanotubes carbon
nanotubes
Ø 0.08 ℓ > 1
“spaghetti”-like
Si (0.29) 4 36
5 ECOPHIT®
GFG 50M
graphitic powder
40 - 60 lamellar S (3.54) Si (0.79) Al (0.34)
2 20
6 TIMREX®
KS10
graphitic powder
6 - 12 lamellar Si (0.03) 3 10
3. RESULTS
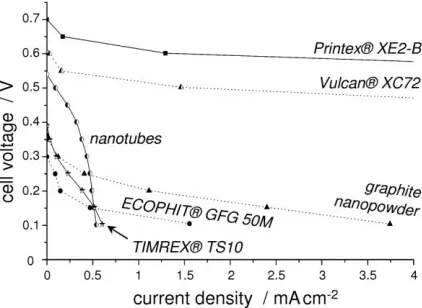
Measurements of I-V curves were performed for all carbon materials (see Table 1) at an operating temperature of 850 °C. In Fig. 2 the results are shown after I-R correction with the ohmic resistivity, determined for each sample by electrochemical impedance spectroscopy. As can be seen the OCV value and the maximum current density strongly depend on the carbon properties. Both carbon black materials (Printex® XE2-B as well as Vulcan® XC72) show outstanding performance in comparison to the other samples, which are displayed in a larger magnification in Fig. 3. The measured current densities are only located in the range of 0 to 4 mAcm-2.
Figure 2. I-V curves of the YSZ-based cells operating at 850 °C with the six different carbon samples; gas flow rates: 300 mLmin-1 of nitrogen and 150 mLmin-1 of synthetic air.
Figure 3. Data of Fig. 2 for a current density range of 0 to 4 mAcm-2.
In Fig. 3, the measured values of the open circuit voltage are much lower than the thermodynamic equilibrium voltage for standard concentrations (1.03 V for the complete oxidation of carbon). Moreover, the OCV value depends on the carbon material. For each sample (no. 1 to 6) following values were obtained: 0.70, 0.61, 0.36, 0.54, 0.30 and 0.40 V, respectively. This may be attributed to the special case of the electrochemical carbon/anode interaction which influences the effective carbon activity by providing only single isolated contact points. This will be discussed in more detail in section 4.
[image:5.596.193.404.300.454.2][image:6.596.188.404.151.312.2]
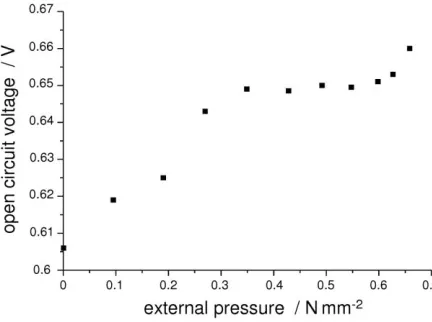
distinct increase of the OCV value from 0.61 to 0.66 V is observable for external pressures between 0 and 0.66 Nmm-2. A plateau value of about 0.65 V is reached for pressures over 0.27 Nmm-2. Thus, the external pressure applied on the sample significantly influences the value of the open circuit voltage.
Figure 4. Influence of the external pressure, applied on the sample, on the measured value of the open circuit voltage; used carbon fuel: Vulcan® XC72; operating temperature: 850 °C; gas flow rates: 300 mLmin-1 of nitrogen and 150 mLmin-1 of synthetic air.
4. DISCUSSION
As stated in the introduction, the carbon oxidation can occur in a single direct oxidation process or in a two step process via the reverse Boudouard reaction followed by a subsequent electrochemical conversion of CO at the anode. However, this latter process may be strongly suppressed due to the smooth non-porous anode. This is confirmed by the experimental results given in [6]. Moreover, the strong dependence of the cell performance on the sample properties (see Fig. 3) shows that the reaction step involving the carbon fuel is the rate-determining step. On the other side, the reverse Boudouard reaction takes place on a large surface area where carbon dioxide is in contact with the three-dimensional structure of the porous carbon fuel, giving some evidence that this is not the rate-determining step compared to the subsequent CO oxidation on the flat anode. Therefore, the strong dependence of the cell performance on the carbon properties shows that the direct oxidation of the solid carbon material dominates the overall process at the anode.
In the thermodynamic equilibrium, a good approximation of the open circuit potential for partial and complete carbon oxidations can be given by the Nernst equations:
2 2 2 0 2 , 0 ln 4 ) ( ) ( CO O C CO C CO C p p a F RT T U T
U (5)
CO O C CO C CO C p p a F RT T U T U 5 . 0 2 0 , 0 ln 2 ) ( )
( (6)
[image:7.596.161.439.291.517.2]
850 °C the associated values of the thermodynamic standard voltage are 1.03 and 1.09 V for Eqs. (5) and (6), respectively. In this work, the measured OCV values vary between 0.3 to 0.7 V, which is in accordance with the published values of other groups working on the same DCFC concept with utilization of carbon blacks as carbon fuel: about 0.7 V using “Vulcan XC72” [13,14] and approx. 0.78 V using “Printex® 90” by Evonik Degussa GmbH [15]. Therefore, there is some evidence that these low OCV values are no coincidence but should be attributed to the special characteristics of the analyzed system with a solid-solid contact at the interface carbon/anode. Usually, the carbon fuel is considered like a pure solid (ideal graphite) and its activity is taken as aC = 1. Considering this activity value, the low measured OCV values can be hardly explained by the Nernst equations (5) or (6). This may be attributed to the fact that, in the point-like solid-solid contact, no equilibrium is established or that the electrochemical activity of the carbon fuel is lower than one, such as in the comparable situation of submonolayers of active materials [16].
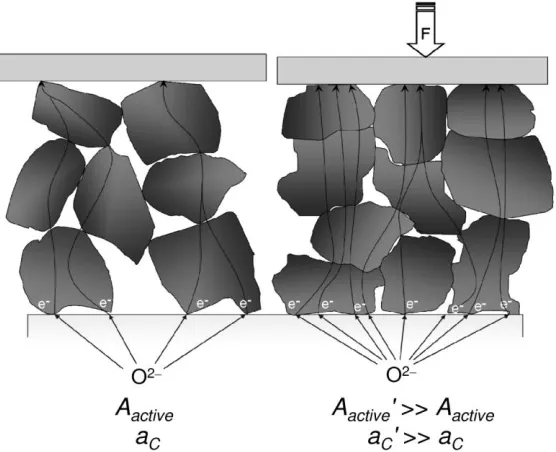
Figure 5. Schematic representation of the effect of an applied contact pressure on the carbon particles, leading to a higher contact surface with the anode and thus enhancing the carbon activity. In addition, the fuel material shows a better electronic conductivity and thus a higher current collection through the sample is possible.
5. CONCLUSIONS
In this work, it has been shown that the electrochemical performance of a DCFC, based on a SOFC system, strongly depends on the interaction between the carbon fuel and the anode. This is influenced by (i) the physical and chemical properties of the used material, such as degree of crystallinity, particle size or specific surface area, as well as by (ii) the force which is applied to press the carbon particles against the anode side of the electrolyte. Thus, the overall density of active carbon atoms in direct contact with the anode may play an important role, as it varies with both physical and chemical properties and can be externally influenced by increasing contact pressure between the carbon fuel film and the anode layer.
ACKNOWLEDGEMENT
The experimental work at ZAE Bayern has been financially supported by the Arbeitsgemeinschaft industrieller Forschungsvereinigungen „Otto von Guericke“ e.V (AiF) under grant number „IGF-Vorhaben 16507 N“, in the context of a development program of the Industrielle Gemeinschaftsforschung (IGF) from the Bundesministerium für Wirtschaft und Technologie in Germany.
References
1. P. Desclaux, S. Nürnberger and U. Stimming, in R. Steinberger-Wilckens and W. Lehnert (Eds.), Innovations in Fuel Cell Technologies, RSC Publishing, Cambridge, 2010, p. 190.
2. P. Desclaux, M. Rzepka, U. Stimming and R. Hempelmann, J. Phys. Chem. (2012) in press, DOI: 10.1524/zpch.2012.0253.
3. A. C. Rady, S. Giddey, S. P. S. Badwal, B. P. Ladewig and S. Bhattacharya, Energy Fuels, 26 (2012) 1471.
4. N. J. Cherepy, R. Krueger, K.J. Fiet, A. F. Jankowski and J. F. Cooper, J. Electrochem. Soc., 152 (2005) A80.
5. S. Zecevic, E. M. Patton and P. Parhami, Carbon, 42 (2004) 1983.
6. S. Nürnberger, R. Bußar, P. Desclaux, B. Franke, M. Rzepka and U. Stimming, Energy Environ. Sci., 3 (2010) 150.
7. R. Z. Liu, C. H. Zhao, J. L. Li, F. R. Zeng, S. R. Wang, T. L. Wen and Z. Y. Wen, J. Power Sources, 195 (2010) 480.
8. D. Cao, Y. Sun and G. Wang, J. Power Sources, 167 (2007) 250.
9. T. M. Gür, M. Homel and A. V. Virkar, J. Power Sources, 195 (2010) 1085.
10.T. Tao, M. Koslowske, J. Brodie and J. Bentley, Abstract #472, 220th ESC Meeting, Boston, MA, USA, Oct. 9-14, 2011.
11.K. Hemmes and M. Cassir, in proceedings Second International Conference on Fuel Cell Science, Engineering and Technology, ASME, Rochester, NY, USA, June 14-16, 2004, p. 395.
12.S. L. Jain, Y. Nabae, B. J. Lakeman, K. D. Pointon and J. T. S. Irvine, Solid State Ion., 179 (2008) 1417.
13.C. R. Jiang and J. T. S. Irvine, J. Power Sources, 196 (2011) 7318.
14.A. Kulkarni, S. Giddey and S. P. S. Badwal, Solid State Ion., 194 (2011) 46. 15. M. G. Werhahn, O. Schneider and U. Stimming, ESC Trans. (2013) in press.
16.J. Barbier, in G. Ertl, H. Knözinger, J. Weitkamp (Eds.), Preparation of Solid Catalysts, WILEY-VCH, Weinheim, 1999, pp. 526.