Int. J. Electrochem. Sci., 8 (2013) 5213 - 5222
International Journal of
ELECTROCHEMICAL
SCIENCE
www.electrochemsci.org
Structural and Morphological Characteristics of
Copper-Alumina Nano-Composite
N. M. Deraz
Chemistry Department, College of Science, King Saud University, P.O. Box 2455, Riyadh 11451, Saudi Arabia.
E-mail: [email protected]
Received: 24 February 2013 / Accepted: 14 March 2013 / Published: 1 April 2013
The crystallite size, lattice constant and unit cell volume of copper- alumina nano- composite were determined by X-ray diffraction (XRD) technique. Various phases of copper supported on alumina were prepared in this study by combustion route. The morphological properties of as prepared copper- alumina were studied by scanning electron micrographs (SEM) technique. The results revealed that the combustion method led to formation of different copper phases with various valences depending upon the amount of fuel. The change in amount of fuel affects formation and crysatllinity of products. The as synthesized materials have spongy and fragile characteristics.
Keywords: XRD; SEM, Cu, Cu2O, CuO, nano- particles.
1. INTRODUCTION
attract the most attention because of their wide spread applications. Copper oxides are used in thin- film oxygen pressure sensors, as a binder in pastes for thick-film microelectronic circuits, as a p-type semiconductor, and they exhibit luminescence [5, 6]. But the most important application of copper oxide particles is as high surface area catalysts that are used in diverse experimental and industrial processes [7-10].
In the light of fast and growing applications of metallic copper and copper oxides nano-particles, a reproductive method of synthesis with a specific size, well defined surface composition, isolable and re-dispersible properties remains a challenging task to a synthetic chemist. The ability to scale up the synthesis to bulk scale will gain increasing importance as more applications are established. However, most of the synthetic methods either yielded particles of irregular shape with wide size distribution and required high temperature and pressure condition or produced particles with reduced catalytic activity and inability to reuse the particles [11].
In the current study, we aim to prepare copper- alumina nano- composite via glycine-assisted combustion method. Another goal for this investigation is the study of the effect of glycine content on the structural and morphological properties of the as prepared Cu/Al nano-composite. The techniques employed were XRD and SEM.
2. EXPERIMENTAL 2.1. Materials
Five samples of Cu/Al mixed oxides were prepared by mixing calculated proportions of copper and aluminum nitrates with different amounts of glycine. The mixed precursors were concentrated in a porcelain crucible on a hot plate at 400 oC for 5 minutes. The crystal water was gradually vaporized during heating and when a crucible temperature was reached, a great deal of foams produced and spark appeared at one corner which spread through the mass, yielding a brown voluminous and fluffy product in the container. In our experiment, the ratios of the glycine: aluminum: copper nitrates were (0, 2, 4, 6 and 8): 1: 2 for S1, S2, S3, S4 and S5 samples, respectively. In other words, the ratios of glycine to metal nitrates (G/N) were 0.00, 0.67, 1.33, 2.00 and 2.67 for S1, S2, S3, S4 and S5 samples. The chemicals employed in the present work were of analytical grade supplied by Fluke Company.
2.2. Techniques
An X-ray measurement of various mixed solids was carried out using a BRUKER D8 advance diffractometer (Germany). The patterns were run with Cu K radiation at 40 kV and 40 mA with scanning speed in 2 of 2 ° min-1.
The crystallite size of copper phases present in the investigated solids was based on X-ray diffraction line broadening and calculated by using Scherrer equation [12].
(1)
where d is the average crystallite size of the phase under investigation, B is the Scherrer constant (0.89), is the wave length of X-ray beam used, is the full-with half maximum (FWHM) of diffraction and is the Bragg's angle.
Scanning electron micrographs (SEM) were recorded on SEM-JEOL JAX-840A electron microanalyzer (Japan). The samples were dispersed in ethanol and then treated ultrasonically in order disperse individual particles over a gold grids.
3. RESULTS
3.1. Structural analysis
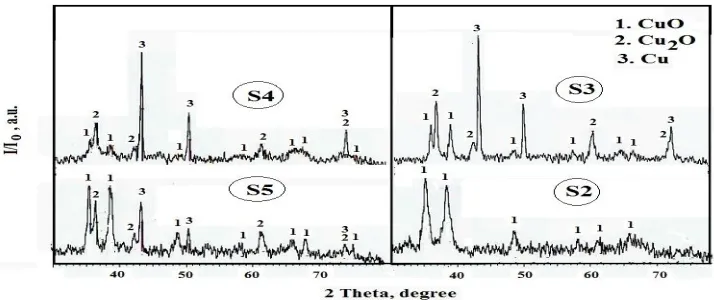
The preliminary investigation of the S1 sample showed that this sample consisted entirely of amorphous materials which may be copper and aluminum oxides and/or Cu-Al- O compound. The XRD pattern for S2, S3, S4 and S5 samples are given in Fig. 1. Study of this figure revealed that:
Figure 1. XRD patterns for the S1, S2, S3, S4 and S5 samples.
(i) The S2 sample consisted of moderate crystalline CuO particles as a single phase. This indicates that the presence of small amount of glycine (G/N = 0.67) led to crystallization of CuO particles (Tenorite, Monoclinic). (ii) The S3, S4 and S5 samples contain different phases of copper crystallites that are Cu, Cu2O and CuO. This means that the presence of high amounts of glycine
during the preparation process of Cu/Al composite resulted in reduction of some CuO to produce Cu (Cubic) and Cu2O (Cuprite, Cubic) phases. When the G/N ratio was 1.33 or 2, the major phase was
[image:3.596.118.475.370.520.2]
CuAlO2 particles. Indeed, the increase of G/N ratio from 1.33 to 2.67 resulted in a decrease in the peak
height of metallic copper phase. Also, the increase of G/N ratio from 1.33 to 2.00 led to a decrease in the peaks height of both CuO and Cu2O phases. Opposite behavior was observed for previous phases
[image:4.596.69.533.244.356.2]by increasing the G/N ratio up to 2.67. So, the increase in the G/N ratio affects the size and formation of products. In other words, judicious adjustment of the metal precursor- to-fuel ratio can control the size of reacting oxides and their solid reaction producing CuAl2O4 and CuAlO2 nano-particles.
Table 1. The effect of glycine content on the height of some diffraction lines for the crystalline phase involved in the as prepared.
Samples Crystalline
Phases
Peak height (a. u.)
CuO (0.232nm) Cu2O (0.246nm) Cu (0.209nm)
S1 S2 S3 S4 S5 - CuO
CuO, Cu2O, Cu
CuO, Cu2O, Cu
CuO, Cu2O, Cu
- 47 46 16 54 - - 70 34 43 - - 139 89 41
3.2. The size control of copper nano- crystals
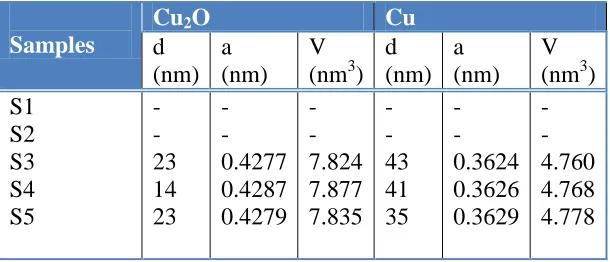
The change in the ratio of glycine to metal nitrates brought about different changes in the crystallite size (d) of different copper phases as shown in Table 2. However, Table 2 shows the lattice constant (a) and unit cell volume (V) of Cu and Cu2O nano- particles depending upon the X-ray data.
Table 2. Some structural parameters of cubic copper phases.
Cu Cu2O
Samples V
(nm3) a
(nm) d
(nm) V
(nm3) a (nm) d (nm) - - 4.760 4.768 4.778 - - 0.3624 0.3626 0.3629 - - 43 41 35 - - 7.824 7.877 7.835 - - 0.4277 0.4287 0.4279 - - 23 14 23 S1 S2 S3 S4 S5
The increase in the glycine content brought about slightly changes in the values of crystallite size, lattice constant and unit cell volume of Cu2O nano-crystals. On the other hand, this increase led to
[image:4.596.147.452.520.651.2]
3.3. The morphology study
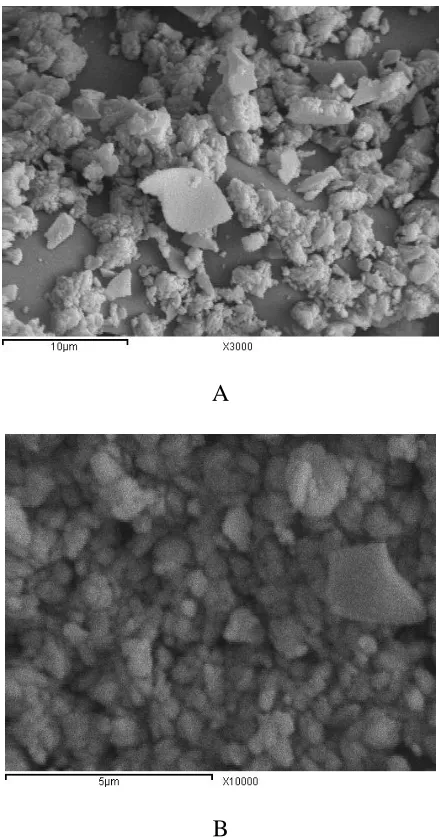
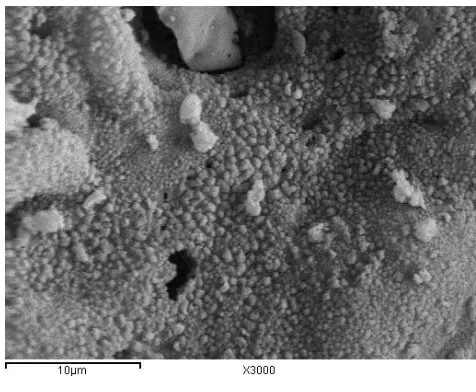
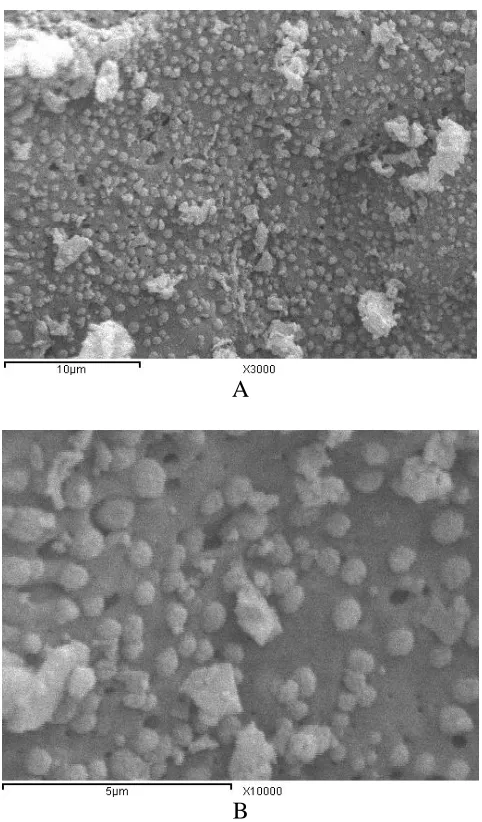
The figures from 2A-B to 5A-B show the SEM images for S1, S2, S3 and S5 samples with different magnifications. The S1 sample contains agglomerated nano-particles. Addition of different amounts of glycine during the preparation process led to formation of spongy and fragile materials (the S2, S3 and S5 samples) containing voids and pores as shown in Figs 3-5. These voids and pores could be attributed to the release of large amounts of gases during combustion process depending upon the decomposition of glycine and copper and aluminum nitrates. In fact, the particle size of the S3 sample is higher than that of other samples. This confirms in Tables 1 and 2 depending upon the increase in the peaks height and crystallite size of the S3 sample. Also, we can be seen from the different SEM images that the agglomeration of the nano-particles of Cu/Al composite decreases as the G/N ratio increases. However, the increase in the G/N ratio brought about an increase in the homogeneity of particles for the composite studied.
A
B
[image:5.596.188.408.316.735.2]
A
[image:6.596.178.416.549.745.2]B
Figure 3. SEM image of the S2 sample with different magnifications.
[image:7.596.177.418.68.272.2]
B
Figure 4. SEM image of the S3 sample with different magnifications.
A
[image:7.596.178.419.325.736.2]B
4. DISCUSSION
Most metals exhibit high thermal conductivity depending upon the presence of free electrons. In addition, the electrical resistance of ceramics is usually high due to the lack of free electrons. However, heat transfer in ceramics occurs through the vibration of phonons. Combining thermally conductive metal and electrically insulating ceramic to form ceramic/metal aluminates may provide both high thermal conductance and high electrical resistance. But the ceramic/metal interface may act as a barrier to heat transfer [13]. The thermal resistance of the interface depends on its microstructure characteristics and the bonding technology employed. Many bonding techniques are available to bond alumina and copper. The solubility of oxygen in copper is very low. For example, it is only 0.03 at% at 1065 oC [14, 15]. As the amount of oxygen is higher than the solubility, Cu2O is formed first then the
CuO [16].
The chemical and structural relations of the Cu-Al-O system are more complex. Two oxides of copper can form in air: CuO (melaconite or tenorite) is the stable room-temperature oxide where the Cu ion is in the +2 valence state. Cu2O (cuprite) where the Cu ion is in the +1 valence state is
thermodynamically stable above 1020 °C. However, there are also two stable copper aluminates that can form in the C u-Al-O system: Cu(II)A12O4 (spinel structure) and Cu(I)A1O2 (delafossite structure)
[17]. Phase equilibrium relations in the Cu2O/CuO/ alumina system were determined experimentally
by Gadalla and White [18]. Phase relations in this system have been calculated more recently by Jacob and Alcock [19]. In the present study, we found phase equilibrium relations in the Cu/Cu2O/CuO/
alumina system. In other words, there are mixture of Cu, Cu2O and CuO crystallites supported on the
alumina surface. The presence of these crystallites is very important in the most catalytic reactions. The XRD measurements for the S3, S4 and S5 samples show electron image recorded from a polycrystalline alumina substrate after reacting with CuO powder when the G/N ratio was 1.33-2.67, which is above the Cu+2 → Cu+1 + Cu0 transition temperature (1020 °C), and therefore Cu2O and Cu
were present in this sample [20]. The reaction equation was proposed as following:
4Cu+2 → Cu+2 + Cu+1 + Cu0 (2)
Indeed, XRD measurements showed that the S2 sample consisted entirely of nano-crystalline CuO supported on amorphous alumina while the S3, S4 and S5 samples consisted of mixture of nano-crystalline CuO, Cu2O and Cu supported on alumina surface. In addition, there are phase
transformations between the copper phases depending upon the change in the crystallinity of these phases. Where, Cu phase was the major phase in the S3 and S4 samples while CuO was the major phase in the S5 phase due to the change in the G/N ratio.
One can not overcome the solid state reaction between copper and alumina yielding Cu-Al-O compounds [20]. This reaction depends upon the thermal diffusion for the cations of these oxides [21, 22]. Both CuAl2O4 and CuAlO2 were found to form during reactions in air at 1100 °C between CuO
powder and single-crystal alumina substrates. The relative position of the CuAl2O4and CuAlO2 layers
substrate surface was (1120) [20]. Deraz reported that the glycine assisted combustion method is useful for providing an alternative of low cost mass production of various ceramic materials [21, 22]. The counter-diffusion of Cu2+, Cu2+ and Al3+ through a relatively rigid aluminates film led to the formation of CuAl2O4 and/or CuAlO2 nano-particles. In addition, following reactions indicate that Al2O3
decomposes to 2Al3+ and oxygen gas at Al2O3- interface. Moreover, oxygen moves through the reacted
area to be added to the CuO interface and form spinel by reacting with aluminum ions:
At Al2O3 interface:
3Al2O3 +2Cu2+ → 2CuAl2O4 +2Al3+ +0.5O2 (3)
2Al2O3 +2Cu1+ → 2CuAlO2 +2Al3+ +O2 (4)
At CuO and Cu2O interface:
2Al3+ +3CuO + 0.5O2 → CuAl2O4 +2Cu2+ (5)
2Al3+ +2Cu2O + O2 → 2CuAlO2 +2Cu1+ (6)
The morphology study of the investigated composites showed that these composites consist of polygonal- shaped grains with small incrustations on the surface. The presence of these incrustations is probably due to the influence of secondary phases. As the phase transformation of copper crystallites increases, the morphology has been modified and the grains are larger in size as shown in the S3 sample. The S5 sample shows a significant change in the morphological properties with the G/N ratio indicating to probability formation of Cu-Al-O compounds.
5. CONCLUSIONS
Effects of glycine content on the structural and morphological properties of Cu/Al nano-composite prepared by combustion method have been studied. The combustion route brought about the production of mixture of CuO, Cu2O and Cu supported on alumina surface. The increase in the glycine
content resulted in an increase in the lattice constant and unit cell volume of the produced CuO, Cu2O
and Cu involved in the investigated composite. But this treatment led to a decrease in the crystallite size for metallic copper and an increase in that for CuO and Cu2O phases. The images of SEM showed
that the as synthesized cobalt aluminates using high amounts of glycine has a significant porosity. The obtained samples have a homogenously distributed species in the whole mass prepared. The change in the G/N ratio resulted in change in the crystallinity of the mixture of CuO, Cu2O and Cu involved in
ACKNOWLEDGEMENT
This project was supported by King Saud University, Deanship of Scientific Research, College of Science Research Centre.
References
1. D. L. Feldheim and C. A. Foss, Metal nano-particles: Synthesis, characterization and applications (Marcel Dekker Inc.) (eds) 2002 .
2. A. K. Schaper, H. Hou, A. Greiner, R. Schneider, F.Philips, Appl. Phys. A Mater. Sci. Process 78(2004)73.
3. B. Pergolese, M. Muniz-Miranda, A .Bigotto , J. Phys.Chem. B, 110 (2006)9241 4. C. J. Flytzanis , Physics B, At. Mol. Opt. Phys., 38(2005 )S661
5. H. Holzschuh and , H. Suhr, J. Appl. Phys. A, 51(1990)486.
6. D. Majumdar, T. A. Shefelbine, T. T Kodas, H. D. Glicksman, J. Mat. Res., 11(1996)2861. 7. K .Klier, Adv. Catal., 31(1982)243.
8. D. O.Klenov, , G. N Kryukova, L. M. Plyasova, J. Mat. Chem., 8(1998)1665. 9. R. Pereia, M. Rufo, U. Schuchardt, J. Braz. Chem. Society 5(1994)83.
10.I. J. Shannon, F.Rey, G. Sankar, J. M. Thomas, T. Maschmeyer, A. M Waller, A. E. Palomares, A. Corma,., A. J. Dent and G. N. Greaves, J. Chem. Soc. Faraday Trans., 92(1996)4331.
11.H. Zhu, C. Zhang, Y. Yin, Nanotechnology, 16(2005) 3079.
12.B.D. Cullity, Elements of X-ray Diffraction, Addison-Wesly Publishing Co. Inc. 1976 (Chapter 14).
13.Shao-Kuan Lee, Wei-Hsing Tuan, Yin-Yin Wu, Shao-Ju Shih, J. Euro. Ceram. Soc., 33 (2013) 277.
14.K. P. Trumble, Acta Metall. Mater., 40(1992)S105. 15.K. P. Trumble, J. Am. Ceram. Soc., 82(1999)2912. 16.A. Lupu, J. Therm. Anal., 2(1970)445.
17.T. Ishiguro, N. Ishizawa, N. Mizutani, M. Kato, J. Solid State Chem., 41(1982)132. 18.A.M. Gadalla, J. White, Trans. Brit. Ceram. Soc., 63(1964)39.
19.K.T. Jacob, C.B. Alcock, J. Am. Ceram. Soc., 58(1975)192. 20.David W. Susnitzky, C. Barry Carter, J. Mater. Res., 6(1991)1958 21.N. M. Deraz, Ceramics International 38 (2012) 511.
22.N. M. Deraz, Int. J. Electrochem. Sci. 7(2012) 4596.