Int. J. Electrochem. Sci., 9 (2014) 7083 - 7096
International Journal of
ELECTROCHEMICAL
SCIENCE
www.electrochemsci.org
Hot Dipped Zn-Al-Mg-Cu Coating with Improved Mechanical
and Anticorrosion Properties
Caizhen Yao1, See Leng Tay1,2, Ji Hyun Yang1, Tianping Zhu1, Wei Gao1,*
1
Department of Chemicals and Materials Engineering, the University of Auckland, PB 92019, Auckland 1142, New Zealand
2
Department of Mechanical Engineering, University of Malaya, Kuala Lumpur, Malaysia
*
E-mail: w.gao@auckland.ac.nz
Received: 21 July 2014 / Accepted: 1 xxx 2014 / Published: 29 September 2014
Three types of coatings: Zn-0.1 wt.%Cu (G), Zn-5 wt.%Al-0.1 wt.%Cu (ZA) and Zn-5 wt.%Al-1 wt.%Mg-0.1 wt.%Cu (ZAM) were deposited by hot dipping method on mild steel substrates. The phase structure, cross section microstructure, composition, microhardness and corrosion property of the coatings were characterized by X-ray diffraction (XRD), environmental scanning electron microscopy (ESEM-EDS), microhardness test, and electrochemical analysis. Continues salt spray tests were performed to access the corrosion behaviour of coatings. The microhardness of ZAM coating was improved to 178 HV comparing with 43 HV of G coating and 89 HV of ZA coating. The improved microhardness of ZAM coating is due to the strengthening effect of grain boundary at which intermetallic compounds of Al5Fe2Zn0.4, MgZn2 and Mg2Zn11 has precipitated. ZAM coating also
showed the highest impedance and the extended exposure during the salt spray test. Simonkolleite was identified as the main corrosion product on three tested coatings. The slow corrosion mechanism of ZAM coating was discussed.
Keywords: Zn-Mg-Al-Cu coating, Hot dipping, Microhardness, Corrosion resistance
1. INTRODUCTION
form a thick layer at the interface of coating and substrate, reversely affecting the formability of coated steels [4].
Recently, studies on Zn-Al-Mg coating have attracted attention. Firstly, its performance in salt spray test is much better than that of Zn coating (by 10-20 times) and Zn-Al coating (by 2-5 times) [5-8]. Secondly, Zn-Al-Mg coating has self-healing capability [9, 10], thus the incision area can be re-enclosed and protected properly. Thirdly, the improved microhardness gives Zn-Al-Mg coating a much better scratch and wear resistances [11, 12]. Finally, Al and Mg are light metals, so the density of Zn-Al-Mg coating is lower than that of Zn coating. It can be used in perforated plates in civil construction, automobile bodies and sectors, green house structures in agriculture and switch cabinet in electric power telecommunication etc.
Nisshin and Nippon companies in Japan have filed several patents on Zn-Al-Mg coatings in the past few years [7, 8, 11, 13, 14]. Companies in Europe and South Africa are also developing Zn alloy coatings containing Al and Mg [15, 16]. Schuerz [17] reported that the transformation of metallic Zn-Al-Mg coating into an Al-rich oxide layer is the key factor that enhances its anticorrosion property. Komatsu [18] and Persson [19] suggested that the existence of Mg suppressed the formation of non-protective corrosion products, resulting in the improvement of corrosion resistance of Zn-Al-Mg coating. Chen [20] believed that the formation and distribution of Mg containing phases will activate the -Al dendritic phase and block the corrosion paths along the interdendritic channels, thus contribute to the better corrosion resistance of Zn-Al-Mg-Si coating.
However, detailed information on the anticorrosion mechanism of Zn-Mg-Al coating is still lack in open literatures, and very little is known specifically about the electrochemical performance of Zn-Al-Mg coating. The reason of enhanced corrosion resistance of Zn–Al–Mg coated steel has not been explained. Furthermore, optimising the processing conditions and achieving smooth surface of Zn-Al-Mg coating are still a challenge in this field. According to Cervantes [21], the presence of Cu can improve the wear resistance of Zn-Al coating. Therefore, trace amount of Cu was added to the coatings in this study. The present work aims to study the effect of Mg on the microstructure and corrosion properties of hot dipped Zn-Al-Mg-Cu coating. Electrochemical analysis and salt spray test were conducted to evaluate the electrochemical property of Zn-Mg-Al-Cu coating.
2. EXPERIMENTAL PROCEDURES 2.1 Pre-treatment of substrate
Mild carbon steel coupons in the size of 40 mm × 20 mm × 1 mm were grinded and polished to obtain a smooth surface. Then the coupon surface was chemically pre-treated as following. Firstly, they were degreased in alkaline solution (NaOH: 80 g/L; Na2CO3:50 g/L; Na3PO4:100 g/L; Na2SiO3:24
g/L) at 85C for 10 min, rinsing with hot water, and then pickled in 15% HCl solution (1.5 g/L Hexamethylenetetramine as corrosion inhibitor) at 30˚C for 5 min. After rinsing with running water, coupons were oven dried, fluxed in 550 g/L ZnCl2·2NH4Cl solution (pH value 4~5) at 60C for 3 min,
2.2 Hot dipping
The pre-treated coupons were dipped into a molten metals bath in a graphite crucible under the protection of Ar gas. Three different compositions (in wt.%) of dipping bath were prepared: Zn-0.1Cu (G), Zn-5Al-0.1Cu (ZA) and Zn-5Al-1Mg-0.1Cu (ZAM). The purities of metals are 99.9%. To avoid the oxidation of Mg which may occur even under the protection of Ar gas, intermetallic compound of MgZn2was prepared as a master alloy in a vacuum induction furnace, and added into the molten
liquids.
[image:3.596.55.544.340.435.2]The temperature of the bath was monitored and controlled by a portable thermocouple. The hot dipping is carried out at 680˚C and dipping time of 5 seconds. At least two samples were prepared for each set of test condition. Designation of coating specimens, bath compositions and dipping conditions are given in Table 1. Other factors like dipping speed and cooling rate were kept as identical as possible to minimize their effects on thicknesses and morphologies of coatings.
Table 1. Hot dipping condition for three coatings
Designation of specimens Bath compositions
(in wt.%)
Dipping temperature (˚C)
Dipping time (s)
Ar protection
G Zn-0.1Cu 680 5 No
ZA Zn-5Al-0.1Cu 680 5 No
ZAM Zn-5Al-1Mg-0.1Cu 680 5 Yes
2.3 Characterization
The coatings were briefly examined under optical microscopy, and then examined using ESEM combined with EDS. Additional measurements using X-ray diffraction analyses were also performed at the scan rate of 10 K/min to identify phase compositions. Coatings with several layers were carefully polished to get the XRD patterns of different layers, which were analysed subsequently using EVA software. Microhardness of the coating was tested using a microhardness tester with a diamond indenter. Cross hatch/tape pull test was performed according to ASTM standard D3359-09 to measure the adhesion of coating. A classification of 0B-5B from the worst to the best was employed to evaluate the adhesive property of the coating.
Continues neutral salt spray test using 5 wt.% NaCl aqueous solution was performed according to ASTM B117 standard for further investigation of corrosion properties of coatings. Before exposure, the coating samples were cleaned and dried in air. Edges and back surface of specimens were sealed properly using silicon sealant and scotch tape, a clean surface area of 2 cm2 was exposed for salt spray test. Cross section morphology and chemistry of corroded coating samples were examined.
3. RESULTS AND DISCUSSION
[image:4.596.44.553.330.425.2]The physical properties of hot dipped coatings are summarised in Table 2. It can be seen that ZAM coating has the lowest density 6.41 g/cm3 with the largest coating thickness of 300 µm and the microhardness of 178 HV.
Table 2. Physical properties of hot dipped coatings
Specimens Coating density (g/cm3)
Coating thickness (µm)
Microhardness (HV)
Adhesion After treatment
G 7.14 20 43 5B No
ZA 6.60 60 89 5B No
ZAM 6.41 300 178 5B No
3.1 Examination on cross sections of coatings 3.1.1 Cross section of G coating
[image:4.596.84.515.507.715.2]
Table 3. Elemental compositions at selected positions indicated in Fig. 1a
Positions Zn (wt.%) Al (wt.%) Cu (wt.%) Fe (wt.%) O (wt.%)
eds 1 82.36 0 0 17.64 0
eds 2 97.84 0 0 0 2.16
eds 3 92.04 0 2.28 0 5.68
ESEM image in Fig. 1a shows the microstructure observed on cross section of G coating. It indicates that the thickness of G coating is about 20µm, and the coating comprises two layers. According to the XRD patterns in Fig. 1b and EDS results in Table 3, the inner layer is Zn-Fe intermetallic where lager amount of Fe was detected by EDS. The thickness of layer 1 is ~5 µm. The formation of this Zn-Fe intermetallic layer may have positive effect on the adhesion of G coating. However, the brittleness of this layer may deteriorate the formability of hot dipped steel sheet. The second layer is ~15 µm and it comprises Zn phase and CuZn5 phase according to XRD results in Fig.
1b.
3.1.2 Cross section of ZA coating
Figure 2. SEM images showing the cross section (a) and XRD patterns (b) of ZA coating
[image:6.596.118.478.577.748.2]
structure perpendicular to the steel substrate. According to the XRD patterns in Fig. 2b and EDS results in Table 4, formation of Al5Fe2Zn0.4 phase was detected in layer 1.
Table 4. Elemental compositions at positions indicated in Fig. 2a
Positions Zn (wt.%) Al (wt.%) Cu (wt.%) Fe (wt.%) O (wt.%)
eds 1 14.06 49.01 0 36.94 0
eds 2 91.85 6.03 0.11 2.01 0
eds 3 69.94 0.85 21.84 0.77 6.61
eds 4 93.88 1.15 2.99 1.05 0.93
eds 5 87.05 2.29 5.36 0.59 4.71
This result is consistent with Tachibana [22], Davis [23] and Dutta [1], who described that Al has higher affinity than Zn towards Fe, and Fe2Al5(Zn) inhibition layer formed first during the hot
dipping process of ZA coating which prevents the formation of brittle Fe-Zn intermetallic layer. The formation of Al-Fe-Zn inhibition layer may render the better adhesion property of ZA coating.
Layer 2 consists of pure Zn and Cu9Al4 phases. In the early stage of solidification, proeutectic
Zn particles nucleate first and the solidification of the eutectic matrix (Zn/Cu9Al4) proceeds from these
particles. The prepared ZA coating has a higher content of Al and Cu than that of the coating bath. Al and Fe are mainly detected in layer 1 of ZA coating. Similar phenomenon was also observed by Honda [4].
3.1.3 Cross section of ZAM coating
[image:7.596.117.478.68.448.2]
Figure 3. The overall view (a) and close views (b, c and d) on cross section of ZAM coating and corresponding XRD patterns (e)
Table 5. Elemental compositions of different phases in Figs. 3b, 3c & 3d
Positions Zn (wt.%) Al (wt.%) Mg (wt.%) Fe (wt.%) Main Phase
eds b 82.08 0.05 0.11 17.76 Zn-Fe intermetallic eds c1 22.15 42.53 0 35.32 Al5Fe2Zn0.4
eds c2 89.36 0 10.64 0 MgZn2 and Mg2Zn11
eds c3 98.96 0 1.04 0 Zn
eds c4 100 0 0 0 Zn
eds d1 25.34 47.34 0 27.32 Al5Fe2Zn0.4
eds d2 93.55 0 6.45 0 Mg2Zn11
eds d3 97.92 0 2.08 0 Zn
eds d4 100 0 0 0 Zn
Five different phases were detected by XRD: hexagonal Zn, orthorhombic Al5Fe2Zn0.4, laves
[image:7.596.81.522.541.717.2]
compounds with thickness of about 3 µm formed between the coating and substrate, as shown in Fig. 3b (eds b).
The cross hatch/tape pull test on ZAM coating revealed that the edges of the cuts are completely smooth, and none of the cutting squares are detached. The good adhesion is likely attributed to the formation of the thin Zn-Fe intermetallic layer, which was also observed in G coating. Al5Fe2Zn0.4 phase distributes randomly in ZAM coating (eds c1 and eds d1), rather than forming a
continuous layer in ZAM coating. Therefore, the hardness of the ZAM coating can be improved by discrete intermetallic particles while the formability of ZAM coated steel sheets is not compromised. MgZn2 and Mg2Zn11 phases preferentially segregate at the grain boundaries of Zn. According to the
solidification model proposed by Tanaka [24], the solidification of the coating layer starts from the substrate side and proceeds outward to the melt surface. Thus, a super cooling process occurs near the substrate. As a result, MgZn2 formed in the eutectic area shown in Fig. 3c. This result is further proved
by the EDS results in Table 5: more Mg was detected in the eutectic area of Fig. 3c (eds c2) than that in Fig. 3d (eds d2). A previous study [25] found that MgZn2 is the only Mg containing phase formed
in ZAM coating. However, Mg2Zn11 compound was detected in this study. According to Byun [26],
Mg2Zn11 has the best corrosion resistance among Zn-Mg phases. Thus, the formation of Mg2Zn11
compound should be a factor contributing to the improved anticorrosion property of ZAM coating.
3.2 Electrochemical properties 3.2.1 OCPs and Polarization curves
[image:8.596.112.484.441.713.2]
Table 6. Corrosion potentials and corrosion current densities of different coatings tested in Figs. 4c and 4d
Specimens Ecorr (V vs. SCE) icorr (A/cm2) Cathodic slope (1/V) Anodic slope (1/V)
G -1.30 7.73×10⁻⁵ 13.43 0.97
ZA -1.26 1.20×10⁻⁵ 9.04 1.90
ZAM -1.24 4.30×10⁻⁵ 4.96 1.75
G5 -1.07 8.75×10⁻⁵ 2.20 8.04
ZA5 -1.08 3.51×10⁻⁵ 6.05 10.31
ZAM5 -1.08 5.46×10⁻⁵ 7.83 10.95
OCPs and potentio-dynamic polarization curves were obtained and presented in Fig. 4. Two tests at identical condition were conducted for each type of coating to ensure that the testing results are repeatable. OCP-time curves in Figs. 4a and 4b suggest that ZAM coating reaches to a stable state more rapidly than G and ZA coatings. The collected data of polarization tests are summarized in Table 6.
It can be seen that ZA coating has the lowest corrosion current density of 1.20×10⁻⁵ A/cm2 in comparison with 4.30×10⁻⁵
[image:9.596.68.528.111.209.2]A/cm2 of ZAM coating and 7.73×10⁻⁵ A/cm2 of G coating. This phenomenon may be due to the existence of Al, whose corrosion products are electrochemically inert. It is interesting to see that ZAM coating has a slightly more positive corrosion potential of -1.24 (V vs. SCE) in comparison with -1.26 (V vs. SCE) of ZA coating and 1.30 (V vs. SCE) of G coating (see Fig. 4c). After 5 days’ salt spray test, the three coatings present similar corrosion potentials around -1.08 (V vs. SCE).
Fig. 4d is the polarization curve of ZAM coating, showing a passive region at the range of -1.2 V to -1.5 V, indicating that the cathodic reaction of ZAM coating was inhibited in this potential range. It may due to the precipitation of corrosion products on cathodic area. Those corrosion products act as inhibitors, which increase the impedance of coating surface, thus slow down the further corrosion of ZAM coating.
[image:9.596.83.510.578.741.2]
Figure 5. EIS spectra for G, ZA and ZAM coatings in 3.5 wt.% NaCl solution: (a & c) Nyquist diagrams and (b & d) Bode phase angle diagrams
Fig. 5 shows EIS spectra for G, ZA and ZAM coatings before (a & b) and after (c & d) 5 days’ salt spray test. The shapes of Nyquist plots (Fig. 5a) and Bode phase angle diagrams (Fig. 5b) of three coatings before salt spray test are similar. The Nyquist plots consist of a semicircle at high frequency and a circle at low frequency. The Bode phase angle diagrams exibit two wave crests, indicating that three coatings may have the similar corrosion mechemisms. While ZA coating has higher impedance mostly at high frequency range (10 Hz~100000 Hz) than other two coatings, G coating has relatively higher impedance at low frequency (0.01 Hz~10Hz) than ZA and ZAM coatings. Higher impedance value normally indicates lower corrosion rate of the material. The impedance of ZAM coating is lower than others at this stage, which maybe because of the addition of less noble Mg. It will react first when ZAM coating is immeresed into NaCl solution, contributing to the high corrosion current density at the initial stage.
After 5 days’ salt spray test, the impedances of the three coatings all increased (Fig. 5c). The impedance of ZAM coating increased to about 2268 Ω in comparison with 1023 Ω and 1090 Ω for ZA and G coating, respectively, at 0.01 Hz. The corresponding wave crest is also observed at 0.1~1 Hz for ZAM coating only, Fig. 5d. Higher inpedanne and wave crest at low frequence suggests that ZAM coating has the best anticorrosion property among three coatings after 5 days immersion test. The Bode phase angle diagram of ZAM coating is characterized with two capacitive semicircle loops in the frequency range of 1×10⁻²
Hz to 1×10⁵ Hz, as shown in Fig. 5c. The fisrt capacitive semicircle is attributed to the charge-transfer resistance of the electric double layer; and the second semicircle is ascribed to the charge-transfer resistance of the corrosion product [27]. It means that with the growing corrosion products, a passive film formed on the surface of ZAM coating. This result is consistent with the polarization curve obtained in Fig. 4d and the result reported by Xiao [28].
3.3 Continuous salt spray test
[image:10.596.82.508.71.230.2]
The cross sections of corroded specimens are examined and presented in Fig. 6 which shows the corrosion progress. EDS data is recorded in Table 7, showing the elemental compositions of corrosion products on coating surface after testing.
[image:11.596.104.495.145.577.2]Figure 6. Cross sections of G, ZA and ZAM coatings after salt spray test for 5 days: (a, c & e) and 10 days (b, d & f).
Table 7. Elemental compositions of corrosion products formed at positions indicated in Fig. 6
Positions Zn (wt.%) Al (wt.%) Mg (wt.%) Cu (wt.%) Cl (wt.%) O (wt.%)
eds a1 94.37 0 0 1.92 0.13 2.04
eds a2 82.11 0 0 0 1.91 14.21
eds c1 64.72 20.33 0 1.89 0 3.53
eds c2 88.91 1.22 0 0 0.48 6.88
eds e1 92.39 0.84 0.28 0 0.5 4.31
[image:11.596.50.546.675.764.2]
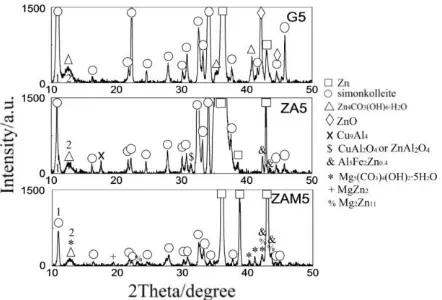
Pitting corrosion was observed in G coating after 5 days’ salt spray test as shown in Fig. 6a. Coating was corroded faster at position a2 than that at point a1. The XRD results in Fig. 7 indicate that the main corrosion products of G coating are simonkolleite, Zn4CO3(OH)6·H2O and ZnO. Fig. 6b
shows the cross section of G coating after 10 days’ salt spray test. Zn crystals have been corroded severely. Similar results was reported by Miao [29], indicating that a layer of corrosion product of zinc hydroxyl chloride complexes formed on the coating surface.
For ZA coating, there are mainly two different areas that exposed to salt fog: the Al-rich phases (c1) and Zn-rich phases (c2). According to the XRD patterns in Fig. 7 and EDS results in Table 7, the main corrosion products at c1 are CuAl2O4and ZnAl2O4. The main corrosion products at c2 are likely
to be simonkolleite and Zn4CO3(OH)6·H2O. This result is different from those reported by Zhang [30],
who found simonkolleite, Zn6Al2(OH)16CO3·4H2O and Zn5(CO3)2(OH)6 in the corrosion products of
Galfan(Zn-5wt.% Al coating) after long-term exposure at the marine site. He proposed that the formation of Zn6Al2(OH)16CO3·4H2O is the main reason for the enhanced corrosion resistance of
Galfan. Fig. 6d indicates that after 10 days’ salt spray test, pitting corrosion penetrated to layer 2 of ZA coating.
Figures 6e and 6f show cross sections of ZAM coating after salt spray test for 5 days and 10 days, respectively. Two main areas that exposed to salt fog are Zn-rich phases (e1) and Mg-rich phases (e2), as shown in Fig. 6e. Elemental compositions in Table 7 indicate that corrosion products at position e2 contain more O and Cl comparing with that in position e1. Due to the less noble nature of Mg, it is reasonable to expect that Mg-rich phases are more electrochemically active than Zn-rich ones. Thus, Mg-rich phases were corroded first in ZAM coating. It can be seen in Fig. 6f that initial corrosion occurred at Mg-rich phases (eutectic areas) in ZAM coating. According to the XRD patterns in Fig. 7 and EDS results in Table 7, the main Mg containing corrosion product formed at position e2 is probably Mg5(CO3)4(OH)2·5H2O.
Figure 7. a comparison of XRD patterns of G, ZA and ZAM coatings after salt spray test for 5 days
Simonkolleite was identified as the main corrosion product formed on these three coatings. It has the same preferential orientation [003] at about 2θ = 11 (peak 1) in these coatings. The broad peak at ~13 (peak 2) may correspond to the incompletely crystallised Zn4CO3(OH)6·H2O and
[image:12.596.188.409.506.656.2]
were quantified in terms of FWHM and Chord Mid, and the results are given in Table 8. It indicates that simonkolleite formed on ZAM coating has the smallest grain size (largest FWHM 0.290) according to Scherrer Equation. It also shows that the Chord Mid of Zn4CO3(OH)6·H2O formed on
ZAM coating is at 12.813. This peak shifts slightly higher than that formed on G and ZA coating by approximately 0.17°. It may be due to the existence of Mg5(CO3)4(OH)2·5H2O. The XRD peaks of
[image:13.596.161.438.226.324.2]Mg5(CO3)4(OH)2·5H2O and Zn4CO3(OH)6·H2O superimpose at peak 2 in ZAM coating.
Table 8. Quantifications of peaks 1 & 2 in Fig. 7
Specimens Peaks FWHM () Chord Mid ()
G 5 1 0.245 10.977
2 0.809 12.631
ZA 5 1 0.232 10.882
2 0.780 12.647
ZAM 5 1 0.290 10.945
2 0.767 12.813
4. CONCLUSIONS
1. Zn-5Al-1Mg-0.1Cu (in wt.%) (ZAM) coating was deposited on mild steel by hot dipping method at the temperature of 680C.
2. ZAM coating showed the highest microhardness of 178 HV comparing with 43 HV of G (Zn-0.1wt.%Cu) coating and 89 HV of ZA (Zn-5wt.%Al-0.1wt.%Cu) coating.
3. ZAM coating is considerably thicker (300 µm) than G and ZA coating produced with identical process. It consists of five different phases: hcp Zn phase, base centred Al5Fe2Zn0.4 phase,
laves phase MgZn2, cubic lattice Mg2Zn11 and Zn-Fe intermetallic compound.
4. ZAM coating has the best corrosion resistance among three types of coatings. The impedance of ZAM coating increased to about 2270 Ω in comparison with 1020 Ω and 1090 Ω for ZA and G coating, respectively, at 0.01 Hz after 5 days’ salt spray test. Continuous salt spray test further proved its excellent anticorrosion properties.
5. The protective nature of ZAM coating may be attributed to the initial corrosion of Mg-rich phases. The corrosion products of Zn, Al and Mg agglomerate on the cathodic area, which act as inhibitors, blocking the corrosion paths (the micro paths for the diffusion of O2 and H2O) along the
grain boundaries of Zn crystals, and increasing the impedance of coating surface, Thus, the overall corrosion process of ZAM coating is retarded.
ACKNOWLEDGEMENT
Reference
1. M. Dutta, A.K. Halder, S.B. Singh, Surf. Coat. Technol., 205 (2010) 2578-2584. 2. R.P. Edavan, R. Kopinski, Corros. Sci., 51 (2009) 2429-2442.
3. N. LeBozec, D. Thierry, M. Rohwerder, D. Persson, G. Luckeneder, L. Luxem, Corros. Sci., 74 (2013) 379-386.
4. K. Honda, K. Ushioda, W. Yamada, ISIJ Int., 51 (2011) 1895-1902.
5. B. Gao, S.W. Li, Y. Hao, G.F. Tu, L. Hu, S.H. Yin, The Corrosion Mechanism of Zn-5%Al-0.3%Mg Coating, Trans tech publications ltd, Guilin, Peoples R China, (2011).
6. H.Y. Kim, Derwent World Patents KR2003054469-A (2001).
7. A. Komatsu, N. Yamaki, A. Ando, Derwent World Patents WO200159171-A (2001) 26.
8. M. Kurosaki, J. Maki, Y. Morimoto, K. Nishimura, O. Goto, Derwent World Patents WO200111100-A1 (2001) 28.
9. P. Volovitch, T.N. Vu, C. Allely, A.A. Aal, K. Ogle, Corros. Sci., 53 (2011) 2437-2445. 10. M. Morishita, K. Koyama, Y. Mori, Materials Transactions JIM, 38 (1997) 719-723. 11. N.S. CORP(YAWA-C), Derwent World Patents JP9143657-A (1997) 4.
12. D.S. Jung, J.S. Kim, S.M. Kim, Derwent World Patents KR2003037249-A (2003). 13. N.S.C. LTD(NISI-C), Derwent World Patents JP11199956-A (1999) 4.
14. N.S. CORP(YAWA-C), Derwent World Patents JP9143658-A (1997) 4.
15. M.A. Baker, W. Gissler, S. Klose, M. Trampert, F. Weber, Surf. Coat. Technol., 125 (2000) 207-211.
16. O. Zywitzki, T. Modes, B. Scheffel, C. Metzner, Praktische Metallographie-Practical Metallography, 49 (2012) 210-220.
17. S. Schuerz, M. Fleischanderl, G.H. Luckeneder, K. Preis, T. Haunschmied, G. Mori, A.C. Kneissl, Corros. Sci., 51 (2009) 2355-2363.
18. A. Komatsu, H. Izutani, T. Tsujimura, A. Andoh, T. Kittaka, Tetsu to Hagane-Journal of the Iron and Steel Institute of Japan, 86 (2000) 534-541.
19. D. Persson, D. Thierry, N. LeBozec, T. Prosek, Corros. Sci., 72 (2013) 54-63.
20. Z. Chen, C.T. Peng, Q. Liu, R. Smith, D. Nolan, J. Alloy. Compd., 589 (2014) 226-229.
21. J. Cervantes, A. Barba, M.A. Hernandez, J. Salas, J.L. Espinoza, C. Denova, G. Torres-Villasenor, A. Conde, A. Covelo, R. Valdez, Revista De Metalurgia, 49 (2013) 351-359.
22. K. Tachibana, Y. Morinaga, M. Matuzumi, Corros. Sci., 49 (2007) 149-157.
23. I. ebrary, J.R. Davis, Knovel, Surface engineering for corrosion and wear resistance [electronic resource] / edited by J.R. Davis, Materials Park, OH : ASM International : IOM Communications c2001., Materials Park, OH, (2001).
24. J. Tanaka, K. Ono, S. Hayashi, K. Ohsasa, T. Narita, ISIJ Int., 42 (2002) 80-85. 25. C. Commenda, J. Pühringer, Mater. Charact., 61 (2010) 943-951.
26. J.M. Byun, J.M. Yu, D.K. Kim, T.Y. Kim, W.S. Jung, Y.D. Kim, Korean Journal of Metals and Materials, 51 (2013) 413-419.
27. Y. Hamlaoui, L. Tifouti, F. Pedraza, Corros. Sci., 52 (2010) 1883-1888.
28. Y.P. Xiao, Q.L. Pan, W.B. Li, X.Y. Liu, Y.B. He, Materials & Design, 32 (2011) 2149-2156. 29. W. Miao, I.S. Cole, A.K. Neufeld, S. Furman, J. Electrochem. Soc., 154 (2007) C7-C15. 30. X. Zhang, C. Leygraf, I. Odnevall Wallinder, Corros. Sci., 73 (2013) 62-71.