Astronomy
&
Astrophysics
https://doi.org/10.1051/0004-6361/201732384© ESO 2018
Probing midplane CO abundance and gas temperature with DCO
+
in the protoplanetary disk around HD 169142
?
M. T. Carney
1, D. Fedele
2, M. R. Hogerheijde
1,3, C. Favre
2, C. Walsh
4, S. Bruderer
5, A. Miotello
6, N. M. Murillo
1,
P. D. Klaassen
7, Th. Henning
8, and E. F. van Dishoeck
1,51Leiden Observatory, Leiden University, PO Box 9513, 2300 RA, Leiden, The Netherlands
e-mail:[email protected]
2INAF - Osservatorio Astrofisico di Arcetri, L.go E. Fermi 5, 50125 Firenze, Italy
3Anton Pannekoek Institute for Astronomy, University of Amsterdam, Science Park 904, 1098 XH, Amsterdam, The Netherlands
4School of Physics and Astronomy, University of Leeds, Leeds LS2 9JT, UK
5Max-Planck-Institut für extraterrestrische Physik, Giessenbachstrasse 1, 85748 Garching, bei München, Germany
6European Southern Observatory, Karl-Schwarzschild-Strasse 2, 85748 Garching bei München, Germany
7UK Astronomy Technology Centre, Royal Observatory Edinburgh, Blackford Hill, Edinburgh EH9 3HJ, UK
8Max-Planck-Institute für Astronomie, Königstuhl 17, 69117 Heidelberg, Germany
Received 29 November 2017 / Accepted 23 February 2018
ABSTRACT
Context. Physical and chemical processes in protoplanetary disks affect the disk structure and the midplane environment within which planets form. The simple deuterated molecular cation DCO+has been proposed to act as a tracer of the disk midplane conditions.
Aims. This work aims to understand which midplane conditions are probed by the DCO+emission in the disk around the Herbig Ae star HD 169142. We explore the sensitivity of the DCO+formation pathways to gas temperature and CO abundance.
Methods. The DCO+J=3−2 transition was observed with Atacama Large Millimeter/submillimeter Array at a spatial resolution of ∼0.300
(35 AU at 117 pc). We modeled the DCO+emission in HD 169142 with a physical disk structure adapted from the literature, and employed a simple deuterium chemical network to investigate the formation of DCO+through the cold deuterium fractionation pathway via H2D+. Parameterized models are used to modify the gas temperature and CO abundance structure of the disk midplane to test their effect on DCO+production. Contributions from the warm deuterium fractionation pathway via CH2D+are approximated using a constant abundance in the intermediate disk layers.
Results. The DCO+line is detected in the HD 169142 disk with a total integrated line flux of 730±73 mJy km s−1. The radial intensity profile reveals a warm, inner component of the DCO+emission at radii.30 AU and a broad, ring-like structure from∼50–230 AU with a peak at 100 AU just beyond the edge of the millimeter grain distribution. Parameterized models show that alterations to the midplane gas temperature and CO abundance are both needed to recover the observed DCO+radial intensity profile. The alterations are relative to the fiducial physical structure of the literature model constrained by dust and CO observations. The best-fit model contains a shadowed, cold midplane in the regionz/r< 0.1 with an 8 K decrease inTgas and a factor of five CO depletion just beyond the millimeter grains (r=83 AU), and a 2 K decrease inTgasforr>120 AU. The warm deuterium fractionation pathway is implemented as a constant DCO+abundance of 2.0×10⁻¹²between 30–70 K and contributes>85% to the DCO+emission atr<83 AU in the best-fit model.
Conclusions. The DCO+emission probes a reservoir of cold material in the HD 169142 outer disk that is not probed by the millimeter continuum, the spectral energy distribution, nor the emission from the12CO,13CO, or C18OJ=2−1 lines. The DCO+emission is a sensitive probe of gas temperature and CO abundance near the disk midplane and provides information about the outer disk beyond the millimeter continuum distribution that is largely absent in abundant gaseous tracers such as CO isotopologues.
Key words. astrochemistry – submillimeter: planetary systems – protoplanetary disks
1. Introduction
Protoplanetary disks have complex structures due to the many physical and chemical processes that shape their environment. This includes but is not limited to radiative heating from the central pre-main sequence (PMS) star, viscous heating, molec-ular line cooling, photodissociation and ionization, dust grain growth and radial drift, and the freeze-out of molecular species in cold disk regions (for a review of disk structure and evolution, seeWilliams & Cieza 2011). These processes culminate in the formation of terrestrial and giant planets, often before the gas
?The reduced datacubes (FITS files) are only available at the CDS
via anonymous ftp tocdsarc.u-strasbg.fr(130.79.128.5) or via http://cdsarc.u-strasbg.fr/viz-bin/qcat?J/A+A/614/A106
disk is dispersed. The study of protoplanetary disk structure while the disks still retain their large gas reservoirs is important to understand the environments in which planets will form.
The environment most conducive to planet formation is at the disk midplane, where various molecular species such as H2O,
CO2, CO, and N2 freeze out onto dust grains, creating an icy
mantle that enhances grain sticking efficiency (Bergin & Tafalla 2007;Blum & Wurm 2008). Molecular ices can then be more easily incorporated into the bulk of planetary bodies than their gas-phase counterparts. The location at which∼50% of a given molecule has condensed into ice is called a snow line or ice line. Probing the conditions of the midplane of the disk is difficult. Dust and molecular line opacities can obscure lower layers of the disk, particularly at radii close to the central star. Molecular snow lines can reside too near to the star to be directly observed, as is the case for H2O (Zhang et al. 2013;Piso et al. 2015;Banzatti et al. 2015). They can also be obscured by opacity effects in the outer disk, as is the case for the farther out CO snow line, where
12CO,13CO, and even C18O can remain optically thick at large
radii (Qi et al. 2015;Fedele et al. 2017). Direct determination of the CO snow line can be done using emission from the rarest CO isotopolgues (e.g.,Yu et al. 2016; Zhang et al. 2017), but only for the closest objects. To characterize the disk midplane envi-ronment, less abundant species must be observed which trace chemical processes occurring deep in the disk, such as molecular freeze-out. The DCO+molecule has been suggested as an opti-cally thin molecular tracer of the midplane regions around the CO snow line and as a simultaneous tracer of ionization occur-ring in the intermediate layers of the disk due to its formation via cold (.30 K) and warm (.100 K) deuterium fractionation pathways available in protoplanetary disks (Mathews et al. 2013;
Favre et al. 2015;Huang et al. 2017).
The disk around HD 169142 makes an excellent test bed in which to explore the chemistry of DCO+ in protoplanetary disks and its usefulness as a tracer of disk midplane conditions. HD 169142 is one of a handful of disks found to have millime-ter dust rings, and which also exhibits CO emission that extends beyond the edge of the millimeter grains (ALMA Partnership et al. 2015;Andrews et al. 2016;Isella et al. 2016;Walsh et al. 2016;Fedele et al. 2017). HD 169142 is an isolated system with a Herbig Ae spectral type A8 Ve star and stellar mass M∗ = 1.65 M(Grady et al. 2007;Blondel & Djie 2006). Recent dis-tance measurements by Gaia put the system at a disdis-tance of d =117±4 pc (Gaia Collaboration 2016). The new distance results in a revised luminosity that is lower by a factor of∼0.65, which places the age of the system closer to∼10 Myr (Pohl et al. 2017). The new age estimate is older than previous estimates of 6+6
−3 Myr (Grady et al. 2007), but within the errors. With disk
inclinationi= 13◦and position angle PA = 5◦(Raman et al. 2006;
Pani´c et al. 2008), the system is viewed close to face-on, allow-ing for accurate characterization of the radial distribution of the continuum and molecular line emission. With an estimated total gas mass of 1.9×10⁻² M
and12CO extending out to∼200 AU (Fedele et al. 2017), the HD 169142 disk has a high concentration of gas. There is already known substructure in the dust around HD 169142. A hot inner ring of dust at∼0.2 AU was detected (Wagner et al. 2015) within a central dust cavity, and two dust rings at∼25 AU and∼60 AU are clearly visible in the 1.3 mm continuum with ALMA (Fedele et al. 2017) and in scattered light with the Gemini Planet Imager and the Spectro-Polarimetric High-contrast Exoplanet REsearch instrument on the Very Large Telescope (VLT/SPHERE;Monnier et al. 2017;Pohl et al. 2017). The gap carved out between the rings may be indicative of ongo-ing planet formation. An outer gap at ∼85 AU just beyond the edge of the 1.3 mm continuum emission was also detected in scattered light (Pohl et al. 2017) and in 7 and 9 mm emission
Table 1.HD 169142 observational parameters.
Project 2013.1.00592.S
Date observed 2015 August 30
Baselines 13–1445 m | 10–1120 kλ
DCO+J=3−2
Rest frequency [GHz] 216.11258
Synthesized beam [FWHM] 0.3700×0.2300
Position angle –74.8◦
Channel width [km s−1] 0.085
rms noise [mJy beam−1] 6
vLSR[km s−1] 6.9
FWHM [km s−1] 1.76
Integrated fluxa[mJy km s−1] 730±73
Weighting natural
Notes. Flux calibration accuracy is taken to be 10%. (a)Line flux obtained after applying a Keplerian mask to the image cube (Sect.3).
with the Very Large Array (Macías et al. 2017). While the mil-limeter grains terminate at∼85 AU, the micron-sized grains are present throughout radial extent of the gaseous disk. Determin-ing the midplane conditions of this disk would provide insight into the cold disk environment during the planet-building epoch. This paper presents ALMA observations of the J =3−2 transition of DCO+ toward HD 169142 and characterizes its distribution throughout the disk. Section2describes the obser-vations and data reduction. The detection and distribution of DCO+ throughout the disk is detailed in Sect. 3. Model-ing of the disk structure and DCO+ emission is explained in Sect. 4. Section 5 discusses the relationship between DCO+ and the disk environment, followed by the conclusions in Sect.6.
2. Observations and reduction
The star HD 169142 (J2000: RA = 18h24m29.776s, Dec = –29◦46050.00000) was observed with ALMA in band 6 (211–275 GHz) with 35 antennas on 2015 August 30 at a spatial resolution of ∼0.300. The project code is ADS/JAO.ALMA#2013.1.00592.S. The data used in this work were reduced in the same manner asFedele et al.(2017). Their paper provides further details on calibration, self-calibration, and continuum subtraction. Data reduction was performed with version 4.3.1 of the Common Astronomy Software Applications (CASA; McMullin et al. 2007). Images were created using the CASA task CLEAN, with natural weighting for the lines to enhance sensitivity.
The full data set contained observations of the 1.3 mm con-tinuum and the molecular lines12COJ=2−1,13COJ=2−1,
C18OJ=2−1, and DCO+J=3−2. The DCO+J=3−2 line at 216.1128 GHz was observed in the lower sideband and had a frequency (velocity) resolution of 61.0 kHz (0.084 km s−1). This work focuses on the analysis of the DCO+J =3−2 data and makes use of the 1.3 mm continuum and C18O J =2−1 images. A previous analysis of the continuum and the three CO isotopologue lines was reported inFedele et al.(2017).Macías et al.(2017) presented a brief analysis of the C18O J =2−1
−
2
−
1
0
1
2
∆α[00]
−
2
−
1
0
1
2
∆
δ
[
00]
100AU
DCO
+3
−
2
0
5
10
15
20
mJy
/
b
eam
km
/
s
−
2
−
1
0
1
2
∆α[00]
−
2
−
1
0
1
2
∆
δ
[
00 ]
100AU
R
1Gap
R
2DCO
+3
−
2
0
5
10
15
20
mJy
/
b
eam
km
/
s
−
2
−
1
0
1
2
∆α[00]
−
2
−
1
0
1
2
∆
δ
[
00 ]
100AU
DCO
+3
−
2
6
.
0
6
.
5
7
.
0
7
.
5
8
.
0
km
/
s
2
4
6
8
10
12
Velocity [km
/
s]
−
250
0
250
500
750
1000
Flux
Densit
y
[mJy]
[image:3.595.64.535.82.485.2]DCO
+3
−
2
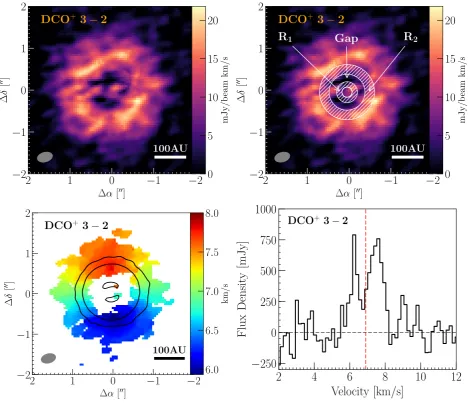
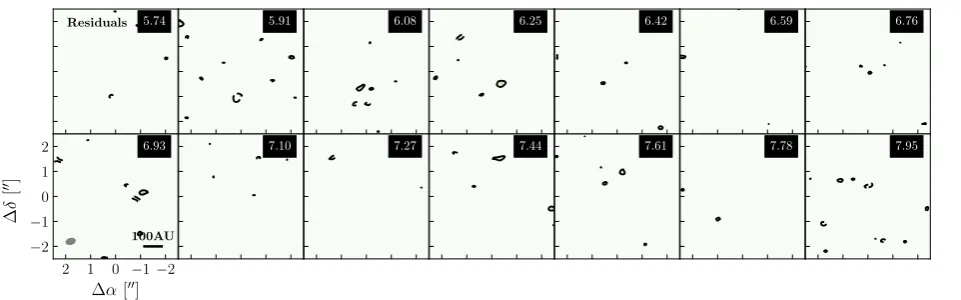
Fig. 1.Top-left: integrated intensity map of the DCO+J=3−2 line from 5.4–8.8 km s−1after applying a Keplerian mask to the image cube. The synthesized beam and AU scale are shown in the lower corners.Top-right: DCO+J=3−2 integrated intensity map overlaid with white marking the model inner dust cavity, the inner dust ring (R1, hatched), the dust gap, and the outer dust ring (R2, hatched). The synthesized beam and AU scale are shown in the lower corners.Bottom-left: velocity-weighted coordinate map of the DCO+ J=3−2 line, clipped at 3.5σ. Solid black contours show the 233 GHz/1.3 mm emission at 7.0×10⁻⁵Jy beam−1(1σ)×[5, 50, 200]. The synthesized beam and AU scale are shown in the lower corners.Bottom-right: disk-integrated spectrum of the DCO+J=3−2 line before Keplerian masking, Hanning smoothed to 0.17 km s−1 channels. The horizontal dashed black line indicates the continuum-subtracted spectral baseline. The vertical red line shows the systemic velocity at 6.9 km s−1.
DCO+image. We instead use a Keplerian mask to improve the signal-to-noise ratio of the DCO+ integrated intensity image, thus retaining the high spatial resolution. We also present exten-sive modeling of the DCO+emission to explore the sensitivity of the emission to the disk physical conditions. Table1summarizes the observational parameters for the DCO+ J=3−2 emission in this work.
3. Results
The DCO+ J = 3 −2 line in the disk around HD 169142 was readily detected and imaged at 0.3700 × 0.2300 [43×
27 AU at 117 pc] spatial resolution, with beam PA = –74.8◦. The systemic velocity is 6.9 km s−1 (Fedele et al. 2017). The spectrum shown in Fig. 1 was extracted from the original self-calibrated, continuum-subtracted CLEAN image. The right ascension and declination axes of the image cube are collapsed
over a circular region with radius 1.7500 centered on the source position.
0
5
10
15
In
tegrated
In
tensit
y
[mJy
/
b
eam
km
/
s]
R1 R2 DCO+ 3−2
0
25
50
75
In
tegrated
In
tensit
y
[mJy
/
b
eam
km
/
s]
C18O 2−1
0
5
10
In
tensit
y
[mJy
/
b
eam]
1.3 mm
0
50
100
150
200
250
r
[AU]
0
.
0
0
.
5
1
.
0
Normalized
In
tensit
[image:4.595.47.275.84.675.2]y
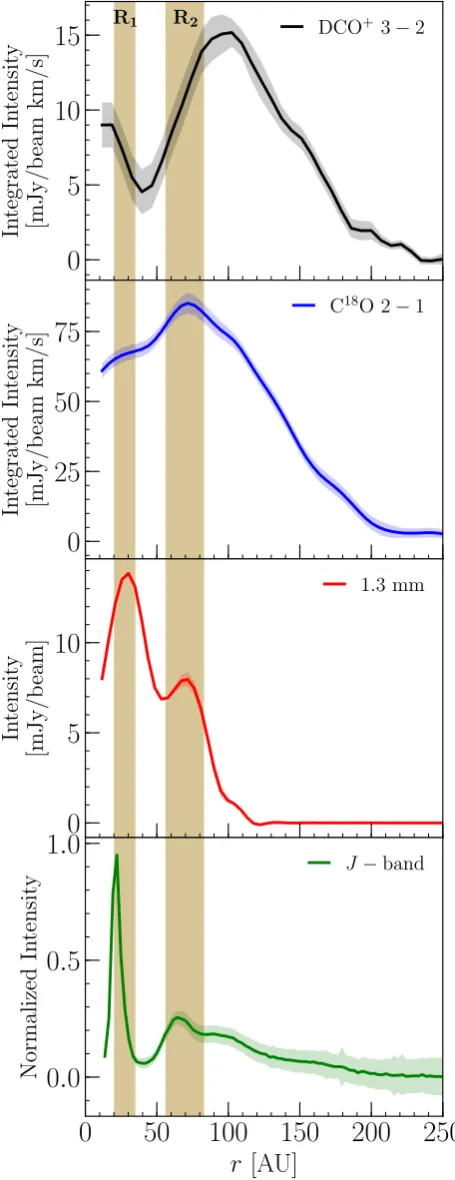
J−bandFig. 2.Azimuthally averaged radial intensity profiles of DCO+(top), C18O (top-middle), the 1.3 mm continuum (bottom-middle), and the
Jband (∼1.2µm) polarized light (bottom). Shaded regions represent 1σerrors on the intensity.
3.1. Radial distribution of DCO+
The DCO+ emission has a ring-like morphology in this disk, with the majority of emission originating in a region between
0.400–1.400 [47–164 AU at 117 pc], based on the velocity-weighted coordinate (first-order moment) map in Fig.1obtained from applying a 3.5σ clip to the emission in the Keplerian-masked DCO+ image cube. The ring extends significantly beyond the outer edge of the 1.3 mm continuum, similar to the12CO,13CO, and C18O molecular lines (Fedele et al. 2017). Figure1also shows the integrated intensity (zero-order moment) map from velocity channels 5.4–8.8 km s−1. Applying the Keplerian mask improved the S/N of the integrated intensity image by a factor of three, from 5 to 15. The radial profile for DCO+ in Fig. 2 is obtained by taking the mean intensity in azimuthally averaged elliptical annuli projected to an inclination i=13◦and position angle PA=5◦. The radial bin size was set to 0.100[11.7 AU at 117 pc]. Errors are calculated as the standard deviation of the pixel intensity contained within each annulus divided by the square root of the number of beams.
With the increased S/N of the averaged annuli, it is clear from the radial intensity profile that DCO+ extends out to
∼230 AU and peaks at a radius of ∼100 AU. Within 100 AU, there is a gap between ∼30–60 AU where the intensity drops, with some DCO+ emission returning at radii .30 AU. Given the errors on the curve, the actual drop in emis-sion in the 30–60 AU region may be small (see Fig. 2). At
∼150 AU there is a knee in the radial profile, and at∼200 AU there is a distinct bump.
The intensity at r . 30 AU already suggests that there is a warm component to the DCO+ emission, as temperatures in this region of the disk are too high to allow the cold deuterium fractionation pathway to be active. As seen in Fig. 2, the dip in DCO+intensity fromr= 30–60 AU corresponds well to the gap between the two dust rings, indicated by the filled regions. With less dust and gas in the gap, the overall surface density pro-file falls dramatically, causing a corresponding dip in the DCO+ radial profile, more prominently than seen in C18O.
The DCO+intensity increases significantly within the outer dust ring, which is to be expected if DCO+is forming near the midplane where the dust temperature is sufficiently low for some degree of CO freeze-out. Interestingly, the peak in the radial pro-file at∼100 AU is beyond the outer edge of the second dust ring, and emission is present throughout the outer disk. This suggests that beyond the 1.3 mm continuum the disk remains cold due to the presence of micron-sized dust grains, as observed byQuanz et al.(2013),Monnier et al.(2017), andPohl et al.(2017).
In addition, Fig. 2 compares the radial profiles of DCO+, C18O, the 1.3 mm continuum, and theJband (1.2µm) polarized intensity. The polarized intensity data is from VLT/SPHERE, with the radial profile obtained after azimuthally averaging the deprojection of ther2-scaledJbandQ
φimage and normalizing to the maximum brightness of the inner ring (Pohl et al. 2017). The dust rings R1 and R2 are clearly visible in both the mil-limeter emission from ALMA and the micron emission from VLT/SPHERE. TheJ band profile shows small grains existing throughout the extent of the gaseous disk out to∼200 AU. The radial profiles show that the DCO+emission is highly sensitive to changes in the disk structure, whereas C18O is less affected.
The feature at∼200 AU reveals that there is some mechanism in the disk causing more DCO+ emission than would be expected for a smoothly decreasing abundance. There may be an accom-panying slope change of the C18O at∼190 AU, but it is difficult
to discern in Fig.2. A feature at large radii in the C18O is more
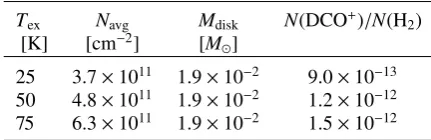
Table 2.DCO+disk-averaged column density and abundance.
Tex Navg Mdisk N(DCO+)/N(H2)
[K] [cm−2] [M]
25 3.7×10¹¹ 1.9×10⁻² 9.0×10⁻¹³ 50 4.8×10¹¹ 1.9×10⁻² 1.2×10⁻¹²
75 6.3×10¹¹ 1.9×10⁻² 1.5×10⁻¹²
in the disk that is not as apparent in the more abundant, optically thick CO isotopologues.
3.2. Column density and disk-averaged abundance in LTE
We estimated the disk-averaged abundance of the observed DCO+based on the total integrated line flux, an assumed excita-tion temperature, and the total disk mass. Following the formula used by Remijan et al.(2003) and Miao et al.(1995) for opti-cally thin emission in local thermodynamic equilibrium (LTE), we can estimate the column density as
N=2.04
R
Iνdv
θaθb
Qrotexp(Eu/Tex)
ν3hS ijµ2i
×1020cm−2, (1)
where R Iνdvis the integrated line flux in Jy beam−1 km s−1,
θaandθbcorrespond to the semi-major and semi-minor axes of
the synthesized beam in arcseconds,Tex is the excitation
tem-perature in K, and ν is the rest frequency of the transition in GHz. The partition function (Qrot), upper energy level (Eu, in K),
and the temperature-independent transition strength and dipole moment (Sijµ2, in debye2) for the DCO+molecule are taken from
the Cologne Database for Molecular Spectroscopy (Müller et al. 2005).
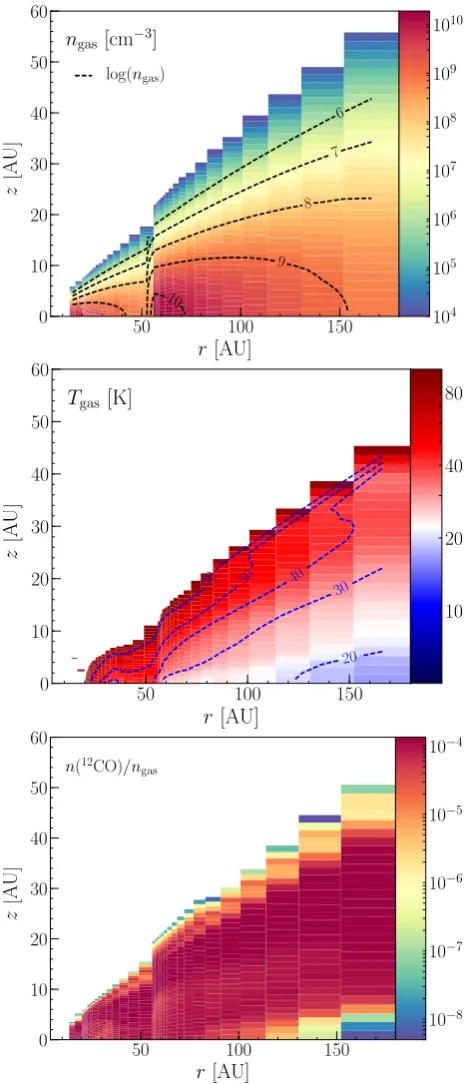
DCO+is expected to form primarily in the midplane close to the CO freeze-out temperature, where gas densities are typically higher (∼109 cm−3;Walsh et al. 2014b) than the critical density of the J=3−2 transition at 20–30 K (∼2×106 cm−3;Flower 1999). Under these conditions, LTE is a reasonable assump-tion. Furthermore, the density of the H2 gas taken from the Fedele et al.(2017) model (see Fig. 4) is greater than the crit-ical density of DCO+ for z/r <0.3. Therefore, only if DCO+ is present solely in the diffuse upper disk layers where the gas and dust temperature have decoupled would LTE be an unreason-able assumption. Currently, formation routes for DCO+place the molecule in significant abundance only in the intermediate disk layers (.100 K) and near the midplane, further justifying the use of LTE.
We explore excitation temperatures of 25, 50, and 75 K, which cover the range of expected DCO+ emitting regions (Mathews et al. 2013; Favre et al. 2015). The total integrated line flux and excitation temperature are used to calculate a disk-averaged DCO+ column density. Assuming optically thin emission, the disk-averaged column density was then used to estimate the total number of DCO+ molecules in the disk, N(DCO+)=Navg×(a×b), where (a×b) is the total emitting
area of DCO+. Assuming the total disk mass is primarily molec-ular hydrogen, we can estimate the total number of H2molecules, N(H2)=Mdisk/mH2, wheremH2is the molecular hydrogen mass.
The emitting area is set toa =b =300 based on the diameter of emission in the integrated intensity map, and the total disk mass is 1.9×10⁻² M. Table2shows the disk-averaged column density and abundance for Tex = 25, 50, and 75 K, which are
consistent to within a factor of two over the temperature range. DCO+ column densities of order 1011−1012 are similar to the values reported for HD 163296 (Mathews et al. 2013; Salinas et al. 2017), TW Hya (Qi et al. 2008), and DM Tau (Teague et al. 2015).
4. Modeling DCO+ emission
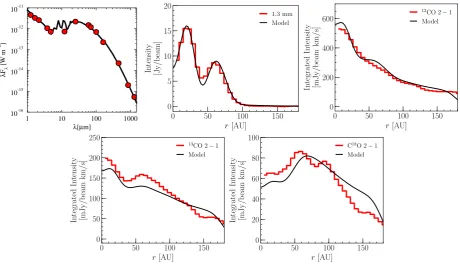
The aim of modeling the DCO+emission in this disk is to deter-mine the midplane conditions which create sufficient production of DCO+ in the outer disk, and to estimate the contribution of cold and warm formation routes to the overall DCO+ abun-dance. The initial physical structure of the HD 169142 disk is adopted fromFedele et al.(2017), who constrained the density and temperature structure by simultaneously fitting the radial distribution of the 1.3 mm continuum and three CO isotopo-logues:12COJ=2−1,13CO J=2−1, and C18OJ =2−1.
The disk structure is then optimized to include a small grain dust population throughout the disk that was absent in the original model. With the optimized disk structure, we then reproduce the DCO+ radial intensity profile in a parameterized way with a simple deuterium chemical network.
4.1. Fiducial physical structure
We use the thermo-chemical code Dust And LInes (DALI;
Bruderer et al. 2012;Bruderer 2013) to obtain the physical disk structure. Input forDALIconsists of a blackbody radiation field with Teff = 8400 K to estimate the stellar photosphere and a
power-law gas surface density with an exponential drop-off
Σgas= Σc R Rc
!−γ exp
− R Rc
!2−γ
, (2)
where Rc (100 AU) is the critical radius, Σc (6.5 g cm−2) is
the value of the gas surface density at the critical radius andγ (1.0) is the power-law exponent. The initial dust surface density is extrapolated from the gas surface density by assuming a gas-to-dust ratio (∆gd =80) such thatΣdust = Σgas/∆gd. The vertical
gas density is described by a Gaussian distribution with a scale height h =hc(R/Rc)ψ that depends on the disk radius and the
flaring exponentψ(0.0) with a critical scale height, hc (0.07),
defined at the critical radius.
Dust settling is approximated in DALI by considering two different populations of dust grains following the power-law description fromD’Alessio et al.(2006), with a power-law expo-nentp= 3.5. The small grains (0.005–1µm) have a scale height h while large grains (0.005–1000 µm) have a scale heighthχ, where the settling parameterχ(0.2) is in the range 0–1. The frac-tional distribution between the two populations of dust grains is set by the parameter flarge(0.85), which results in dust surface
densities ofΣdustflargefor large grains andΣdust(1−flarge) for the
small grains.
The DALI code solves for dust temperatures and radiation field strength in each grid cell using two-dimensional radia-tive transfer, then determines the heating-cooling balance of the gas, molecular excitation, and chemical abundances based on an input chemical network. TheDALImodel described in this work uses the ISO chemical network, which includes CO freeze-out and CO isotope-selective photodissociation (Miotello et al. 2014,
2016).
0 50 100 150
r[AU]
0 1 2 3 4 5
NDCO
+
[cm
−
2] ×1012
R1 R2 NDCO+
Σgas Tex
10−1
100
101
log
(Σ
gas
)
[g
/
cm
−
2 ]
0 50 100 150 200 250 300
Tex
[K]
0 50 100 150
r[AU] 10−12
10−11
XDCO
+
R1 R2
[image:6.595.52.545.84.259.2]DCO+
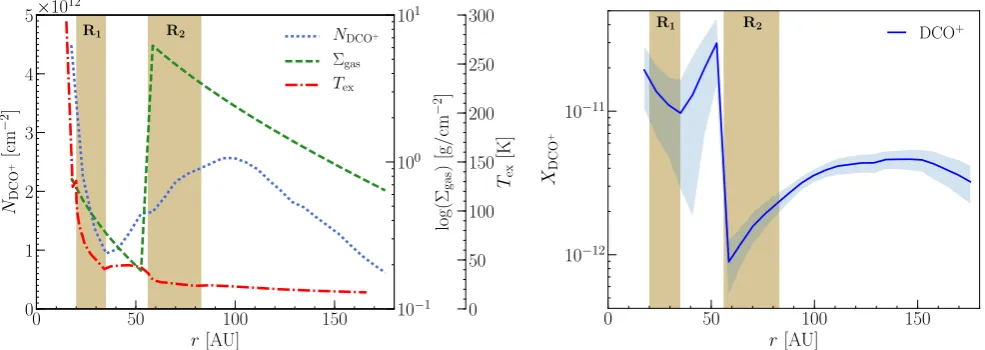
Fig. 3.One-dimensional, radial structure in the HD 169142 disk. Vertical brown shaded regions represent the dust rings.Left: DCO+radial column density (dotted blue) calculated from Eq. (1) using the DCO+the radial intensity profile (see Fig.2) and the midplane gas temperature of the optimizedDALI model (dot-dash red) as theTex profile. The gas surface density profile (dashed green) was used to derive the DCO+ radial abundance.Right: radial abundance structure of DCO+with respect to H2. The blue shaded region represents 1σerrors on the abundance.
two millimeter dust rings: R1 from 20–35 AU and R2 from
56–83 AU. These modifications result in a radially variable gas-to-dust ratio throughout the disk, with∆gd=80 valid only for the
R2outer dust ring from 56–83 AU. A full description and table
of values including the parameter ranges and best-fit parameters of their fiducial DALImodel can be found in Sect. 5.2, Fig. 5, and Table 2 of their paper. Their fiducial model only included a small grain dust population within the millimeter rings since they fit only the millimeter emission. We expand on their fidu-cial model by including small grains in other regions of the disk and optimize the model parameters to keep the fit to the spec-tral energy distribution, 1.3 mm emission, and CO isotopologues. See AppendixAfor details.
4.2. Vertically averaged radial abundance profile in LTE
A radial abundance profile for the observed DCO+emission can be calculated using the method outlined in Sect. 3.2. Rather than estimate a global excitation temperature for DCO+, with the model physical structure outlined in the previous section we can now obtain a radial description of the excitation tempera-ture. To estimate Tex, which will be equivalent to the kinetic
gas temperature assuming LTE, the midplane gas temperature in each radial bin was taken from the optimizedDALImodel. The line intensity was extracted from the integrated intensity map in radial bins as in Sect. 3.1, with a bin size of 0.100 [11.7 AU]. Equation1was then used to determine the radial column density of DCO+. Assuming the gas is composed primarily of H2, the
H2mass can be used to convert the gas surface density profile of
theDALImodel into a gas column density profile. Dividing the DCO+radial column density by the gas radial column density gives a radial abundance profile for DCO+.
Figure3shows the DCO+radial abundance. The profile has an inner radius of 13 AU and an outer radius at 180 AU, corre-sponding to the inner and outer radii of the model gas surface density. Beyondr=56 AU, the abundance increases with radius by a factor of about 5 with values ranging from 1−5×10⁻¹²,
which are comparable values to the DCO+ radial abundance estimates for HD 163296 (Salinas et al. 2017). Similar trends of DCO+abundance increasing with radius have been observed in TW Hya and DM Tau (Qi et al. 2008;Teague et al. 2015).
The sharp increase in abundance at r =56 AU is due to the
δgas,gap=0.025 depletion factor in the surface density of the gas
forr<Rgap out(56 AU). Within the errors, the abundance profile
remains relatively flat at radii less thanRgap out. Due to the
prox-imity to the central star, DCO+in this region is likely formed via the warm deuterium fractionation pathway.
4.3. Parameterized models
We move from the one-dimensional derivation of the DCO+ radial profiles to a two-dimensional DCO+structure to explore variations in abundance for different radii and heights in the disk. For this we parameterize the HD 169142 physical disk structure obtained from the optimizedDALImodel, shown in Fig.4. The
DALI code calculates the dust temperature, the local radiation field, heating and cooling rates, molecular abundances, and gas temperature self-consistently, making it difficult to isolate and explore individual parameters that may affect DCO+ emission. We examine the effect of alterations to the disk gas temperature and CO abundance on DCO+production by employing a simple, parameterized modeling technique using the steady-state, ana-lytic chemical code (hereafter DCO+ CHEMNET) from Murillo et al.(2015). This time-independent chemical model is preferred because the chemical timescales for gas-phase reactions are suf-ficiently fast that a steady state is achieved at times much shorter than the estimated lifetime of the HD 169142 disk (∼10 Myr).
Murillo et al.(2015) have already shown that theDCO+ CHEM
-NETcode reproduces the trends of full, time-dependent chemical models for protostellar envelopes. We extend this treatment to the protoplanetary disk environment. Section 4.1, Table 1, and sub-sect. 4.2.3 in their paper give a full description of the chemical network, the simplified set of DCO+formation and destruction reactions via the cold deuterium fractionation pathway, and a comparison to a full chemical network.
Fig. 4.Two-dimensional physical structure of the HD 169142 disk from the optimized DALImodel (Appendix A).Top: gas density structure. The gas density contours (dashed black) are shown as log(ngas).Middle: gas temperature structure below 100 K. Temperature contours are shown in dashed blue.Bottom: CO abundance structure with respect to H2.
molecular hydrogen density,nH2, and the HD abundance is
con-stant atXHD=nHD/nH=10−5 throughout the disk. The cosmic
ray ionization rate of H2is set toζcr=1.26×10⁻¹⁷s−1.
The parameterized models are used to probe the conditions near the midplane of the outer disk, a region to which previ-ously observed CO isotopologue tracers are not sensitive. The CO observations do not probe all the way down to the midplane
in the outer disk and only a small amount of CO is absent from the total column density, while DCO+production is highly sen-sitive to the midplane conditions (Mathews et al. 2013;Qi et al. 2015;Favre et al. 2015;Huang et al. 2017). The CO lines become optically thick beyondRdust out(83 AU) near the midplane of the
optimizedDALImodel (z/r< 0.2 and < 0.1 for12CO and C18O,
respectively) so the physical structure is not constrained in this region. Therefore, in all parameterized models, only the region r>83 AU andz/r< 0.1 was altered since this is theτmm= 1
sur-face of C18OJ=2−1 from theDALImodel. The regionz/r<
0.1 quickly becomes highly optically thick for C18OJ =2−1 with optical depths ofτmm= 10 near the midplane. Forz/r> 0.1,
the C18O abundance of the model would be sensitive to changes in the gas temperature. Thus, wherez/r< 0.1, we can alter the disk structure without affecting the intensity profiles of the CO isotopologues.
Five parameterized model scenarios are tested: a disk with high midplane CO abundance, a disk with low midplane CO abundance, a cold disk, a shadowed cold disk, and a shadowed cold disk including CO depletion. The aim is to initially test the CO abundance and the gas temperature separately to investigate which parameter has a stronger influence on the production of DCO+. These two parameters are intrinsically interlinked (i.e., more CO freeze-out will occur in lower temperature environ-ments), and the parameterized models allow us to explore these effects in isolation. In the parameterized models we also include an additional DCO+constant abundance region to act as a proxy for warm DCO+formation.
Fits to the radial intensity profile of the data are used to evaluate the model parameters. To obtain model intensity profiles, synthetic DCO+image cubes are created using the two-dimensional gas density, gas temperature, and DCO+abundance structure fromDCO+ CHEMNET as input to the LIne Modeling Engine (LIME; Brinch & Hogerheijde 2010) radiative transfer code. TheLIME code was run in LTE with 30 000 grid points to create synthetic images of the DCO+J=3−2 transition. The images are continuum-subtracted and sampled in theuvplane using the PYTHON vis_sample1 routine, which reads the uv coordinates directly from our observed ALMA measurement set and creates synthetic visibilities of the model. The model visibil-ities are imaged inCASAusing CLEANwith natural weighting, and an integrated intensity map is created over the same velocity range as the data (5.4–8.8 km s−1). Azimuthally averaged ellip-tical annuli projected to the disk inclination and position angle are used to extract the integrated intensity of the model with the same radial bins as the data.
4.3.1. DCO+from deuterium fractionation
Formation of DCO+ occurs as a result of deuterium fraction-ation, which is an enhancement in the D/H ratio observed in certain deuterium-bearing molecules. Typically, deuterium frac-tionation occurs in colder environments such as pre-stellar cores and below the surface layers of protoplanetary disks because of the lower zero-point energies of the deuterated molecular ions (Brown & Rice 1986;Millar et al. 1989). Deuterium frac-tionation in the low-temperature regime occurs via the reaction (Wootten 1987)
HD + H+3 ←→ H2 + H2D++ ∆E, (3)
Table 3.Parameterized models of HD 169142.
Model Disk region Temperature profile Abundance Modifications
r z/r Ta CO factorb X(DCO+warm)c
[AU] [K] [×CO]
High CO ≥83 <0.1 Tgas 10 2.0×10⁻¹²
Low CO ≥83 <0.1 Tgas 0.1 2.0×10⁻¹²
Cold disk ≥83 <0.1 Tgas−2 − 2.0×10⁻¹²
Cold disk−shadowed 83–120 <0.1 Tgas−8 − 2.0×10⁻¹²
>120 <0.1 Tgas−2 − 2.0×10⁻¹²
Cold disk−shadowed 83–120 <0.1 Tgas−8 0.2 2.0×10⁻¹²
and depleted >120 <0.1 Tgas−2 − 2.0×10⁻¹²
Notes.(a)T
gasis the two-dimensional gas temperature structure taken from the optimizedDALImodel (Fig.4).(b)The CO factor is multiplied by the CO abundance structure taken from the optimizedDALImodel (Fig.4).(c)TheX(DCO+
warm) component is included from 30–70 K.
where∆E= 220 K (Roberts & Millar 2000;Gerlich et al. 2002;
Albertsson et al. 2013). This deuterium fractionation pathway is typically efficient at temperatures below∼30 K due to the energy barrier∆E for the back-reaction. The DCO+ molecule is then formed by the following reaction
H2D+ + CO −→ H2 + DCO+. (4)
Gas-phase CO is needed to produce DCO+, but CO will also rapidly combine with H+3, quenching the production of H2D+.
Thus there is a balance where CO must be sufficiently depleted for H2D+ to remain abundant yet enough gas-phase CO must
be present so that DCO+ may form. The simple chemical net-work from Murillo et al.(2015) is used in this work to model DCO+produced via the cold deuterium fractionation pathway. The model shown in Fig. 4 suggests that DCO+ is expected throughout much of the disk midplane, as temperatures are cold enough for CO freeze-out and the production of H2D+.
Deuterium fractionation in disks can also occur when HD and CH+3 combine to create H2 and CH2D+ (Millar et al. 1989). The molecule DCO+is then formed via CH2D+reactions
directly or via one of its products, CH4D+. The energy barrier for
the back-reaction of this deuterium fractionation pathway was recently revised (∆E= 654 K;Roueff et al. 2013) and suggests that CH2D+, and therefore DCO+, could be formed efficiently
at higher temperatures. In recent models of the TW Hya disk with a full deuterium chemical network,Favre et al.(2015) find that T≥71 K is sufficient to switch off the production of DCO+ formed via CH2D+. The warmer CH2D+ fractionation route
dominates over the cold H2D+fractionation route for
tempera-tures greater than ∼30 K because of the higher energy barrier and the fact that H2will readily destroy H2D+above∼30 K.
4.3.2. CO abundance versus gas temperature
Table3shows the parameters used for each model scenario. The high CO and low CO models respectively increase and decrease the CO abundance in the region of interest (r>83 AU andz/r< 0.1) in order to determine how changes in the availability of gas-phase CO influence the DCO+emission. The cold disk model tests the influence of the gas temperature on the DCO+emission by moderately decreasing the temperature profile in the region of interest. The shadowed cold disk model expands on the cold disk model by creating a secondary colder region just outside of the edge of the millimeter grains.
In this work we do not include a chemical network describ-ing the formation of DCO+via the warm deuterium fractionation
pathway. The complexity of hydrocarbon cation chemistry on which the warm deuterium fractionation pathway depends intro-duces large uncertainties in the results of even basic chemical networks. As a first-order approximation, we instead adopt a region of constant DCO+ abundance for 30 K ≤ T ≤ 70 K, with the lower temperature limit based on the energy barrier of the back reaction for Eq. (3) and the upper temperature limit based on the results of Favre et al. (2015), where they find that formation of DCO+ via the warm deuterium fractionation pathway is effectively switched off at 71 K. In this way we introduce a proxy in the model that is representative of DCO+ production in the high-temperature regime, with the reasonable expectation that the warmer pathway will contribute little to the emission of the outer disk (Öberg et al. 2015), which is the focus of this work. Further investigation on the detailed con-tribution of the warm deuterium fractionation pathway to the overall DCO+ production, with particular attention to the inner regions of the disk at radii.50 AU, will be the focus of future work.
The constant abundance component from 30–70 K is tuned so that the model radial profile matches the intensity of the observed DCO+emission from 40–70 AU, where warm DCO+ is the primary contributor before peaking and turning over at 70–80 AU. This gives X(DCO+warm) = 2.0×10⁻¹², which
is consistent with the DCO+ abundance found byWillacy & Woods(2009) in models of a protoplanetary inner disk at radii less than 30 AU, and consistent with the abundance between 30–70 K in more recent work by Öberg et al. (2015) in their model of IM Lup. It is roughly one to two orders of magni-tude lower than the abundance found by Favre et al. (2015), but their warm DCO+ was confined to a thin layer spanning only 1–2 AU at radii less than 60 AU. In HD 169142 the 30–70 K layer spans roughly 5–15 AU, depending on the radius, and results in a DCO+column density on the order of 1012cm−2,
which is consistent with Favre et al. (2015). With this treat-ment, the warm deuterium fractionation pathway contributes
<20% to the DCO+ radial intensity profile for r > 83 AU in all models considered. For r < 83 AU, the warm compo-nent is the primary contributor to the overall DCO+, producing
>80–95% of the emission, depending on the model. For r .
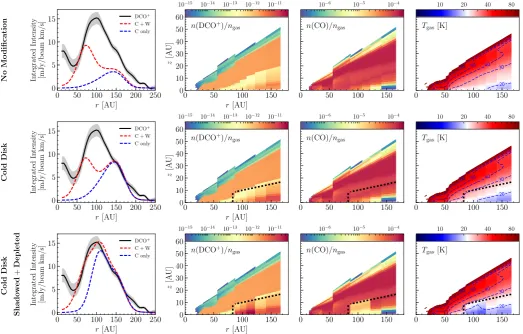
Figure 5 shows the gas temperature map and 12CO abundance map used as input, the DCO+abundance map calcu-lated byDCO+CHEMNETand including the constant abundance warm component, and the DCO+radial intensity profiles derived from the LIME synthetic images with only the cold deuterium fractionation pathway active (C only) and with the constant abundance warm component included (C + W). The no modi-fications model in the first row of Fig.5uses the input from our optimizedDALImodel with no alterations to the midplane disk structure. It is already clear that the DCO+ emission is under-produced by the DCO+ CHEMNET code for the disk structure outlined in AppendixA.
In the low CO abundance case, an order of magnitude decrease in midplane gas-phase CO abundance results in a factor of two to three decrease in DCO+emission because there is no longer enough gas-phase CO available to efficiently form DCO+. The high CO abundance model with an one order of magni-tude increase in gas-phase CO abundance results in only a factor of two increase in DCO+emission, highlighting the non-linear nature of the chemistry. CO abundances in this model become much higher than the canonical value of∼10−4with respect to H
2
in the midplane of disk where CO depletion is expected; hence, this model is physically unrealistic. Order of magnitude varia-tions to the CO abundance do not have a significant influence on the formation of DCO+near the outer disk midplane for the physical structure given by the optimizedDALImodel.
The second and third rows of Fig. 5 illustrate increas-ingly colder midplane scenarios. In the cold disk model case, a decrease of 2 K in the gas temperature provides an improved fit to the DCO+radial profile but still fails to fully recover much of the DCO+between 80–140 AU. It matches the observed inten-sity profile well beyond 150 AU. The shadowed cold disk model expands on the cold disk model to invoke a secondary cold region fromr=83−120 AU withT =Tgas−8 K. For the
sec-ondary cold region, the outer boundary and temperature drop parameters are explored from 100–140 AU in steps of 10 AU and from Tgas−3 K to Tgas−10 K in steps of 1 K,
respec-tively. The outer boundary at 120 AU and the temperature drop ofTgas−8 K was found to provide the best improvement on the
fit to the DCO+profile. More DCO+is produced in the shadowed cold disk model between 80–150 AU than in the cold disk model case, but it is still not enough to capture the 100 AU peak. The final model invokes CO depletion in the secondary cold region of the shadowed cold disk model, which would be expected for significantly colder disk regions. The CO abundance is reduced by a factor of five betweenr=83−120 AU. CO depletion factors of two, five, and ten are tested, with a factor of five resulting in the right amount of DCO+emission. In this scenario, the DCO+ radial intensity profile, including the 100 AU peak, is reproduced well.
The efficiency of the cold deuterium fractionation pathway, and thus the production of DCO+, is also affected by cosmic ray ionization, ζcr, and the ortho-to-para (o/p) ratio of H2.
Ionization of H2 in the disk by cosmic rays will affect the
number of H+3 ions and the number of free electrons. TheDCO+
CHEMNETcode was rerun for the model with no modifications to test changes to the cosmic ray ionization rate, initially set toζcr =1.26×10⁻¹⁷ s−1. There is evidence that the local ISM
in the HD 169142 region may reach values of ζcr = 1−5×
10−16 s−1 (Indriolo et al. 2007; Neufeld & Wolfire 2017). An
increase in ζcr of one order of magnitude results in DCO+
emission comparable to the cold disk model, meaning that the amount of DCO+ observed at r > 120 AU may be a consequence of a higher local cosmic ray ionization rate or
may be due to a moderate decrease in the gas temperature of the outer disk. Ionization of the outer disk by UV radiation may influence the cold deuterium fractionation pathway and free electron population differently, but the effect is not mod-eled here. Such ionization would influence primarily the disk upper layers, as UV photons will not reach the disk midplane with a sufficient flux to outpace ionization due to cosmic rays.
The ortho-to-para (o/p) ratio of H2influences the survival of
H2D+in cold regions of the disk because the back-reaction in
Eq. (3) has a lower energy barrier for o-H2(∆E= 61 K) than for
p-H2 (∆E= 232 K;Walmsley et al. 2004). We apply a thermal
treatment of the o/p ratio of H2in LTE followingMurillo et al.
(2015) with o/p=9×exp(−170/T), whereTis the gas tempera-ture, and again rerunDCO+CHEMNETcode for the no modifica-tion model including the H2o/p ratio, which was not considered
in the original models. In this case, too much DCO+emission is produced in the outer disk forr>150 AU, but DCO+is under-produced for r < 150 AU. However, this requires an efficient equilibration of the H2 spin temperature with the gas
tempera-ture, rather than the 3:1 obtained from grain surface formation of H2. The degree of cosmic ray ionization and the precise
distribu-tion of the o/p ratio of H2will affect the exact values for the
tem-perature drop and CO depletion necessary to obtain a fit to the DCO+radial intensity profile, but our overall conclusions remain unchanged.
Based on the best-fit shadowed and depleted cold disk model, a significantly colder outer disk midplane with increased CO freeze-out is the most likely scenario for DCO+ production beyond the millimeter grains. The DCO+emission atr>120 AU could be reproduced with a small drop in the gas temperature or an increase in the cosmic ray ionization rate. The model-ing efforts presented here show that DCO+emission can reveal structure in low-temperature regions in the midplane of disks that are not apparent in the CO isotopologues.
5. Discussion
The interpretation of DCO+ emission regarding its chemical origins and location within the disk is complicated by the mul-tiple deuterium fractionation pathways available. The two main pathways (cold, via H2D+fractionation and warm, via CH2D+
fractionation) are efficient over different temperature ranges, therefore it is useful to consider DCO+ emission from distinct regions of the disk where the conditions are expected to be more favorable for one fractionation pathway over the other. The inner disk provides warmer temperatures that can switch off the H2D+
pathway, while the outer disk hosts a cold midplane that allows the H2D+pathway to operate efficiently.
5.1. Inner disk DCO+
In models of TW Hya including a full deuterium chemical net-work,Favre et al.(2015) found that DCO+observed in the inner tens of AU is not primarily formed by the cold deuterium frac-tionation pathway via H2D+because of the warm temperatures
of the inner disk. The physical structure in Fig. 4 shows that the disk around HD 169142 is far too warm in the inner 50 AU for the H2D+fractionation pathway to be the main contributor.
Instead, DCO+ in this region is likely formed by the warmer CH2D+fractionation pathway. The disk temperature at the
0 50 100 150 200 250 r[AU] 0 5 10 15 In tegrated In tensit y [mJy / b eam km / s] DCO+ C + W C only
0 50 100 150
r[AU] 0 10 20 30 40 50 60 z [A U]
n(DCO+)/n gas
10−15 10−14 10−13 10−12 10−11
0 50 100 150
n(CO)/ngas
10−6 10−5 10−4
0 50 100 150
Tgas[K]
20
30
40
50
70
10 20 40 80
No
Mo
dification
0 50 100 150 200 250
r[AU] 0 5 10 15 In tegrated In tensit y [mJy / b eam km / s] DCO+ C + W C only
0 50 100 150
r[AU] 0 10 20 30 40 50 60 z [A U]
n(DCO+)/n gas
10−15 10−14 10−13 10−12 10−11
0 50 100 150
n(CO)/ngas
10−6 10−5 10−4
0 50 100 150
Tgas[K]
20
30
40
50
70
10 20 40 80
Cold
Disk
0 50 100 150 200 250
r[AU] 0 5 10 15 In tegrated In tensit y [mJy / b eam km / s] DCO+ C + W C only
0 50 100 150
r[AU] 0 10 20 30 40 50 60 z [A U]
n(DCO+)/n gas
10−15 10−14 10−13 10−12 10−11
0 50 100 150
n(CO)/ngas
10−6 10−5 10−4
0 50 100 150
Tgas[K]
20
30
40
50
70
10 20 40 80
[image:10.595.37.561.82.416.2]Cold Disk Shado w ed + Depleted
Fig. 5. Parameterized modifications to the optimized DALI model described in Appendix A. Right and right-middle plots: gas tempera-ture and CO abundance, respectively. The black dashed box shows the modified region.Left-middle plot: DCO+ abundance map calculated with DCO+ CHEMNET with the 30–70 K constant abundance warm component included. Left plot: DCO+ radial intensity profiles of the data (solid black with shaded gray 1σ errors) and of the model with the cold component only (C only; dashed blue) and with warm component included (C + W; dashed red). Top: optimized DALI model with no modifications made to the gas temperature or CO profile.
Middle: cold disk model. The gas temperature is decreased by 2 K in the black dashed region.Bottom: shadowed and depleted cold disk model. This is an extension of the cold disk model to simulate a secondary colder region beyond the millimeter dust edge. The gas temperature is decreased by 8 K with CO depleted by a factor of five fromr=83−120 AU. The gas temperature is decreased by 2 K forr>120 AU.
at temperatures greater than 70 K. Alternatively, we may be missing a cool inner component, such as inner disk dust rings that could keep temperatures low enough for the warm deuter-ation fractiondeuter-ation pathway to remain active. Andrews et al.
(2016) observed optically thick millimeter dust rings on the order of a few AU in the disk around TW Hya. Recent work by Ligi et al.(2018) presented a tentative detection of another dust ring in the HD 169142 disk located at ∼0.100 [12 AU at 117 pc] using VLT/SPHERE radial differential imaging with the Infrared Dual-band Imager and Spectrograph and the Integral Field Spectrograph instruments.
The molecule DCN provides another avenue to probe the warm component of DCO+ emission as it is also formed via warm deuterium fractionation in disks (Millar et al. 1989). Co-spatial peaks in DCO+and DCN would indicate that the warm deuterium fractionation pathway is a strong contributor to the production of DCO+. Recent observations of DCN and DCO+in several T Tauri and Herbig Ae/Be sources show them peaking in different regions of the disk, but with some DCO+present where the DCN peaks, indicating that the warm deuterium fractionation pathway contributed partially to the DCO+ emission (Qi et al. 2008; Öberg et al. 2012; Huang et al. 2017; Salinas et al. 2017).
5.2. Outer disk DCO+
In order to recover the observed DCO+ radial intensity pro-file, it was necessary to modify the structure of the optimized
DALImodel from Fig.4to include a much colder, CO depleted region beyond the edge of the millimeter grains. The cause of the decrease in temperature could be due to the number and loca-tion of micron-sized grains in the outer disk, which have been observed out to at least 200 AU in scattered light imaging (Quanz et al. 2013;Momose et al. 2015;Monnier et al. 2017;Pohl et al. 2017). The exact, local distribution of the micron-sized grains in the HD 169142 disk might be different than the distribution approximated in the optimizedDALImodel, leading to lower gas temperatures in the outer disk.
The fact that the peak in the DCO+ radial intensity pro-file occurs at 100 AU is already evidence that the colder H2D+
as CO begins to freeze out onto dust grains, but is still suffi-ciently abundant in the gas-phase to allow for the formation of DCO+.Macías et al.(2017) previously compared the C18O and
DCO+ radial intensity profiles and similarly concluded that a co-incident slope change in the C18O and peak in the DCO+is
evidence that DCO+ is tracing the CO snow line, which they locate at∼100 AU. The modeling done in this work shows that invoking a cold, CO depleted region in the outer disk midplane from∼80–120 AU is necessary to recover the DCO+radial inten-sity profile in the parameterized models, indicating that the bulk of the DCO+does indeed trace regions of CO freeze-out in the HD 169142 disk.
There is tentative evidence for an outer DCO+ring, seen as a bump in the DCO+ radial profile at the edge of the gaseous disk around 200 AU. Similar DCO+ structure has been seen in other disks, e.g., IM Lup, LkCa 15, and HD 163296 (Öberg et al. 2015; Huang et al. 2017; Salinas et al. 2017; Flaherty et al. 2017). An outer ring could indicate that some CO ice is returned to the gas phase in the outer disk via thermal desorp-tion caused by a temperature inversion or via photodesorpdesorp-tion by UV radiation (Huang et al. 2016;Cleeves 2016;Cleeves et al. 2016;Facchini et al. 2017). The observed bump is weaker than the outer DCO+ ring in other disks, suggesting that the HD 169142 disk remains cold out to large radii or that the degree of CO freeze-out in this disk may not be as extreme as in other sources.
Follow-up observations of N2H+in this disk could provide
further insight into the relationship between DCO+ and CO freeze-out. Formation of N2H+ requires low temperatures and
significant CO depletion, and therefore is expected to be abun-dant only in the cold midplane where there is a high degree of CO frozen out onto the surface of dust grains (Walsh et al. 2012; Qi et al. 2015;van’t Hoff et al. 2017). Co-spatial emis-sion of N2H+ and DCO+ in the outer disk would place strong
constraints on the extent to which DCO+is directly tracing CO freeze-out.
6. Conclusions
In this paper we present∼0.300resolution ALMA observations of DCO+J=3−2 in the protoplanetary disk around HD 169142. We update the fiducialDALImodel fromFedele et al.(2017) to include small dust grains throughout the disk and employ a sim-ple deuterium chemical network to investigate the production of DCO+ formed by the cold deuterium fractionation pathway via H2D+. The CO abundance and gas temperature structure of
the DALI disk model is adapted in a parameterized way using theDCO+CHEMNETcode to recover the observed DCO+radial intensity profile. The warm deuterium fractionation pathway via CH2D+ is approximated with a constant abundance between
30–70 K in the parameterized models. The conclusions of this work are the following:
– DCO+ has a broad, ring-like morphology over radii
∼50–230 AU in the disk around HD 169142, with most of the emission located outside of the millimeter continuum edge. There is an inner component to the DCO+radial profile with emission returning in the central∼30 AU. The DCO+ radial intensity profile peaks at∼100 AU, with a tentative secondary bump at∼200 AU.
– Parameterized modeling of the HD 169142 disk shows that lowering the gas temperature in optically thick regions near the midplane of the outer disk by several Kelvin has a signifi-cant effect on the DCO+profile. Order of magnitude changes to the CO abundance in the same region cause the DCO+
radial profile to increase or decrease only by a factor of 2–3, still under-producing the amount of observed DCO+. It was necessary to invoke both effects to successfully reproduce the full radial intensity profile.
– The best-fit parameterized model has a shadowed, cold region with CO depletion near the disk midplane just beyond the edge of the millimeter grains. For z/r < 0.1 and r > 83 AU, the model recovers the radial intensity profile of DCO+with aT =Tgas−8 K region with a factor of five CO
depletion fromr=83−120 AU, and aT =Tgas−2 K region
forr>120 AU. The exact values for the drop inTgasand CO
abundance will also depend on the ionization degree and the ortho-to-para ratio of H2. The fact that the added shadowed
region is needed to recover the 100 AU radial intensity peak highlights the sensitivity of DCO+ to small changes in the gas temperature and CO abundance structure.
– The best-fit model suggests that the contribution to the over-all DCO+ emission from the cold deuterium fractionation pathway via H2D+ is >85% atr >83 AU, while the
con-tribution from the warm deuterium fractionation pathway via CH2D+ is >80% at radii less than r <83 AU using
a constant abundance of X(DCO+warm) =2.0×10⁻¹² from
30–70 K. The warm component does not recover the return of DCO+ emission within ∼30 AU for the current disk structure.
– DCO+is an optically thin molecular tracer that acts as a fil-ter to detect disk substructure that is not observable in more abundant, and therefore more easily detectable, molecular tracers such as12CO,13CO, and C18O. In this work, DCO+ observations reveal the low-temperature (.25 K) midplane structure in the disk around HD 169142.
This work shows that DCO+ can be used as a valuable tracer of protoplanetary disk midplane conditions with simple models and chemical networks. To fully characterize the complex chem-ical origins of DCO+ in the disk around HD 169142, full dust evolution models (e.g.,Facchini et al. 2017) and an expanded deuterium chemical network such as the one used byFavre et al.
(2015) would be required. Further constraints could be placed on the origins of DCO+ with future ALMA observations of addi-tional chemical tracers, such as DCN and N2D+, that would
correlate with DCO+formed via the warm and cold deuterium fractionation pathways, respectively.
Acknowledgements. The authors thank the anonymous referee for useful
com-ments that helped to improve the paper. M.T.C. thanks A. Pohl for providing the VLT/SPHEREJband polarized intensity data. M.T.C. and M.R.H. acknowl-edge support from the Netherlands Organisation for Scientific Research (NWO) grant 614.001.352. C.W. acknowledges the NWO (grant 639.041.335) and the University of Leeds for financial support. D.F. and C.F. acknowledge sup-port from the Italian Ministry of Education, Universities and Research, project SIR (RBSI14ZRH). This paper makes use of the following ALMA data: ADS/JAO.ALMA# 2013.1.00592.S. ALMA is a partnership of ESO (represent-ing its member states), NSF (USA) and NINS (Japan), together with NRC (Canada), NSC and ASIAA (Taiwan), and KASI (Republic of Korea), in coop-eration with the Republic of Chile. The Joint ALMA Observatory is operated by ESO, AUI/NRAO and NAOJ. A.M. acknowledges an ESO Fellowship.
References
Albertsson, T., Semenov, D. A., Vasyunin, A. I., Henning, T., & Herbst, E. 2013,
ApJS, 207, 27
ALMA Partnership, Brogan, C. L., Pérez, L. M., et al. 2015,ApJ, 808, L3
Andrews, S. M., Wilner, D. J., Zhu, Z., et al. 2016,ApJ, 820, L40
Banzatti, A., Pinilla, P., Ricci, L., et al. 2015,ApJ, 815, L15
Bergin, E. A., & Tafalla, M. 2007,ARA&A, 45, 339
Blondel, P. F. C., & Djie, H. R. E. T. A. 2006,A&A, 456, 1045
Brinch, C., & Hogerheijde, M. R. 2010,A&A, 523, A25
Brown, R. D., & Rice, E. H. N. 1986,MNRAS, 223, 429
Bruderer, S. 2013,A&A, 559, A46
Bruderer, S., van Dishoeck, E. F., Doty, S. D., & Herczeg, G. J. 2012,A&A, 541, A91
Carney, M. T., Hogerheijde, M. R., Loomis, R. A., et al. 2017, A&A, 605, A21
Casassus, S., van der Plas, G., Sebastian Perez, M., et al. 2013,Nature, 493, 191
Cleeves, L. I. 2016,ApJ, 816, L21
Cleeves, L. I., Öberg, K. I., Wilner, D. J., et al. 2016,ApJ, 832, 110
D’Alessio, P., Calvet, N., Hartmann, L., Franco-Hernández, R., & Servín, H. 2006,ApJ, 638, 314
Dunkin, S. K., Barlow, M. J., & Ryan, S. G. 1997,MNRAS, 286, 604
Facchini, S., Birnstiel, T., Bruderer, S., & van Dishoeck E. F. 2017,A&A, 605, A16
Favre, C., Bergin, E. A., Cleeves, L. I., et al. 2015,ApJ, 802, L23
Fedele, D., Carney, M., Hogerheijde, M. R., et al. 2017,A&A, 600, A72
Fedele, D., Tazzari, M., Booth, R., et al. 2018,A&A, 610, A24
Flaherty, K. M., Hughes, A. M., Rose, S. C., et al. 2017,ApJ, 843, 150
Flower, D. R. 1999,MNRAS, 305, 651
Gaia Collaboration (Brown, A. G. A., et al.) 2016,A&A, 595, A2
Geers, V. C., Augereau, J.-C., Pontoppidan, K. M., et al. 2006,A&A, 459, 545
Gerlich, D., Herbst, E., & Roueff, E. 2002,Planet. Space Sci., 50, 1275
Grady, C. A., Schneider, G., Hamaguchi, K., et al. 2007,ApJ, 665, 1391
Helou, G., & Walker, D. W., eds. 1988,Infrared Astronomical Satellite (IRAS) Catalogs and Atlases., 7, 1
Huang, J., Öberg, K. I., & Andrews, S. M. 2016,ApJ, 823, L18
Huang, J., Öberg, K. I., Qi, C., et al. 2017,ApJ, 835, 231
Indriolo, N., Geballe, T. R., Oka, T., & McCall, B. J. 2007,ApJ, 671, 1736
Isella, A., Guidi, G., Testi, L., et al. 2016,Phys. Rev. Lett., 117, 251101
Li, A., & Lunine, J. I. 2003,ApJ, 594, 987
Ligi, R., Vigan, A., Gratton, R., et al. 2018,MNRAS, 473, 1774
Macías, E., Anglada, G., Osorio, M., et al. 2017,ApJ, 838, 97
Malfait, K., Bogaert, E., & Waelkens, C. 1998,A&A, 331, 211
Mathews, G. S., Klaassen, P. D., Juhász, A., et al. 2013,A&A, 557, A132
McMullin, J. P., Waters, B., Schiebel, D., Young, W., & Golap, K. 2007, in
Astro-nomical Data Analysis Software and Systems XVI, eds. R. A. Shaw, F. Hill,
& D. J. Bell,ASP Conf. Ser., 376, 127
Miao, Y., Mehringer, D. M., Kuan, Y.-J., & Snyder, L. E. 1995,ApJ, 445, L59
Millar, T. J., Bennett, A., & Herbst, E. 1989,ApJ, 340, 906
Miotello, A., Bruderer, S., & van Dishoeck E. F. 2014,A&A, 572, A96
Miotello, A., van Dishoeck, E. F., Kama, M., & Bruderer, S. 2016,A&A, 594, A85
Momose, M., Morita, A., Fukagawa, M., et al. 2015,PASJ, 67, 83
Monnier, J. D., Harries, T. J., Aarnio, A., et al. 2017,ApJ, 838, 20
Müller, H. S. P., Schlöder, F., Stutzki, J., & Winnewisser, G. 2005,J. Mol. Struct., 742, 215
Murillo, N. M., Bruderer, S., van Dishoeck, E. F., et al. 2015,A&A, 579, A114
Neufeld, D. A., & Wolfire, M. G. 2017,ApJ, 845, 163
Öberg, K. I., Qi, C., Wilner, D. J., & Hogerheijde, M. R. 2012,ApJ, 749, 162
Öberg, K. I., Furuya, K., Loomis, R., et al. 2015,ApJ, 810, 112
Pani´c, O., Hogerheijde, M. R., Wilner, D., & Qi, C. 2008,A&A, 491, 219
Pascual, N., Montesinos, B., Meeus, G., et al. 2016,A&A, 586, A6
Piso, A.-M. A., Öberg, K. I., Birnstiel, T., & Murray-Clay, R. A. 2015,ApJ, 815, 109
Pohl, A., Benisty, M., Pinilla, P., et al. 2017,ApJ, 850, 52
Qi, C., Wilner, D. J., Aikawa, Y., Blake, G. A., & Hogerheijde, M. R. 2008,ApJ, 681, 1396
Qi, C., Öberg, K. I., Andrews, S. M., et al. 2015,ApJ, 813, 128
Quanz, S. P., Avenhaus, H., Buenzli, E., et al. 2013,ApJ, 766, L2
Raman, A., Lisanti, M., Wilner, D. J., Qi, C., & Hogerheijde, M. 2006,AJ, 131, 2290
Remijan, A., Snyder, L. E., Friedel, D. N., Liu, S.-Y., & Shah, R. Y. 2003,ApJ, 590, 314
Roberts, H., & Millar, T. J. 2000,A&A, 361, 388
Roueff, E., Gerin, M., Lis, D. C., et al. 2013,J. Phys. Chem. A, 117, 9959
Salinas, V. N., Hogerheijde, M. R., Mathews, G. S., et al. 2017,A&A, 606, A125
Sandell, G., Weintraub, D. A., & Hamidouche, M. 2011,ApJ, 727, 26
Seok, J. Y., & Li, A. 2016,ApJ, 818, 2
Teague, R., Semenov, D., Guilloteau, S., et al. 2015,A&A, 574, A137
Thi, W.-F., Pinte, C., Pantin, E., et al. 2014,A&A, 561, A50
van der Marel, N., van Dishoeck, E. F., Bruderer, S., et al. 2013,Science, 340, 1199
van’t Hoff, M. L. R., Walsh, C., Kama, M., Facchini, S., & van Dishoeck E. F. 2017,A&A, 599, A101
Wagner, K. R., Sitko, M. L., Grady, C. A., et al. 2015,ApJ, 798, 94
Walmsley, C. M., Flower, D. R., & Pineau des Forêts, G. 2004,A&A, 418, 1035
Walsh, C., Nomura, H., Millar, T. J., & Aikawa, Y. 2012,ApJ, 747, 114
Walsh, C., Juhász, A., Pinilla, P., et al. 2014a,ApJ, 791, L6
Walsh, C., Millar, T. J., Nomura, H., et al. 2014b,A&A, 563, A33
Walsh, C., Juhász, A., Meeus, G., et al. 2016,ApJ, 831, 200
Willacy, K., & Woods, P. M. 2009,ApJ, 703, 479
Williams, J. P., & Cieza, L. A. 2011,ARA&A, 49, 67
Wootten, A. 1987, in Astrochemistry, eds. M. S. Vardya, & S. P. Tarafdar,IAU Symp., 822, 67
Yu, M., Willacy, K., Dodson-Robinson, S. E., Turner, N. J., & Evans, N. J. II 2016,ApJ, 822, 53
Zhang, K., Pontoppidan, K. M., Salyk, C., & Blake, G. A. 2013,ApJ, 766, 82
Zhang, K., Bergin, E. A., Blake, G. A., Cleeves, L. I., & Schwarz, K. R. 2017,
Appendix A: Model details
Table A.1.HD 169142DALImodel parameters.
Parameter Value Ref.
M∗ 1.65M 1
Teff 8400 K 2
L∗ 10L 3
d 117 pc 3
i 13◦ 3,4
PA 5◦ 3,4
χ 0.2 3
flarge 0.85 3
ψ 0 3
γ 1 3
hc 0.07 3
Rc 100 AU 3
∆gd 80 3
Σc 6.5 g cm−2 3
Rgas in 13 AU 3 Rdust in 20 AU 3 Rgap in 35 AU 3 Rgap out 56 AU 3 Rdust out 83 AU 3 Rgas out 180 AU 3
δdust 0.27 3
δgas cavity 0.025 3
δgas gap 0.025 3
References.1:Blondel & Djie(2006), 2:Dunkin et al.(1997), 3:Fedele et al.(2017), 4:Raman et al.(2006).
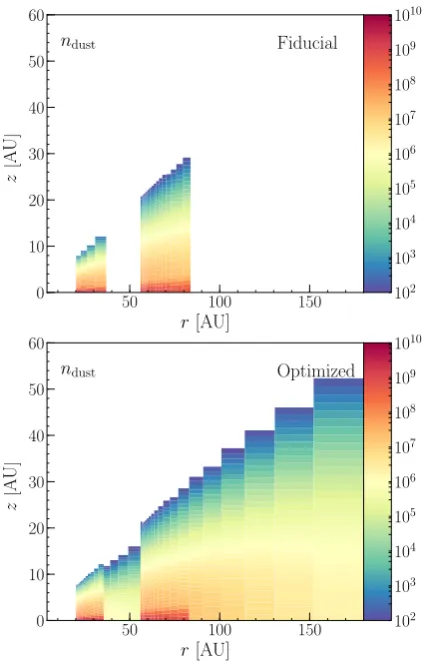
Modifications to the fiducial DALI model from Fedele et al. (2017) were necessary to more accurately incorporate the (sub)micron-sized grain population into the HD 169142 disk model and to obtain a better description of the dust and gas temperature of the outer disk beyond the millimeter con-tinuum edge. Here the modifications are discussed in more detail.
The Fedele et al. (2017) model fit the 1.3 mm dust emis-sion, and dust in their models exists only within dust rings fromr= 20–35 AU and fromr = 56–83 AU. There is no dust of any kind in their models outside of these radii. Observa-tions by Quanz et al. (2013), Monnier et al. (2017), and Pohl et al.(2017) have revealed the presence of a micron-sized dust population in the millimeter ring gap and in the outer disk beyond the millimeter-sized dust population. Monnier et al.
(2017) discussed an outer disk in the context of micron-sized grains observed in the J band with the Gemini Planet Imager. The authors detected a dip in polarized light at∼55 AU which they model as a 40–70 AU gap, and they observed a flared outer ring that peaks at ∼75 AU. The authors adopted a dis-tance of 145 pc for HD 169142. Their radii scaled to the new Gaia distance of 117 pc gives a 32–56 AU gap and a 60 AU outer ring peak in the J band, consistent with the values for the millimeter gap and outer ring observed by Fedele et al.
[image:13.595.96.232.123.401.2](2017).
Fig. A.1.Top: dust structure of the fiducialDALI model fromFedele et al.(2017) with small (0.005–1µm) and large (0.005–1000µm) grains present only in the millimeter rings.Bottom: dust structure of the opti-mizedDALImodel with small grains in the millimeter gap and in the outer disk. The hot inner dust ring is not visible due to the extremely small scale height atr=0.2 AU.
The original dust structure of theFedele et al.(2017) model was
ndust =
0 forr<Rdust in
δdust×ndust forRdust in<r<Rgap in
0 forRgap in<r<Rgap out ndust forRgap out<r<Rdust out
0 forr>Rdust out.
(A.1)
However, the gap is not empty and the micron-sized grains are detected throughout the outer disk, thus their fiducialDALI
model was neglecting the presence of micron-sized grains that would insulate the outer disk midplane and thus lower dust and gas temperatures.
We modified the dust structure of the Fedele et al. (2017) fiducial model to expand the small grain (ndust,small; 0.005–1µm)